CRYPTO TRADING STRATEGY WITH MEDIAN INDICATOR - Steemit Crypto Academy- Homework post for Professor @abdu.navi03 by (@tenguhatanga). 15/03/2022
Hello Prof @abdu.navi03!
I am glad to be a part of your class for the second time in this season. I have gone through the class and below are the solutions to the questions you asked.
1-Explain your understanding with the median indicator.
Median Indicator
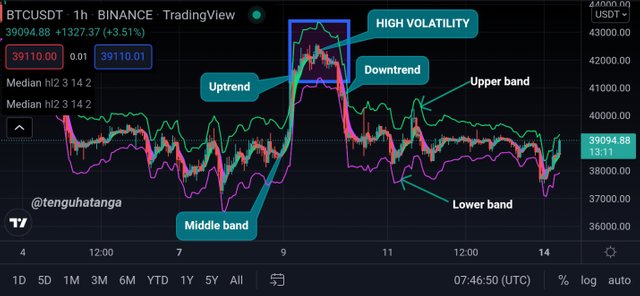
Median indicator is one of the indicators used for the technical analysis of the price and direction of assets which can be crypto, or stock. It is a trend following indicator that is used to take measurements of the rate at which the price of an asset fluctuate and change direction over a period of time. With the use of the length of the chart at a given period, it shows the middle value of high and low making use of Average True Range (ATR). The indicator is made up of three important parts which helps in reading the direction of the price. It has a upper band coloured green, a lower band coloured purple and a middle band that changes colour between green and purple. The upper green band is a representative of a bullish market. So whenever the middle band turns green, we have a bullish trend in the market. Also, the lower purple band is a representation of a bearish market. That is when the middle band turns purple, the market has gone into a bear.
The median indicator therefore displays the trend of the market by the direction in which the middle band moves. An uptrend sets in when the middle band turns green and moves in the direction of the the upper band and when it turns purple and moves in the direction of the lower band, a downtrend sets in.
2-Parameters and Calculations of Median indicator. (Screenshot required)
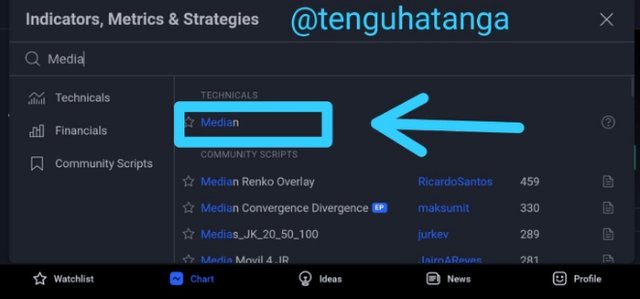
The median indicator can be added to a chart using the tradingview platform as most exchanges and tradimg platforms are limited in indicators. For instance, Binance and Huobi Pro do not have this indicator.
In (tradingview](tradingview.com), the chart of any cryptocurrency asset the median indicator can be added to a chart by clicking on the indicators icon and searching for the indicator and simply clicking on it to add.
TradingView
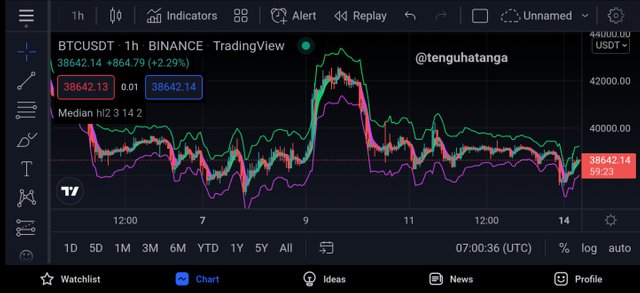
Median Indicator added to BTCUSDT chart
The different parts of the indicator are labeled on the screenshot below.
The parameters used in the calculation of the the median indicator are the ones displayed on the chart below. The values for each parameter in the settings given in the screenshot are the default values for all the parameters.
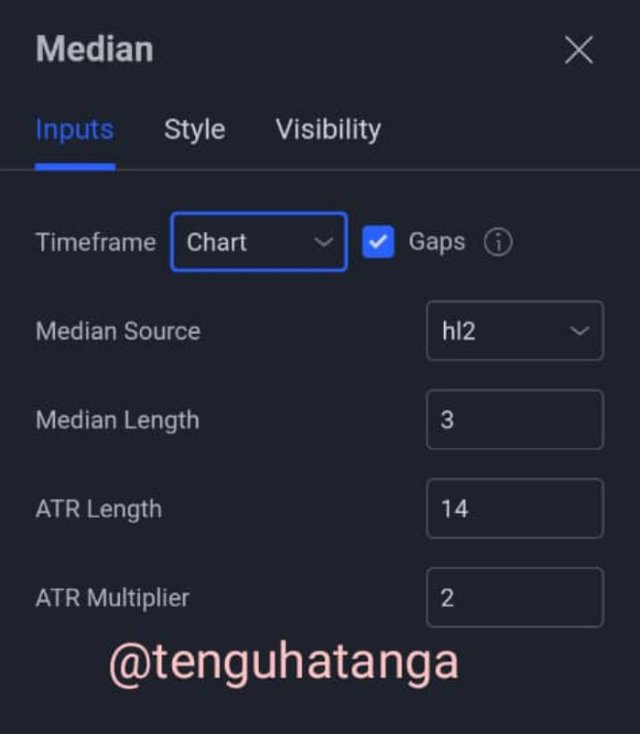
The median length, ATR length and ATR multiplier are the three parameters used to calculate the median indicator.
Median length: The value of this is 3 by default. That means it can be change to a user's taste. It is the number of points that is considered when computing the median.
ATR length: This is the number of periods used to calculate the median ATR. It is 14 by default but can be set to a higher or lower value depending on the type of trader that wants to use it.
ATR multiplier : This is 2 by default and it is used to multiply the ATR length after the upper and lower bands have been formed.
The upper and lower bands are calculated thus :
Upper Band: Median Length + 2ATR
Lower Band : Median length - 2ATR
This gives us a picture of the distance between the middle band and the other two bands.
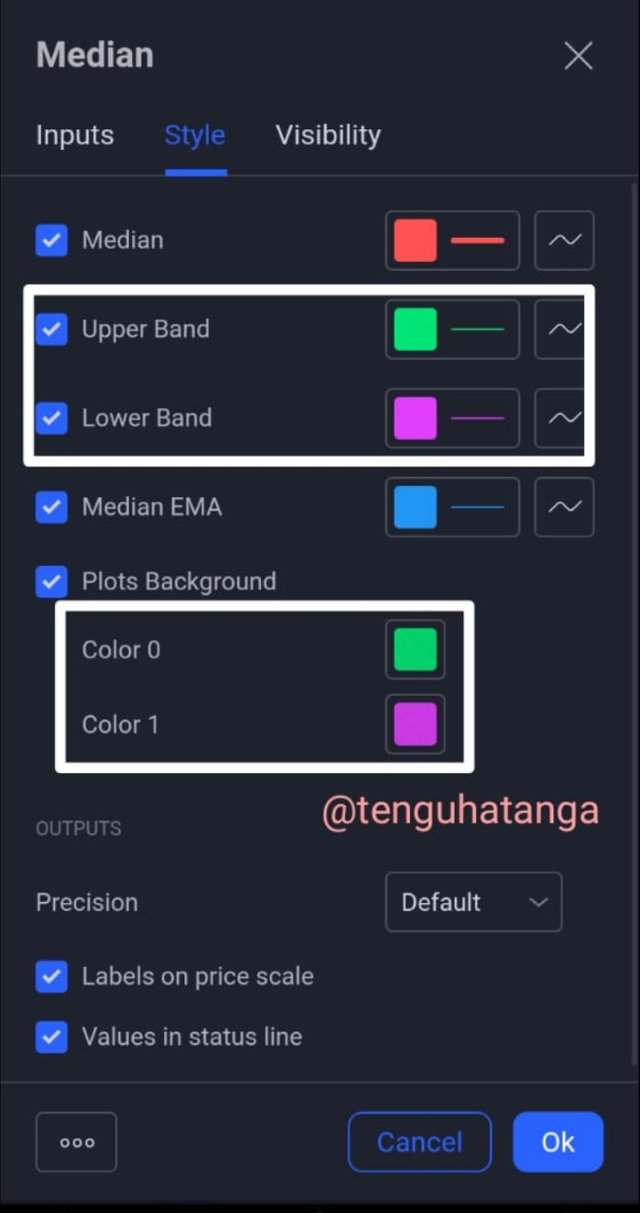
The indicator can be styled to an individual's taste by clicking on style and changing the colours to one's preferences. Once the setting is done, one can click OK to effect the change.
3-Uptrend from Median indicator (screenshot required)
Uptrend from Median indicator is seen when the middle band turns to a green colour and the price is in an upward move. Everything being equal, this can be easily identified on a chart. The uptrend from a Median indicator is just depicted or shown by the green colour of the middle band which also moves in the direction of the the price/trend, towards the upper band.
The screenshots below shows uptrend in Median indicator.
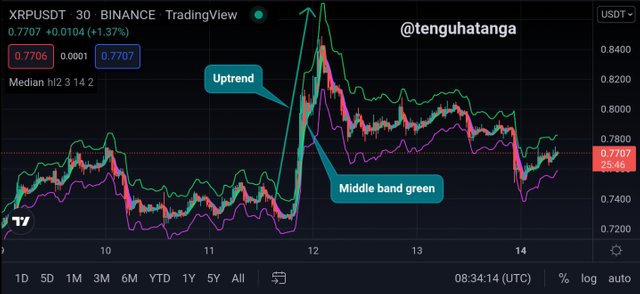
TradingView
The above is a screenshot of XRPUSDT chart with Median indicator showing when the asset was in an uptrend
4-Downtrend from Median Indicator (screenshot required)
When an asset is in a downtrend, the Median indicator shows it by the purple colour of the middle, thick band. The moment the price of an asset starts moving down, the middle band shows a purple colour and begins to move in the direction of the the price, towards the lower band.
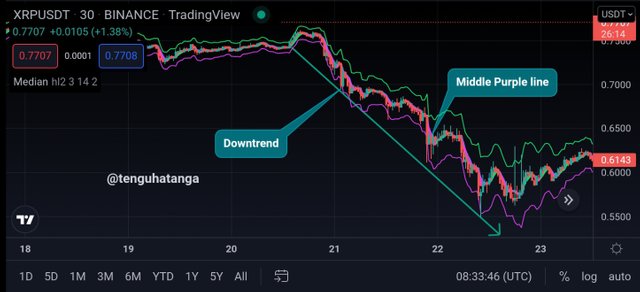
TradingView
The above is a
screenshot of XRPUSDT chart with Median indicator showing when the asset was in a downtrend
5-Identifying fake Signals with Median indicator(screenshot required)
To be able to get the best results from the use of any indicator, one has be very patient so as not to rush into the market when false signals are presented. As no indicator is 100% accurate, one has to be careful enough to confirm the signals presented from an indicator before making any entry into the market.
The median indicator is very useful as a signal confirmation tool for other indicators.To confirm signals/establish confluence and identify false signals using the Median indicator, it is used to confirm signals from other kind of indicator. That is an indicator that is not trend following. Signals from Indicators such as the Stochastic Oscillator, Vortex indicator or RSI can be confirmed using the Median indicator This can either be correct signals or false signals.
In the screenshot of the chart of BTCUSDT below, the wrong signals from Stochastic Oscillator are identified and filtered by the Median indicator.
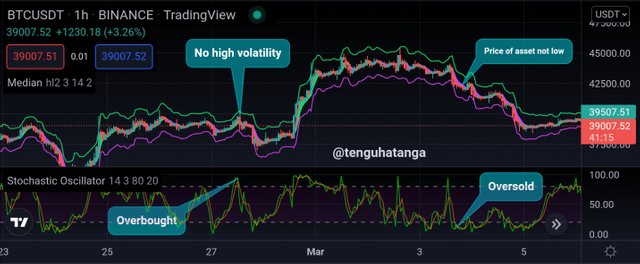
In the first instance, the market was ranging with no any observable huge move in the price of the asset and the stochastic oscillator showed that the asset was overbought. If you look closely at the median indicator, it doesn't present that the asset was highly volatile in the direction concerned.
In the second instance, it is clearly shown that a fake signal was given for the asset where the stochastic oscillator said it was oversold. From what we have on the median indicator, the asset is still in a continuous downtrend, so buy signals have not been presented.
6-Open two demo trades, long and short, with the help of a median indicator or combination that includes a median indicator (screenshot required)
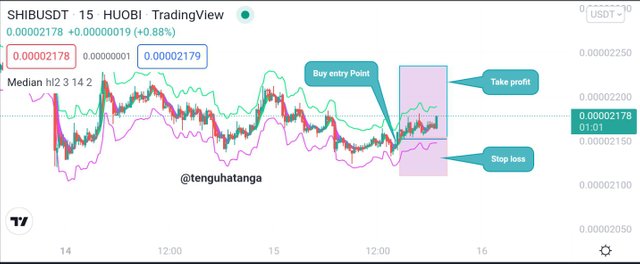
I made analysis of SHIBA INU coin with the median indicator. When I was sure that the middle line has turned green, I made an entry. See the screenshot below to get what I did.
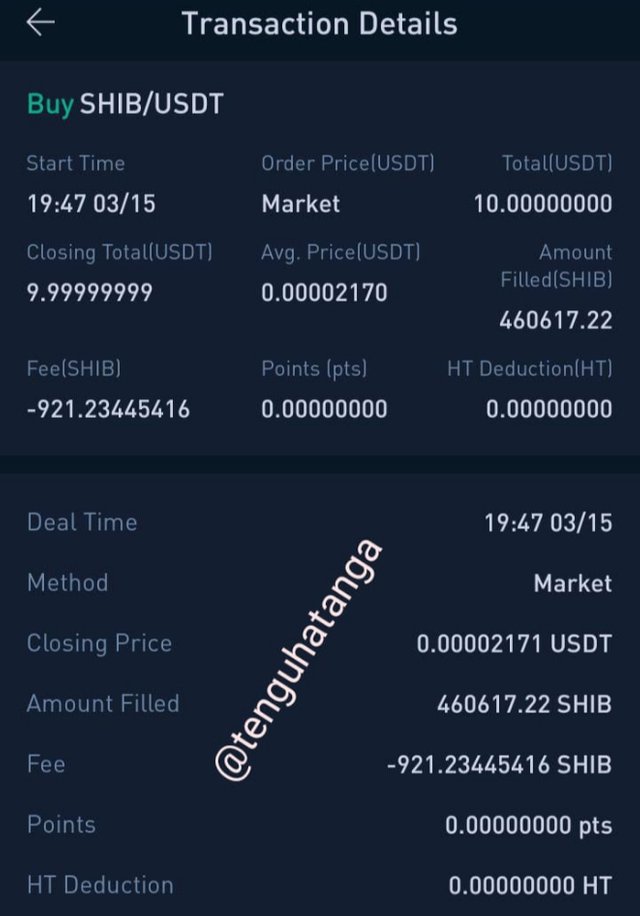
I made a live/real buy entry using Houbi Global exchange platform. The details of my entry is below.
| Platform | Huobi |
|---|---|
| Time Frame | 15 Minutes |
| Coin | Shiba Inu |
| Trading Pair | SHIB/USDT |
| Trading Volume | 10 USDT |
| Price | 0.00002170 |
| Take Profit | 0.00002250 |
| Stop loss | 0.00002100 |
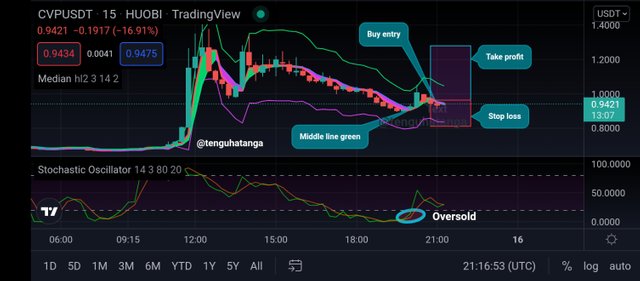
Second Live Trade of CVP
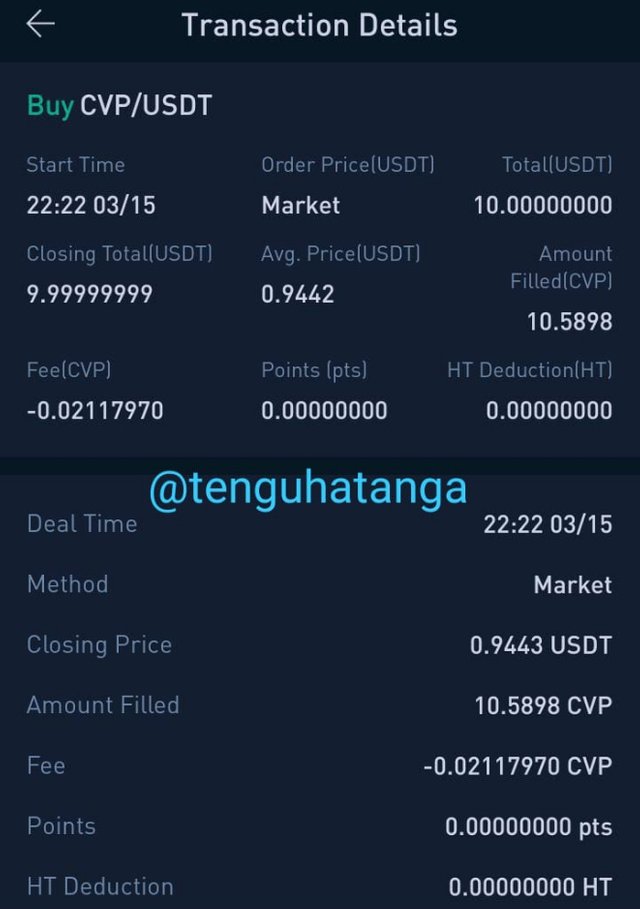
| Platform | Huobi |
|---|---|
| Time Frame | 15 Minutes |
| Coin | CVP |
| Trading Pair | CVP/USDT |
| Trading Volume | 10USDT |
| Price | 0.9443 |
| Take Profit | 0.9850 |
| Stop loss | 0.9100 |
Conclusion
The Median indicator is a very good indicator for analysis of Crypto assets for trading.
I am glad to have completed this task. It was indeed tasking but at the end, I am done and I am glad to see the end of it.
P