Steemit Crypto Academy Week 12: Homework Post for Crypto professor @kouba01 | Cryptocurrency Trading with RSI
Hello, Steemians. I am happy to come back to learn at the Steemit crypto academy and I have learnt from crypto professor @kouba01 in a topic "Cryptocurrency Trading with RSI" and I will be working on the task that is associated with the lecture.
1. What is Relative Strength Index (RSI)
Relative strength index which comes with the popular short form "RSI" simply means a technical indicator used in cryptospace for analysis by crypto technical analysts to get an average value of an asset over time. Relative strength index technical indicator follows the trend of an asset's price to look for overbought and oversold of the asset and give a signal of either of the two (overbought and oversold) as the case may be.
The overbought and oversold signals given by the Relative strength index "RSI" is a point of excess buy or sell of the asset. Overbought signal given by the RSI indicator means a point/level when demand exceeds supply and oversold given by RSI indicator means a point/level when supply exceeds the supply of a crypto assets in the market.
Calculation of Relative Strength Index "RSI"
As shown by the professor in the lecture, I will be quoting the calculation of Relative Strength Index "RSI";
RSI = 100 - 100 / (1 + RS), with RS in the equation being; Average earnings over a high period over a given period / Average loss over a high period during this period
2. Can we Trust Relative strength index "RSI"
Relative strength index indicator can be trusted amongst the technical indicators used for technical analysis of an asset's price. Knowing well that RSI indicator gives the signal of overbought or oversold in the price trend of an asset which is often true and this means, it can be trusted. An important point to note is that, technical indicators are prone to give false signal so as well RSI indicator also gives false signals and with a tendency of false signal, analysts should be careful in the process while using RSI indicator to be certain of what decision to make.
3. Configuration of Relative strength index "RSI"
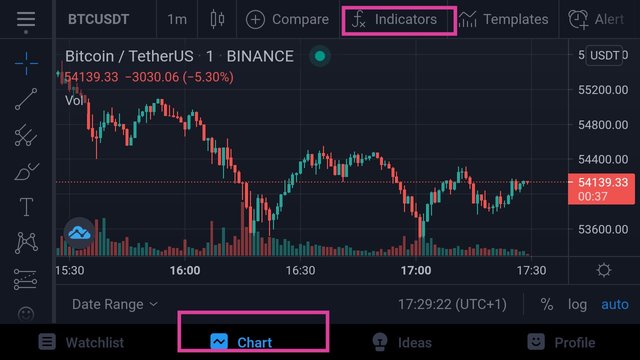
The process of configuration of RSI indicator starts with the launching of the TradingView application on my phone. Then, select chart and navigate to indicators.
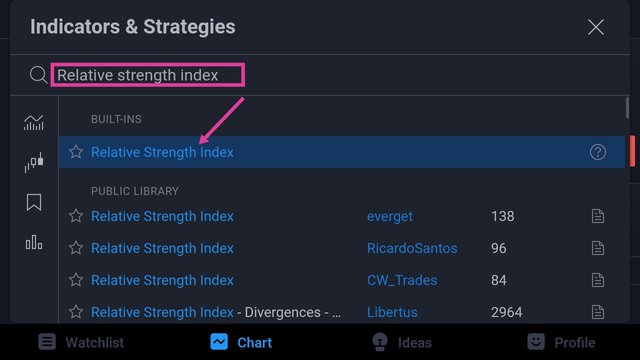
Search for Relative strength index, and click to activate it on the chart. Now, to settings to see different parameters and make changes, if any.
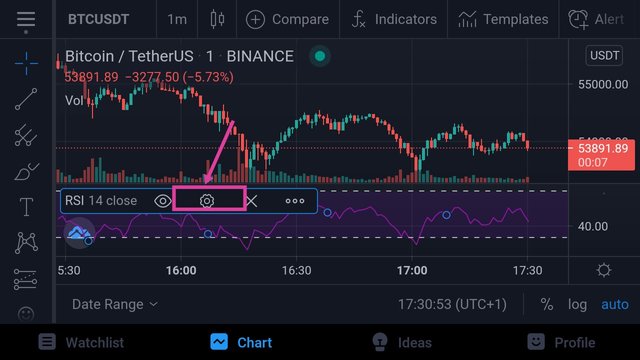
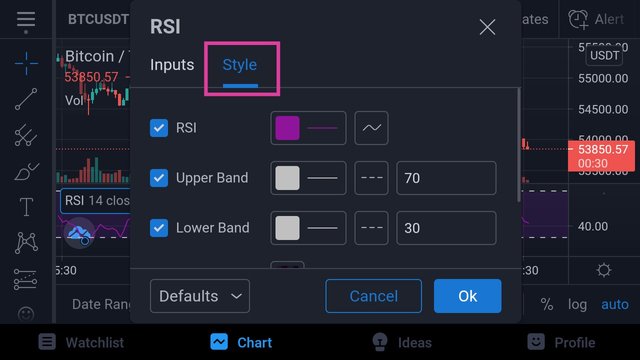
On the settings, we have inputs and styles which users can decide to change the parameters to desirable value. The screenshots that will be shown below shows inputs and styles on RSI indicator settings.
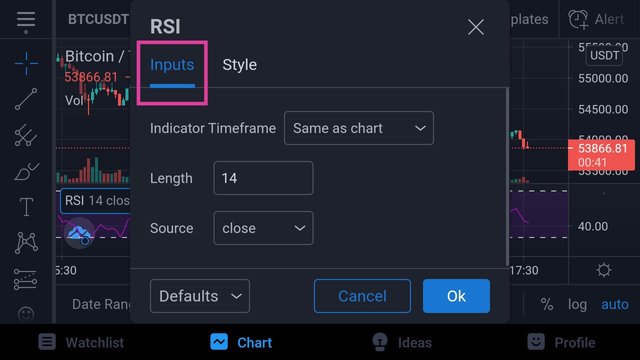
Length Parameter
Length parameter on the RSI indicator means the number of bars that will be put into consideration by the RSI indicator to make analysis of the price movement of an asset to give an average value of overbought or oversold over a particular period of time as customized by the analyst
The length is at 14 by default so that the RSI indicator will analyse the price movement of a particular asset over the last 14 days on a 1 day time-frame chart, the last 14 minutes on a 1 minute time-frame chart, the last 14 weeks on a 1 week time-frame chart and so on.
The length parameter can be changed to any unit of choice which could be retained at 14 or 10, 9, 7 and so on.
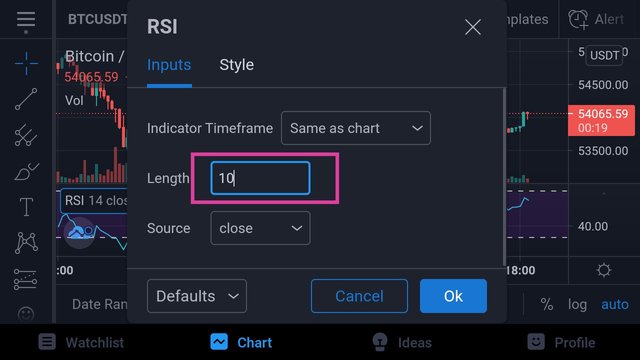
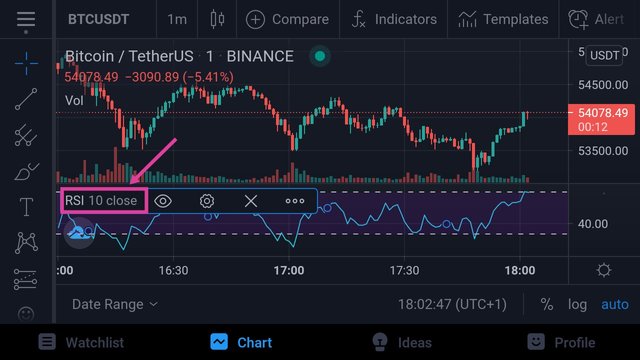
The above screenshots showed how I changed the length parameter to 10 on a 1 minute time-frame chart so that the price movement of the asset over the last 10 minutes will be considered by the RSI indicator to give an average value at any point in time.
4. How to Interpret Overbought and Oversold signal.
To do this, we need to understand the basis to how the RSI gives the overbought or oversold signal and this will lead to what is known as Band under RSI settings inputs having the Upper band to be 70 and lower band to be 30 at default. Why is Upper band at 70?This means anytime the RSI indicator crosses 70 to move upward, that is an indication of overbought. Why is Lower band at 30? This means anytime the RSI indicator goes down, below 30 then, that is an indication of oversold.
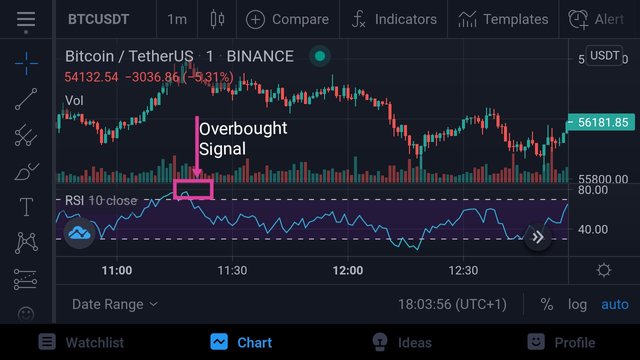
The screenshot shown above shows an overbought signal when the RSI indicator crosses above 70 which is upper band.
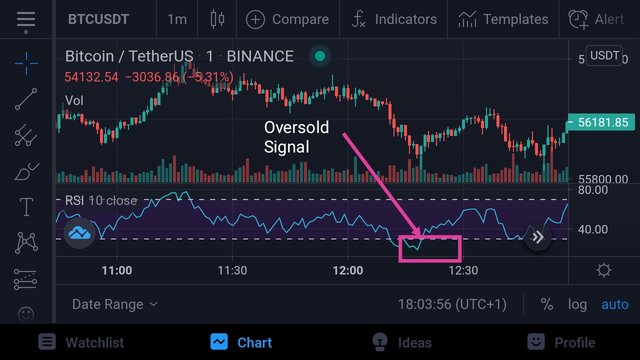
And the screenshot shown above shows an oversold signal when the RSI indicator dropped, below 30 which is the lower band.
5. How to filter RSI indicator to distinguish and recognize true signals from false signals
To achieve this filtration of RSI true signal from false ones, a special indicator is needed to use in combination with the RSI indicator and the indicator is MACD which stands for "Moving Average Convergence Divergence". How does this work? When the MACD indicator is positive and rising, at this point the RSI indicator would give an overbought signal but the analyst must not sell at that point (since overbought is an indication to sell) as the price of the asset tends to stay longer at 70, with this an early overbought signal was given by the RSI indicator which is false.
Secondly, when the MACD indicator is negative and dropping, at this point the RSI would give a signal of oversold which stands for a buy entry, also at the point the trader should not hasten to buy as the price of the asset tends to stay for a longer time at 30 lower band and eventually, face more downtrend movement which means the oversold signal given by the RSI indicator is also false. Let's see an example below.
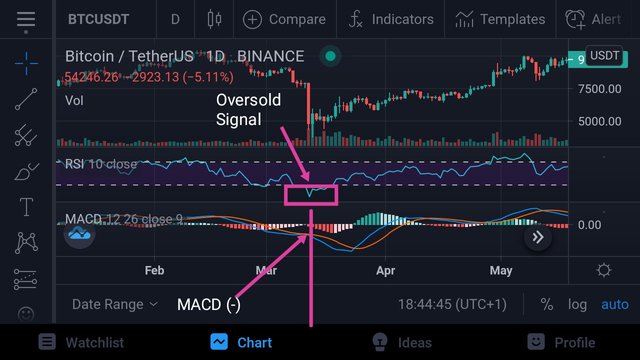
RSI false Oversold signal
The above screenshot shows RSI indicator with an oversold signal and at the same time MACD indicator is negative and dropping which implies the price of this asset stays longer at the 30 (lower band) and a trader should not hasten to buy at this point as there is tendency that the price will drop more before opening a perfect position to buy. And if you notice on the screenshot, the trend faced a slight resistance at that point before tripping on to open a perfect buy position.
6. Review of BTC/USDT pair to mark different positions
I will retain the BTC/USDT pair for the review, marking the sell position, buy position, overbought and oversold signals.
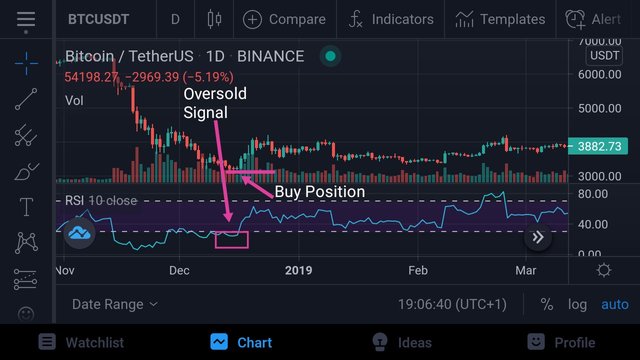
The above showed that RSI indicator gave an oversold signal after the indicator drops below the 30 lower band and I marked out the perfect buy position
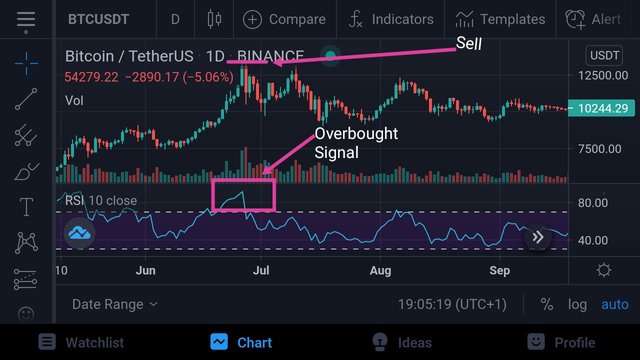
Another one is the above whereby the RSI indicator gave overbought signal after the indicator crosses 70 upper band to open a perfect a sell position.
Conclusion
I am excited for the opportunity to explore RSI indicator to mark out various positions, and the precautions needed to be taken to maximize the indicator for an effective analysis. I appreciate professor @kouba01 for this lecture.
Regards;
Cc:@kouba01
Hi @temitopef
Thanks for your participation in the Steemit Crypto Academy
Feedback
This is good work. Well done with your research study on the RSI trading indicator.
Homework task
7
Thank you sir.