Crypto Trading by Identifying Support and Resistance - Crypto Academy / S6W3 - Homework post for professor @shemul

Cover Image Created using PosterMaker App
Hello, Steemians. As this week progresses, I am very happy to read another lecture that was taught by professor @shemul that talked about how to trade cryptocurrency by identifying support and resistance levels or zones. It's an understandable and enjoyable lecture by the professor and I am eager to write the homework task given by the professor at the end of his lecture.
Question 1- Support and Resistance Zones
Support Zone
Support is a market condition on a cryptocurrency chart when the price of a cryptocurrency paused from continuing in the bearish trend and go in the opposite direction, it occurs at the bottom of the chart where price behaviors have been represented graphically as chart patterns. Support levels when it occurs move the price of a cryptocurrency away from a prevailing trend to move in range or totally in the opposite trend direction.
Support level can be drawn by the horizontal trend line, diagonally drawn, and in some instances, the zones can be drawn out to cover the bearish candlestick price close/bullish candlestick price open below, their extending wicks and price support actions in that entire levels making it a more elaborate support zone. Furthermore, support zones show an analyst how the demand for a cryptocurrency is getting concentrated and that the action of buyers is holding the price from continuing in the bearish trend.

Analysis image from TradingView
In my practical analysis of TRX (Tron) on 30mins time frame above, I marked the support zone as the TRX market changed direction to the bullish trend.
Resistance Zone
By technical analysis definition, resistance is a level at the top of a cryptocurrency chart where the price of the asset was rejected to stop the prevailing bullish trend. The action of resistance on the chart can be traced to increased supply of the cryptocurrency asset and when there is excess supply, the value of the asset will decrease, and that leads to the resistance at that level making it a resistance level, this zone also show the aggressive selling actions of the traders.
Furthermore, the resistance level can be drawn with trend lines on a horizontal plane, diagonally, and in some cases as an area of resistance covered with suitable tools which makes it a clear resistance zone, this zone covers the bullish candlesticks close/bearish candlesticks open, the extending wicks and all these shows how the price has been rejected at that resistance zone. The resistance zone can send the market of the cryptocurrency to a range movement or a total trend reversal to bearish trend.

Analysis image from TradingView
In my practical analysis of BNB (Binance Coin) on a 5mins time frame, I marked the resistance zone where price rejection occurred and the market changed direction to a bearish trend.
Question 2- Types of Support and Resistance
Support and resistance levels have different types. There are three different types which are horizontal support and resistance, sloping levels of support and resistance, and dynamic support and resistance that I will be discussing in this section of the task.
Horizontal support and resistance
Horizontal support and resistance are the types that occurred at the horizontal plane on a cryptocurrency chart. At the bottom of a chart, horizontal support is seen where the price of an asset bounces back from a bearish trend to go back to the opposite trend, this type occurs on a horizontal plane. Horizontal resistance is the type of resistance that occurs at the top of a cryptocurrency chart where the price of a cryptocurrency is rejected and changes the direction of the trend, it occurs on a horizontal plane.
_1.png)
Analysis image from TradingView
In my practical analysis above, I have marked the horizontal support with a perfect rectangle drawn. This is horizontal support and the price of the cryptocurrency bounces back at the support and its market goes in the direction of the bullish trend.
_1.png)
Analysis image from TradingView
In my practical analysis above, I marked horizontal resistance at the top of the cryptocurrency chart with a straight and perfect rectangle on a plane surface, to draw the horizontal resistance. The price of the cryptocurrency was rejected at the resistance zone and the market goes in the bearish trend.
Sloping levels of support and resistance
Support and resistance zones are not always seen on a horizontal plane, in many instances, support and resistance levels can be marked on a sloping or slanting area. Sloping levels of support is a type of support that occurs in a sloping movement of the chart of a cryptocurrency, it occurs at the bottom of the chart when the price of the asset is supported to go up again. The trend line is used to draw the sloping levels of the support on the chart.
_1.png)
Analysis image from TradingView
In my practical analysis above, the price of the cryptocurrency was in a bullish trend with some pullbacks which was supported on a sloping level which sends the price to continue the bullish trend. This is how sloping levels of support are marked on the chart with trend line.
Sloping levels of resistance occurs at the top of a cryptocurrency chart when the market is in a bearish trend, has some pullbacks and the price gets rejected again. The resistance on the sloping price movement is marked with a slanting trendline to highlight the sloping levels on resistance which is different from the regular resistance on a plane level.
_1.png)
Analysis image from TradingView
In my practical analysis above, when the cryptocurrency market was in a bearish trend, the price gets supported on the way which turned to some pullbacks, at the top, some resistance was developed at a sloping level. The sloping levels of the resistance were marked with a trendline.
Dynamic support and resistance
Dynamic support can be taken when an analyst combines Moving Averages to help her analysis, MA being a trend-based type of indicator moves in the direction the price of a cryptocurrency is moving. At some points on the cryptocurrency chart at the bottom, the price of the asset bounces back at the MA oscillating line which turns that level to support, this action of the MA and the level is known as dynamic support.
_1.png)
Analysis image from TradingView
In my practical analysis above, I have installed a Moving Average indicator with a length of 50 periods. In a bullish trend, the price of the cryptocurrency bounces back at the MA at 50 periods to continue the bullish trend. This is the level known as dynamic support.
Dynamic resistance is the type of resistance that occurred at the top of a cryptocurrency chart when the analyst combines a Moving Average indicator any period. In a bearish trend, the price of the cryptocurrency would be rejected at the MA oscillating line when price get supported on its way down to continue the bearish trend and it's regularly at a slanting or diagonal level, this is known as dynamic resistance.
_1.png)
Analysis image from TradingView
In my practical analysis above, I have installed a Moving Average at 50 periods. The price of the cryptocurrency was in a bearish trend, some pullbacks occurred and the price was rejected at the MA oscillating line. This is the dynamic resistance level on the chart.
Question 3- Identify False and Successful Breakouts
Breakouts of support and resistance levels occur in some market conditions which means the support and resistance levels are not always serving as a level of bearish or bullish rejection, the price of a cryptocurrency can break above the support and resistance level to continue the prevailing trend or continuation of the trend in a case of reversal.
False Breakout
False breakouts occur in a market condition when the price of a cryptocurrency breaks below a support or above resistance zone but returned above or below it again and the market of the cryptocurrency continues in the opposite trend, this is known as false breakouts. False resistance breakouts occur at the top of the chart in a bullish trend, the price returns below the resistance zone and starts going in a bearish trend.
Furthermore, false support breakouts occur at the bottom of the chart in a bearish movement when the price of a cryptocurrency breaks below the support zone for a continued bearishness and the price returns above the support zone again to go in a bullish direction.

Analysis image from TradingView
The image above is my practical analysis when there was a false support breakout, the price of the cryptocurrency returned above the support level again and the market goes bullish. If an analyst had entered a short position with the support breakout, she could have lost some money.

Analysis image from TradingView
The image above shows a false resistance breakout and just after the breakout, the price of the cryptocurrency returned below the resistance level and the market goes bearish. This is the feature of a false resistance breakout.
Successful breakout
Breakouts are only successful if it goes in the direction of the break, and this is what can be termed a true breakout. There are two types of breakouts in cryptocurrency analysis, the first one is continuation breakout and the second one is reversal breakout. I will be talking about the aforementioned successful breakouts below.
Continuation breakout
Continuation breakout is the type of breakout that occurs when support and resistance were broken and the prevailing trend continued, in that kind of situation, it is a successful breakout. In a bullish trend, if the resistance zone was broken and the price of the cryptocurrency continued in the bullish trend, that is a successful resistance breakout that belongs to the continuation breakouts type.
Furthermore, in a bearish trend if the price of a cryptocurrency breaks the support zone and the movement continued the bearishness without breaking over the support zone again, this is a successful support break and it belongs to the continuation breakouts type. I will show some examples on continuation breakouts.

Analysis image from TradingView
In the image of my analysis above, the price of the cryptocurrency in a bearish trend broke the support zone and the market continued in the bearish trend, this is a successful support breakout and a continuation breakout.
Analysis image from TradingView
In my practical analysis in the image above, the market of the cryptocurrency was in a bullish trend and the price broke above the resistance zone. After the break, the price of the cryptocurrency continued in the bullish trend, this is a successful breakout and a continuation breakout.
Reversal breakout
A reversal breakout is a type of successful breakouts, in a prevailing trend if the price of the cryptocurrency switched to a range movement, a break out of the range market can occur if the pressure of buying or selling of traders is very high which sends the market in the opposite trend, this is known as reversal breakouts.
We can say there are two types of reversal breakouts, one is bullish reversal breakout, this occur in a bearish trend if the market switches to sideways and the pressure of buy is high that is high market demand, the price can break out of the range and go bullish, this is known bullish reversal breakout. Furthermore, the second one is bearish reversal breakout which occurs in a bullish trend when the market switches to sideways and the pressure of sell is high, the price can break out of the range and go bearish, this is known as bearish reversal breakout.

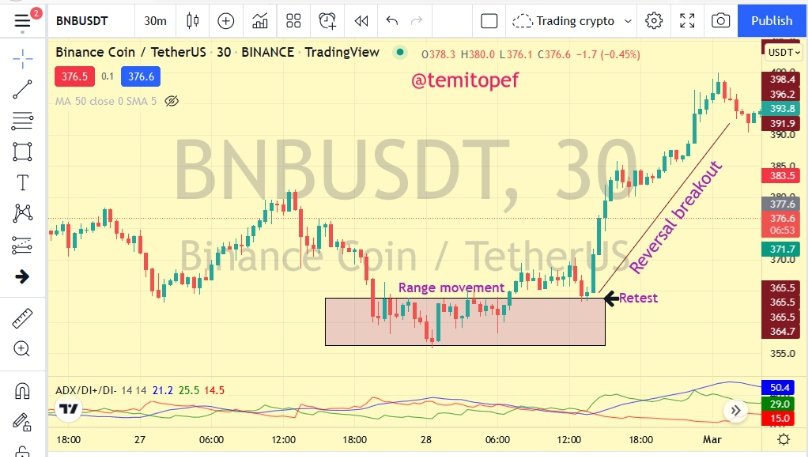
Analysis image from TradingView
In my analysis image above, in a bullish trend the market switched to range movement, the price of the cryptocurrency break out of the range position, retested the level, and goes bearish because of the high pressure of sell, this is a reversal breakout.
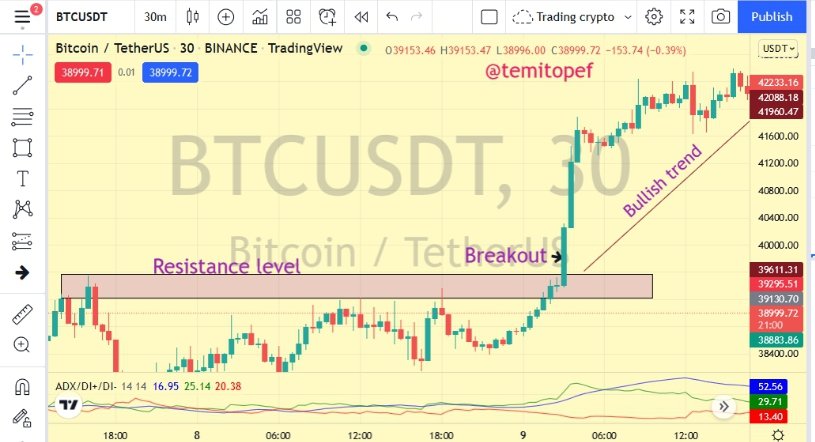
Analysis image from TradingView
In my analysis image above, the market of the cryptocurrency was in a bearish trend and it switched to range movement. After the range market, the price break above, retested the level and goes bullish, this is known as reversal breakout.
Question 4- Using the Volume and RSI Indicator Combined with Breakouts & Identify the Entry Point
When an analyst chooses to trade a breakout, identifying the breakout may not be enough to make successful trades. For this reason, the volume indicator and RSI (Relative Strength Index) indicator can be used on the cryptocurrency chart to identify true breakouts and to mark short or long positions in a market.
Long Position
To enter a long position, at the break of resistance zone, the analyst should ensure that the volume of buy is high through the volume indicator and RSI indicator should be above the 50 levels and heading towards the overbought area. If these two things are fulfilled, a long position should be taken in the market.

Analysis image from TradingView
In my practical analysis image above, at the break of the resistance zone there was high buying pressure and the volume indicator showed it, and the RSI indication was above the 50 levels and is going to the overbought area. When all these things are fulfilled, I made a long position after the breakout and I used a 1:1.5 risk to reward ratio.
Short Position
To enter a short position, that is a sell position using support breakout, there should be a break below the support zone. At that level, the volume indicator should show that there was a high volume of sell and the RSI indicator should be below the 50 levels as it is moving towards the oversold area. Since these things worked together, the analyst can make a short entry after the breakout.

Analysis image from TradingView
In my practical analysis image above, in a bearish trend there was a breakout at the support zone, the volume indicator showed a high volume of sell, and the RSI indicator was below 50 levels, and heading towards the oversold area. I entered a short position above the breakout.
Question 5- Taking a Real Trade on my Binance Account After a Successful Breakout
I will be performing a short position trade on my Binance entered through the BCH (Bitcoin Cash) market. You will see my analysis on the chart below.

Analysis image from TradingView
In my analysis image above on the BCH (Bitcoin Cash) market. In a bearish trend, the support zone was broken and the level was retested as the market goes bearish. This may not be enough for me to enter a short position, I checked the volume indicator and it showed that there was a high volume of sell at the breakout and the RSI is below the 50 levels, and moving towards the oversold area. I was so confident of the move, I entered a short position at 287.80 USDT, my exit trade in profit at 285.00 USDT and my stop loss at 290.60 USDT, the risk to reward ratio that I used is 1:1.5. I used Binance BCHUSDT perpetual 10x leverage to enter the market.

My verified account on Binance

My trade on Binance
After about 1hr 45mins, my trade hits my exit trade in profit and I made $0.10584 profit.

Profit level hits on TradingView

Trade closed on Binance
Question 6- Limitation of Support and Resistance (False breakouts)
False breakouts are a risky trading mistake on the side of the analyst because the market didn't go the way she was expecting it to be and with this, it's a risky one. I will take some of the limitations below.
Displacement of Position: False breakouts will put an analyst in a risky investment position because the analyst has traded a break above the resistance
zone or break below the support zone. The direction of the trend will be forced to go in the opposite direction which can be traced to high pressure of sell or buy. The position of the analyst will be displaced and he or she may need to close the position.
Loss in Trade: The movement of the market against the prediction of the analyst can lead to excessive loss of capital if the analyst is not with his or her device to see the wrong market move and that can cost a lot of loss if care is not taken.
Need for Extra position: For an analyst that has discipline of the number trades he or she would make per day and the expected profit trades. If the analyst trade a false breakout and lose, he or she may need to prepare another position as the previous one has affected her daily trade and profit target.

Analysis image from TradingView
In my practical analysis image above, the price of the cryptocurrency broke the resistance level but it was a false breakout, the price returned below the breakout, and the market goes bearish. In that kind of situation, the analyst's position was displaced, he or she will lose some money and may need set up a new position.
I have talked about the limitations of false breakouts, analysts should be careful and make sure they have identified a true breakout that possibly retested the support or resistance level and continued the breakout, before entering a market in the crypto space.
Conclusion
The support and resistance zones in cryptocurrency analysis is an important component of analysis that analysts should pay closer attention to as they represent positions where the price of a cryptocurrency has bounced up again in a bearish trend and where the price of the asset was rejected in a bullish trend. These zones allow analysts to prepare analysis towards the behavior of the market to plan their entry and exits in the market.
The support and resistance zones can have price breakout in some instances and analysts can use those levels to make new entries in a market. These levels can sometimes turn to false breakouts, to avoid getting into investment problems, analysts can combine indicators like Volume and RSI indicators to identify true breakouts. I so much appreciate the teaching of professor @shemul to deliver this wonderful lecture for us, thanks, professor.
Sort: Trending
Loading...