Technical Indicators - Crypto Academy / S4W2 - Homework Post for Prof. @reminiscence01
Hello everyone,
How is your weekend going? I hope we are enjoying it. It's another week with a new wonderful topic tutored by Prof. @reminiscence01. "Technical Indicators." I have read and understood the topic and am so happy to be one of the participants. As we all know that technical indicators are one of the technical analysis tools that are important in trading markets such as currencies, stocks, etc. In my today's homework, I will be discussing with us some important things we should know about the technical indicator. Below, I will be attending to some question that was acquired from the lecture which I received by my amiable lecturer Prof. @reminiscence01. So please, follow me as I take you on the journey.
Questions
(1)
- In your own words, explain Technical indicators and why it is a good technical analysis tool.
- Are technical indicators good for cryptocurrency analysis? Explain your answer.
- Illustrate how to add indicators on the chart and also how to configure them. (Screenshot needed).
(2)
- Explain the different categories of Technical indicators and give an example of each category. Also, show the indicators used as an example on your chart. (Screenshot needed).
- Briefly explain the reason why indicators are not advisable to be used as a standalone tool for technical analysis
- Explain how an investor can increase the success rate of a technical indicator signal.
In your own words, explain Technical indicators and why it is a good technical analysis tool.
A technical indicator is said to be a technical analysis tool. Technical analysis is a trading discipline that was developed to figure out some investment or to identify some trading opportunities through the statistical trends that were gathered from trading analysis or activity such as volume, price movement, and so on. Also, technical indicators are a technical analysis tool that can be of help to traders in making decisions.
Technical indicators can also be said as part of the solution provided in the trading world to help traders to understand the market price movement. It is a technical analysis technique that calculates mathematically based on market volume, price, and so on. It is used by technical analysts to predict future price movement and it is expected to react to previous areas in the future because history always repeats itself.
Technical indicators are technical analysis tool that is mostly used by active traders. it can be used to analyze short-term price movements and also long-term. However, If we should now define technical analysis in a simple term, it can be defined as a technical analysis tool that mathematically calculates statistical trends which were gathered from trading analysis and also focused on the historical trading data such as price movement, volume, open interest and so on.
Why it is a good technical analysis tool?
Technical indicators are very important technical analysis tools in trading. It can help traders in different ways especially when it is used properly. That is why it is always advisable to have enough knowledge of trading before engaging in it. A technical indicator is a tool that can give or make trader understand the present condition of the market i.e. if the market is trending up or down, it shows, gives traders or make traders to understanding more about the market condition and also help traders in making good trading decisions. It can also be used to get or determine the momentum of an asset.
Technical indications are indicators with great benefit. it displays graphically and this alone gives traders more understanding about their trades. Such as the entry and exit market time. Technical indicator increases the winning ratio during trades. It provides support and resistance. And that alone gives more hope and also helps to reduce stop loss size.
However, a technical indicator is a unique indicator that can serve as a signal confirmation. This signal confirmation can be done by combining different indicators of the same category to confirm a trading signal because some indicators can give a false result sometimes, so to be on a safer side, it will be better to combine indicators of the same category.
Are technical indicators good for cryptocurrency analysis? Explain your answer.
Before I dive into if technical indicators are good to use for cryptocurrency analysis, I would like to shortly define what cryptocurrency is. Cryptocurrency can be defined as a digital currency (such as Bitcoin, Ether, and so on.) that came into existence as an alternative to our traditional currency (such as Naira, Dollar, Euro, and so on.). As I had explained earlier, we saw that technical indicator is one of the technical analysis tools that are good when it comes to understanding market conditions by looking at the trends and patterns. We also know that technical indicators can help traders to predict price movement by looking at historical data such as price and volumes.
In the cryptocurrency world, we have some traders that use only technical analysis to enter or exist trade, without the use of fundamental analysis. What is Fundamental analysis? Fundamental analysis can be defined as an analysis that measures everything that could affect a security's value and also involves studying the economic situation sometimes just to trade currencies more effectively.
However, a technical indicator is good for cryptocurrency analysis especially when it is used properly because it gives a wrong trade sometimes. Traders can use the knowledge of combining different indicators of the same category to have more positive answers. But, technical analysis and fundamental analysis are made up of the backbone of any investment such as cryptocurrencies, stock, and so on.
Illustrate how to add indicators on the chart and also how to configure them. (Screenshot needed).
I will be using tradingview to explain how we can add indicators to our chart and also how we can configure them.

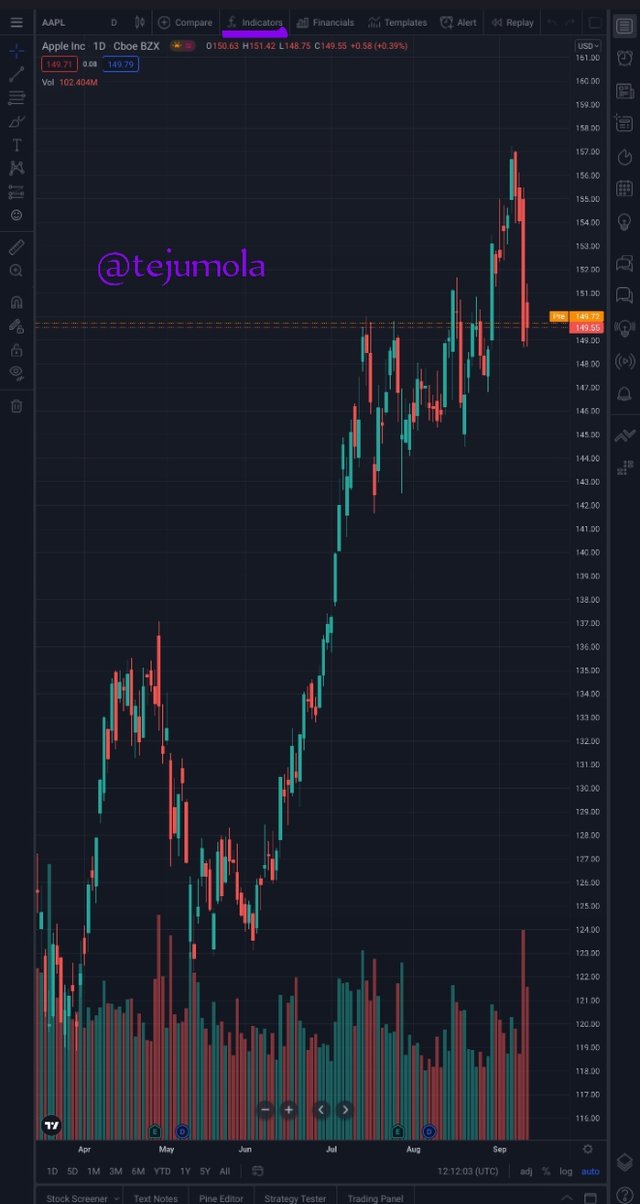
Firstly, we need to visit the tradingview site by clicking here. It will display the tradingview homepage. On the homepage, you will see an icon like three lines, click on it, it will display a chart page as you can see below.
At the upper part of the chart page, you all see some tradingview features, out of them click on the indicator as you can see in the below image.
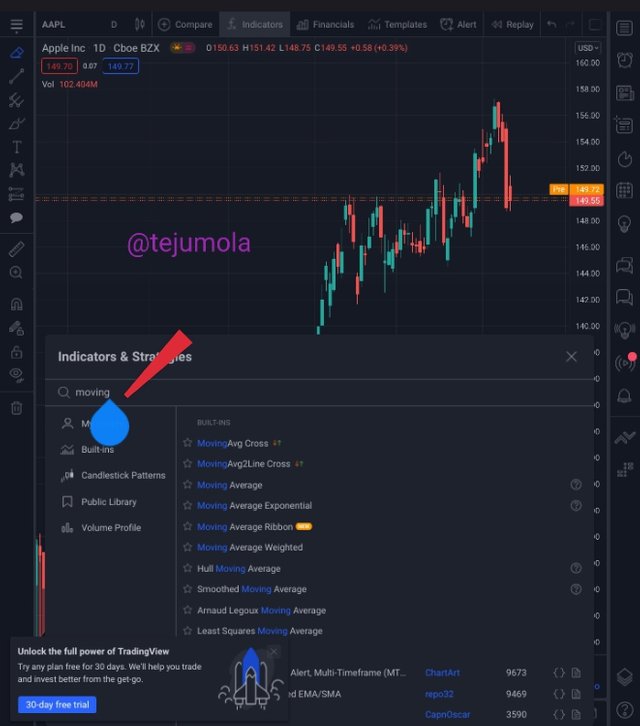
After when you have clicked on the indicator, it will display a page where you can find the indicator of your choice. I will be searching for Moving Average.
So, I typed Moving average in the search engine.
Tradingview.com/
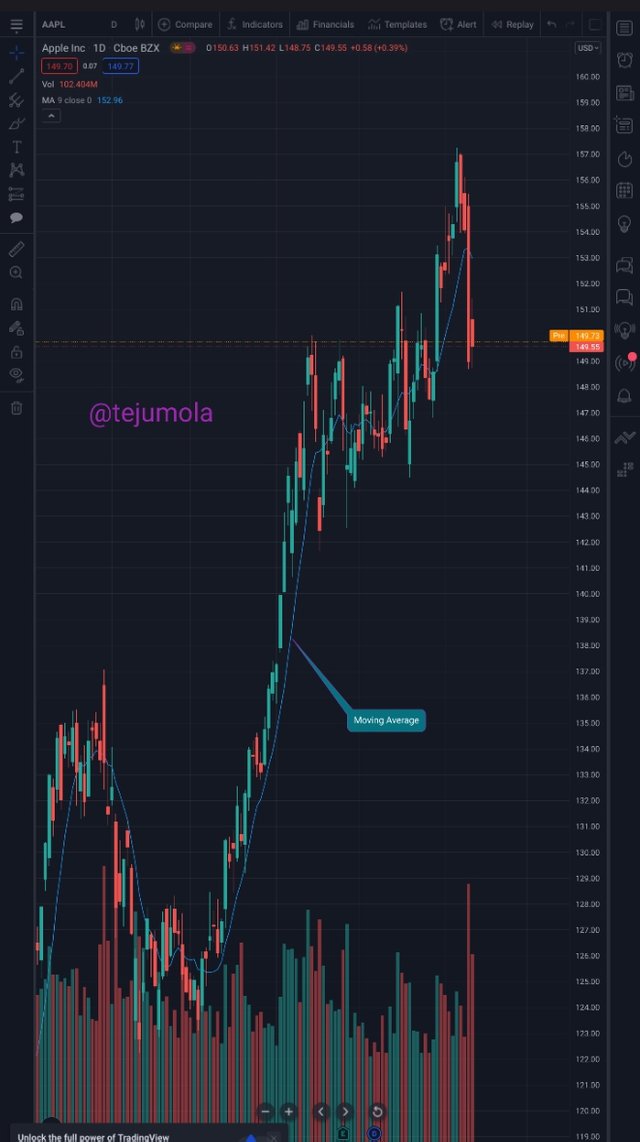
Note: Once you click on your choice of indicator it will display immediately even before you close the list or page and you can also add different indicators on the chart using the same process.
The next now is that I will be showing us how we can edit the indicator on the chart. Such as the Moving Average I added to the chart. Go to the chart, you will see a symbol showing a particular indicator has been added to your chart. Once you click on the symbol as you can see below, it will see different things that you can click to edit or delete the indicator. Such as the settings, eye icon which means if you want to hide the symbol or not, a close icon which you will click on if you want to delete the indicator on your chart, bracket, and so on.
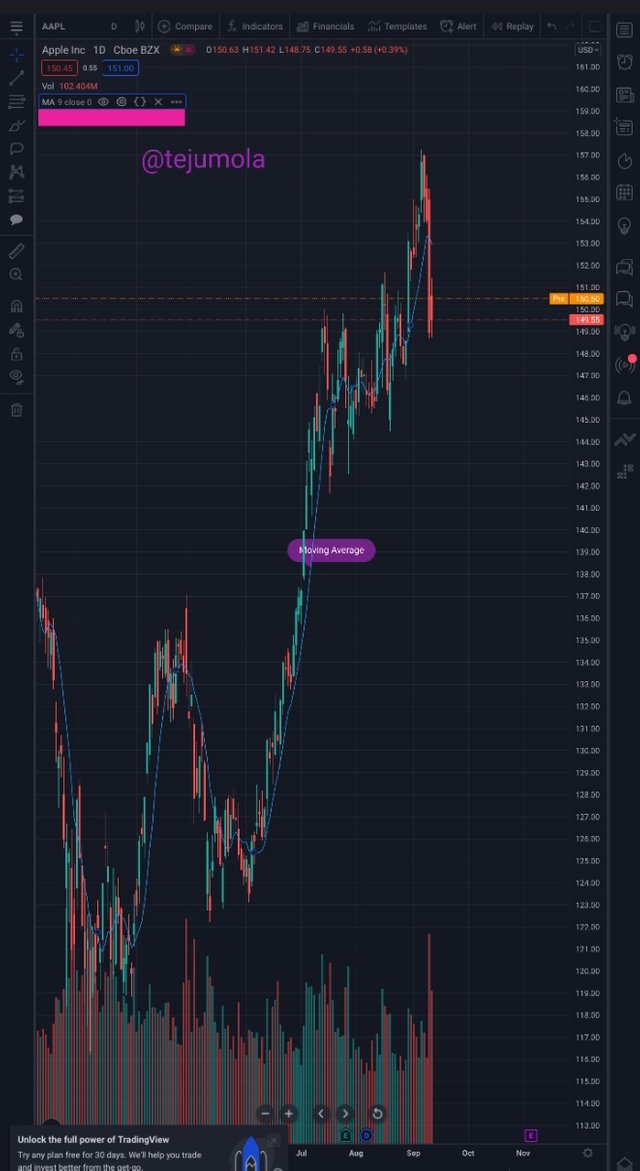
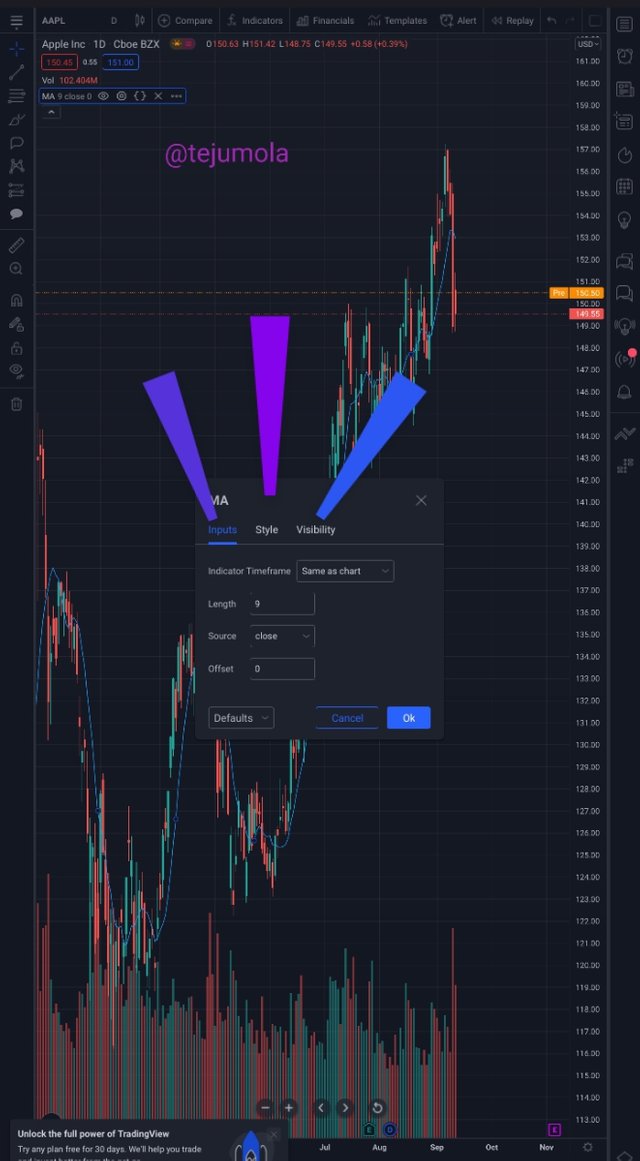
So now, click on the setting icon. It shows will different patterns of how you can edit your indicator. In the setting, the first thing we have is Input as you can see in the below image.
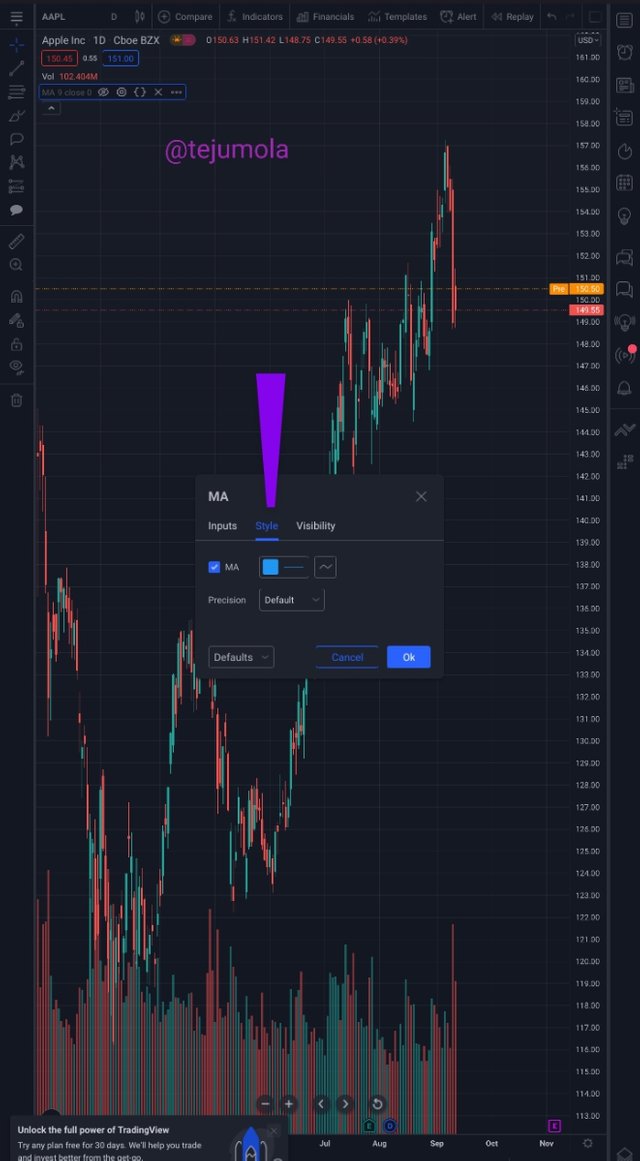
Under input, we can edit different things according to our choice such as the length of the indicator you have chosen, the offset, and so on. Another one in the settings is Style as you see in the below screenshot.
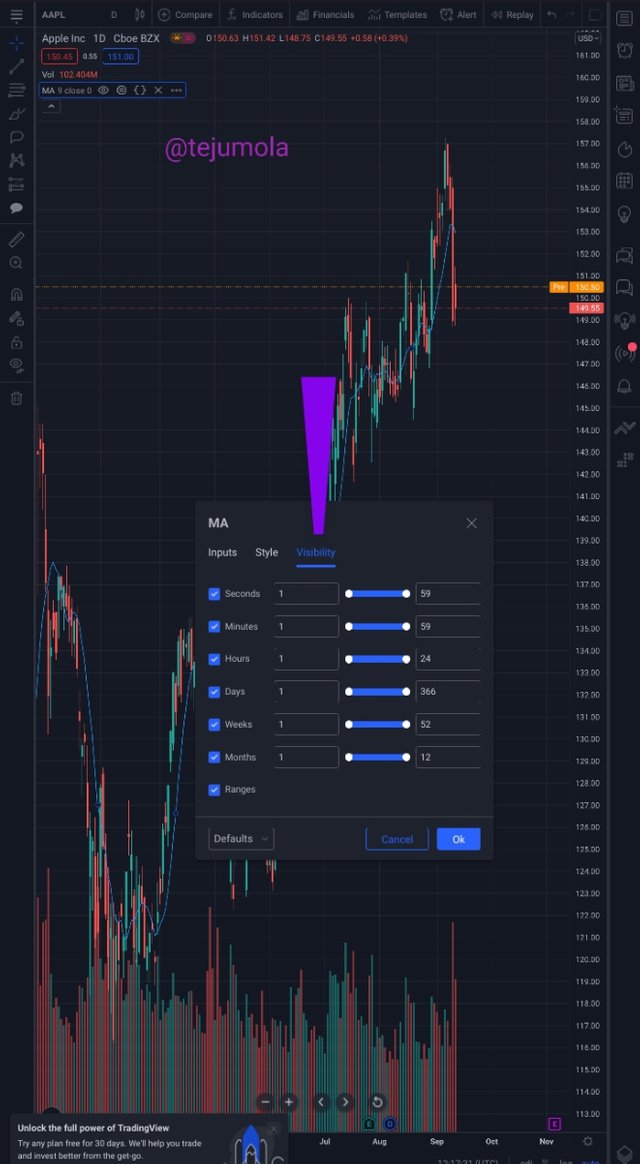
Under style, we can also change the color of our indicator according to our choice. We can change things under style such as the line of your indicator, the color, and so on. The third one is Visibility as you can see below.
As we can see in the screenshot above, we can see that we can change the time range. Such as minutes, hours, days, weeks, months, and so on.
Explain the different categories of Technical indicators and give an example of each category. Also, show the indicators used as an example on your chart. (Screenshot needed)
As we all know we have different types of technical indicators that are available for traders or investors in the world today. As I had said earlier, the proper use of this indicator is very important. I will be talking about some categories traders can use to enter or exit trades depending on their trading style.
- Trend Based Indicator-
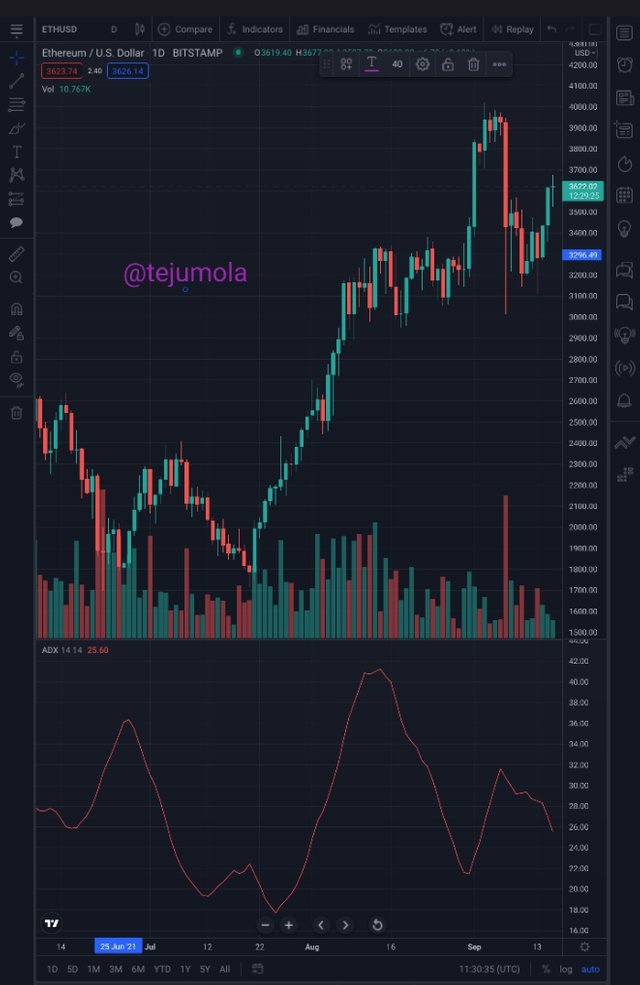
In trading, understanding or knowing trends and making trends our friend is very important. It helps traders to know the trends in the market. I.e if the market is trending upward, downward, or in a range. It also gives more grace to the trader to have a more positive mind about their market price prediction. I will be using one of the indicators that can be used to determine the market trends.
Example of Average Directional Index (ADX)
Tradingview.com/
Average Directional Index(ADX): Ethereum/U.S Dollar
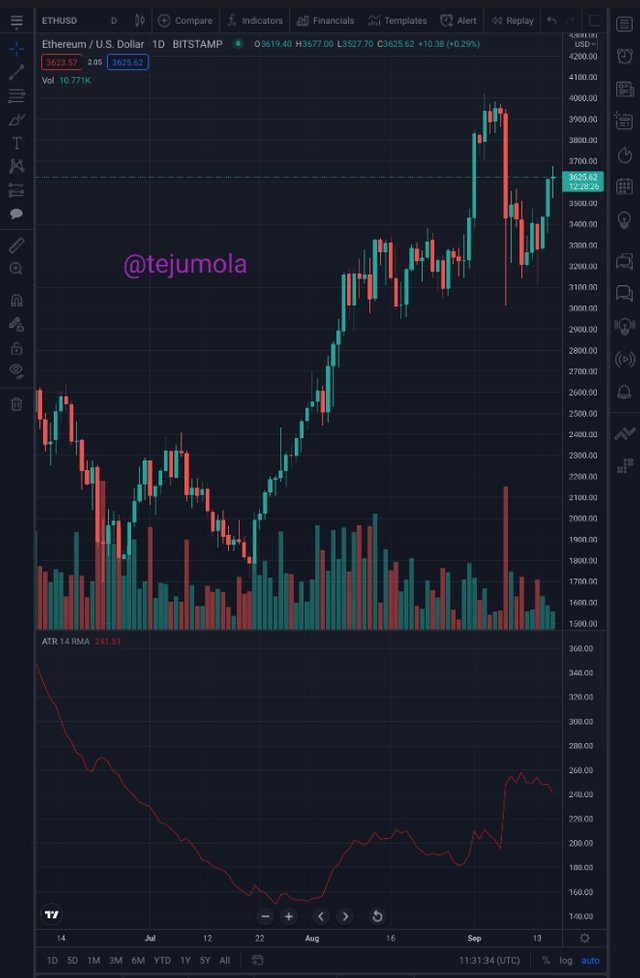
- Volatility Based Indicator -
This is a type of technical analysis tool that can be used to measure the changes in market price which may occur in a specified period. The volatility-based indicator is also a valuable technical analysis tool that can be very useful when traders understand and make good use of it in trades. This indicator can be measured or calculated based on the historical price changes in the market and can also be used for trend identification. The volatility is calculated as the faster the changes in the market price, the higher the volatility. While, the slower changes in price, the lower the volatility is been calculated.
Tradingview.com/
Tradingview.com/
I will be using Average True Ranging (ATR) as an example. ATR indicator can be used to get or ascertain if the volatility is higher or low.
Tradingview.com/
Average True Ranging (ATR): Ethereum/U.S Dollar
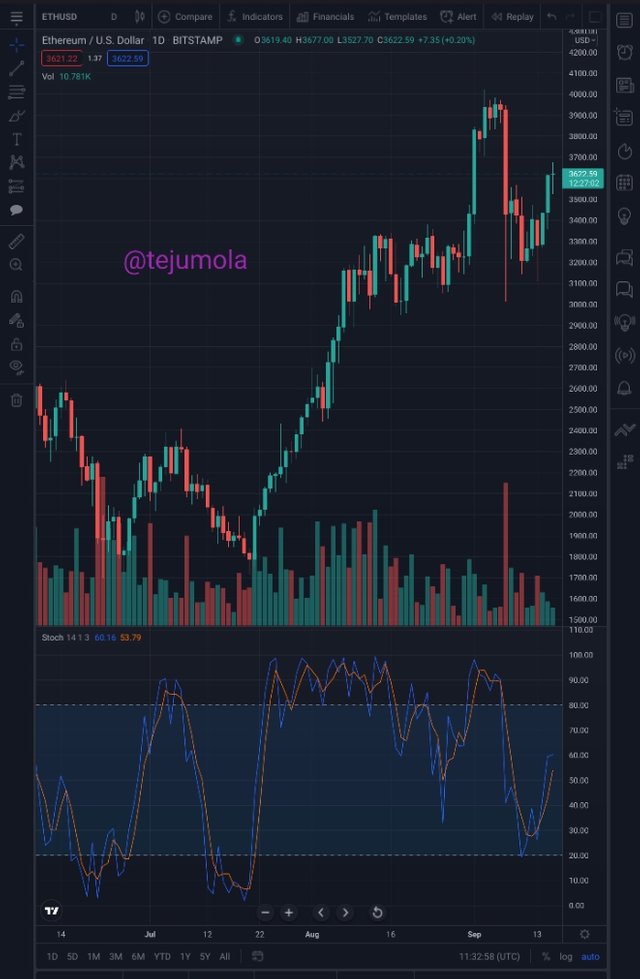
- Momentum Based Indicator -
This is an indicator that can be used to measure the strength and weakness of stock or asset price at a particular period. Momentum based indicator is an indicator that can be used to measure the rate of how the market price is rising and falling. I.e.if the if a particular is overbought or oversold. I will be using stochastic indicators as an example of momentum-based indicators. I.e. one of the indicators we can use to measure the rate of the rising and falling of the market.
Tradingview.com/
Oschastic(ADX): Ethereum/U.S Dollar
Briefly explain the reason why indicators are not advisable to be used as a standalone tool for technical analysis.
Indicators can be not be used as a standalone in trades because they sometimes give wrong signals which may lead to a huge loss of money. Indicators are used to complement each other interpretations. I.e. they give different interpretations but they are used together to give a stronger answer to a particular trade, which is either to enter, exit, or watch the market. So, that is why all traders and investors are advised to make use of two or more indicators that suit their trading style, to get the price action or predict the future price of the market.
Explain how an investor can increase the success rate of a technical indicator signal.
Investors or traders can increase the success rate of technical analysis in many ways such as having enough understanding of the indicators in use. Having a deep understanding of the indicators that are in use is very important, this will make the trader understand and know the other necessary indicator that is to be combined with the one in use, to avoid losses that may occur. The traders should also properly apply indicators, for it not to give a false signal.
In conclusion, technical indicators are chart analyses that can help traders better understanding and act on a stock or asset price movement.
Again today, I want to say a big thank you to my amiable lecture Prof.@reminiscence01 for always tutoring us on a wonderful topic and class. It has added more to my knowledge again this week. Thank you very much.
#reminiscence01-s4week2 #cryptoacademy #indicators #technicalanalysis #steemexclusive #steemit #betterlife
Sort: Trending
Loading...