Crypto Academy / Season 3 / Week 8 - Intermediate: Crypto Assets and the Random Index (KDJ)
Good morning Everyone,
It's another beautiful week, a new season, and am so happy to be here again this week. This week's topic by Prof. @asaj is a nice and new lesson for me because it has added to my knowledge, "Crypto Assets and the Random Index (KDJ)". I will be attending to some questions below, from the lesson, without wasting our time. Follow me as I take you on the journey.
Questions
In your own words define the random index and explain how it is calculated
Is the random index reliable? Explain
How is the random index added to a chart and what are the recommended parameters? (Screenshot required)
Differences between KDJ, ADX, and ATR
Use the signals of the random index to buy and sell any two cryptocurrencies. (Screenshot required)
Answers
IN YOUR OWN WORDS DEFINE THE RANDOM INDEX AND EXPLAIN HOW IT IS CALCULATED
Every trader and investor always looks for a matching indicator for their analysis, this, as bring about the creation of different types of indicator but still analysis or using the indicator, does not give a 100% guarantee that the trade will go according to plan. Indicators are only can help traders or investors to predict the future market price.
In the class tutored by Prof. @asaj, is a newly created indicator that was configured by ll21LAMBOS21, a professional user of Tradingview with a very good reputation score. It is a new technical analysis tool, that helps the trader to see the changes in the market price, to decide when to buy, sell, good market entry, and exit.
KDJ can be defined as a technical analysis tool that gives or helps investors or traders to have a smooth technical analysis. It helps the trader to identify a very easy change in price, market trends, such as when to buy or sell, or good market entry or exit.
KDJ indicator is also referred to as a random index. It is an indicator that is derived and also has similarities with the stochastic oscillator indicator. The KDJ indicator has three lines; K-line, D-line, J-line. The first two lines are similar to the stochastic oscillator indicator (K-line and D-line), the third line which is J-line, is the one that brings about the difference between the two stochastic oscillators and KDJ.
HOW IT IS CALCULATED
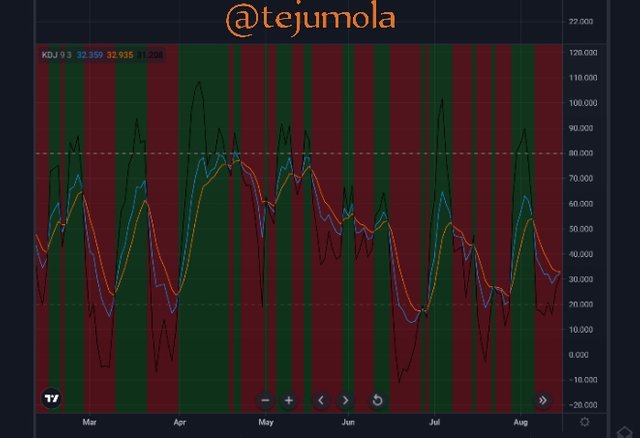
As I had explained earlier that KDJ is an indicator that is derived from stochastic oscillators with the only difference of J. K-line and D-line is calculated like stochastic oscillators indicator. K-line and D-line indicators in a chart indicate if an asset is overbought (70% or 80%) or oversold (20%). When the line is above 70% or 80%, it is overbought. While, if the line is below 20%, it is overbought.
The J-line which is the third line in KDJ is a line that indicates the current condition of the market. J-line defines the market condition or trends. J-line goes above K-line and D-line if it is experiencing an uptrend. While it goes below K-line and D-line if it experiencing a downtrend.
IS THE RANDOM INDEX RELIABLE? EXPLAIN
The random index which is also known as the KDJ indicator is a good indicator with very clear features that can help traders or investors in their technical analysis. Though it is new to me but with the knowledge which I obtained from the class tutored by Prof. @asaj and also with my practice which I will be exploring in the last question. I believe it is a simple and easy indicator for both traders and investors to use when analyzing the price movement or when to buy or sell.
As we all know that, generally trade can only be predicted, we can not be 100% sure that the future price will be accurate as we have planned or predicted. As we also know, it is an indicator that is derived from stochastic oscillators. Stochastic oscillators indicator that is commonly used by traders or investors to know if an asset is overbought or oversold. So, the addition of the third line which is the J-line makes it more reliable because it added more features to it.
KDJ is an indicator that is not reliable in a short time frames chart analysis. It is an indicator that can not be rushed to use. Because, it is sometimes good to stay in the trade and watch the market for some time before purchasing, just to avoid loss. But very reliable in a long-time chart.
HOW IS THE RANDOM INDEX ADDED TO A CHART AND WHAT ARE THE RECOMMENDED PARAMETERS? (SCREENSHOT REQUIRED)
I will be using a trading view to explain how a random index which is also known as KDJ can Bd added to a chart.
Firstly, we need to visit tradingview site. After when you have clicked or search for the site on your browser, it will display to your tradingview homepage as you can see below.
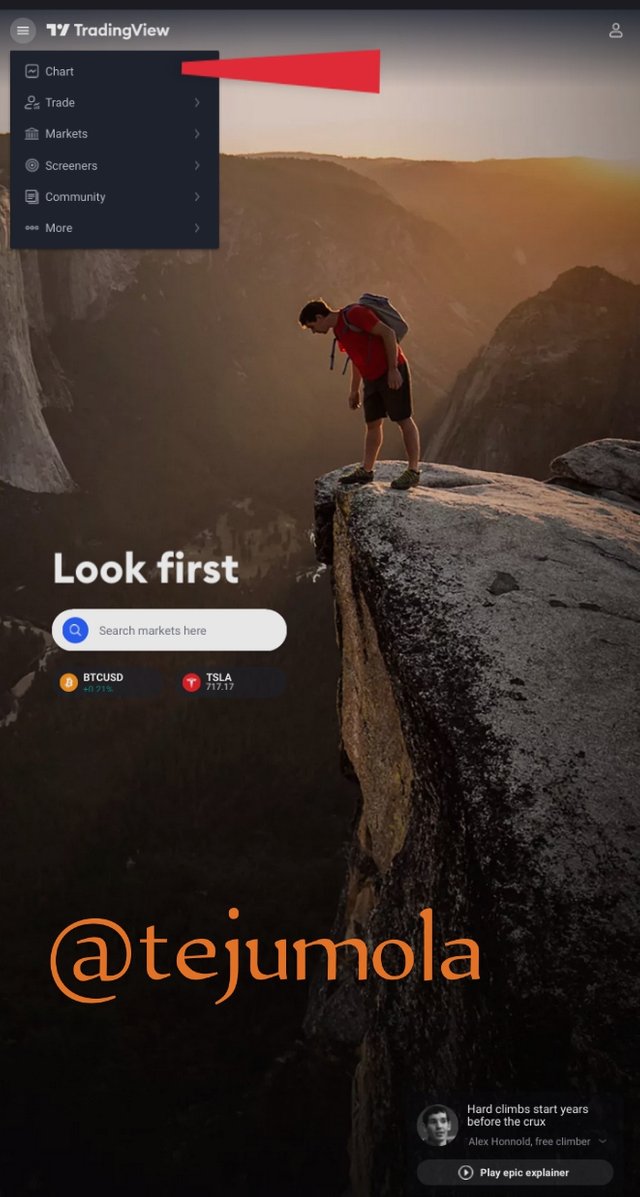
At the upper part of the homepage as you can see above, click on the chart. It will show you a chart page such as the one below.
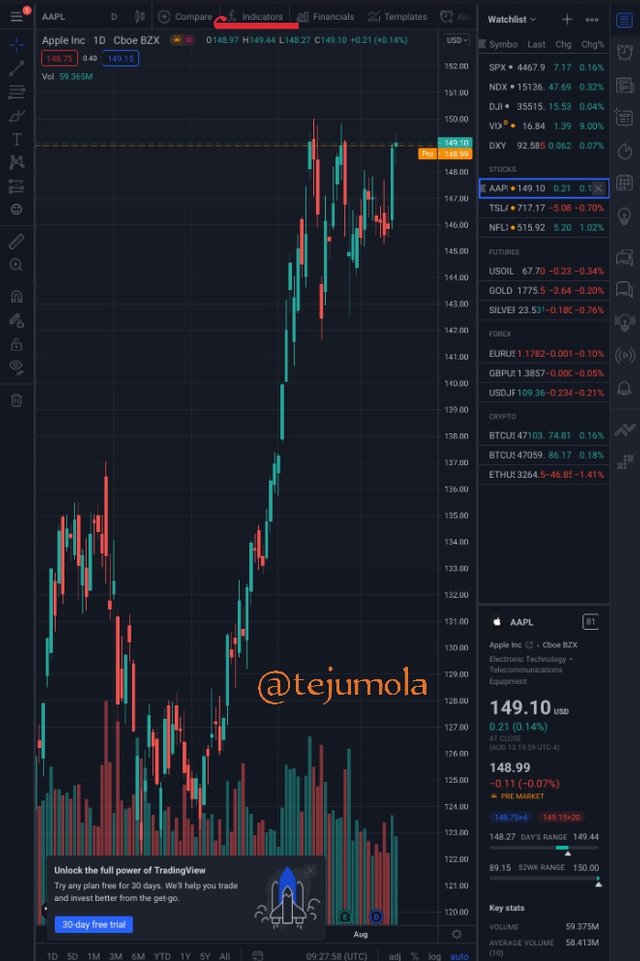
As you can see on the page above, in a role where you can see some tradingview features, as you can see in the above image, click on the indicator. After when you clicked on it, it will show a box where can find all indicators. As you can see below.
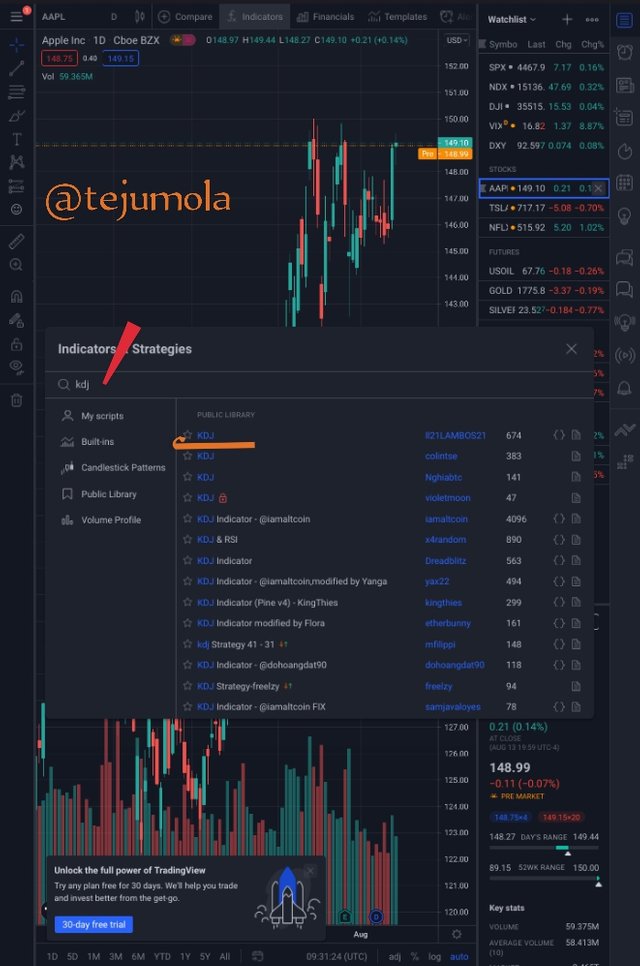
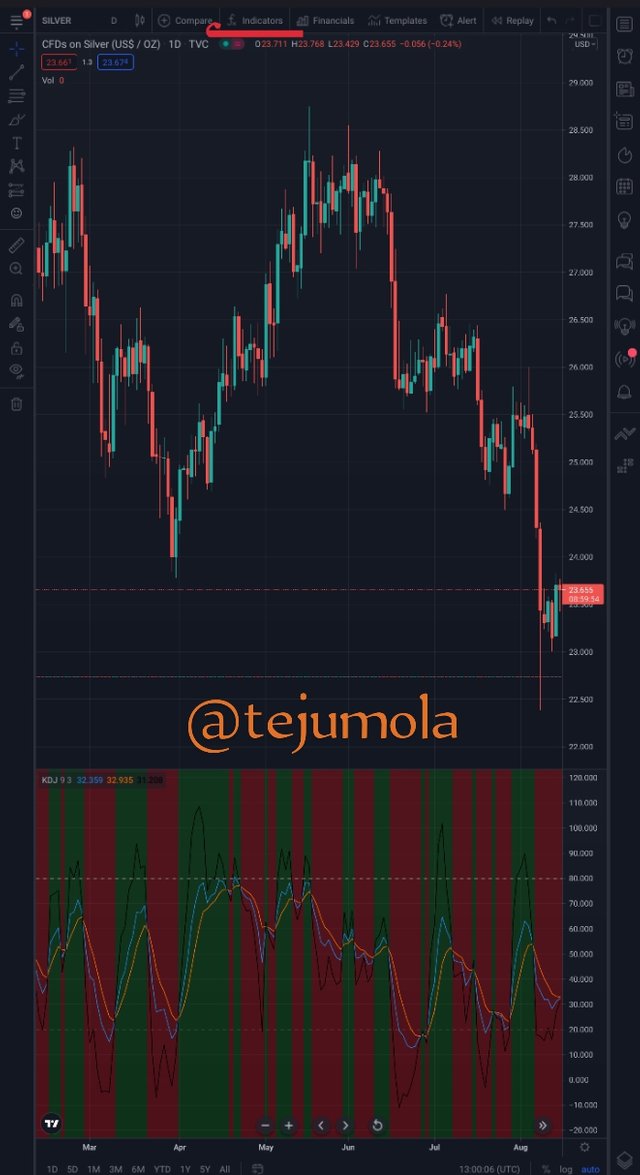
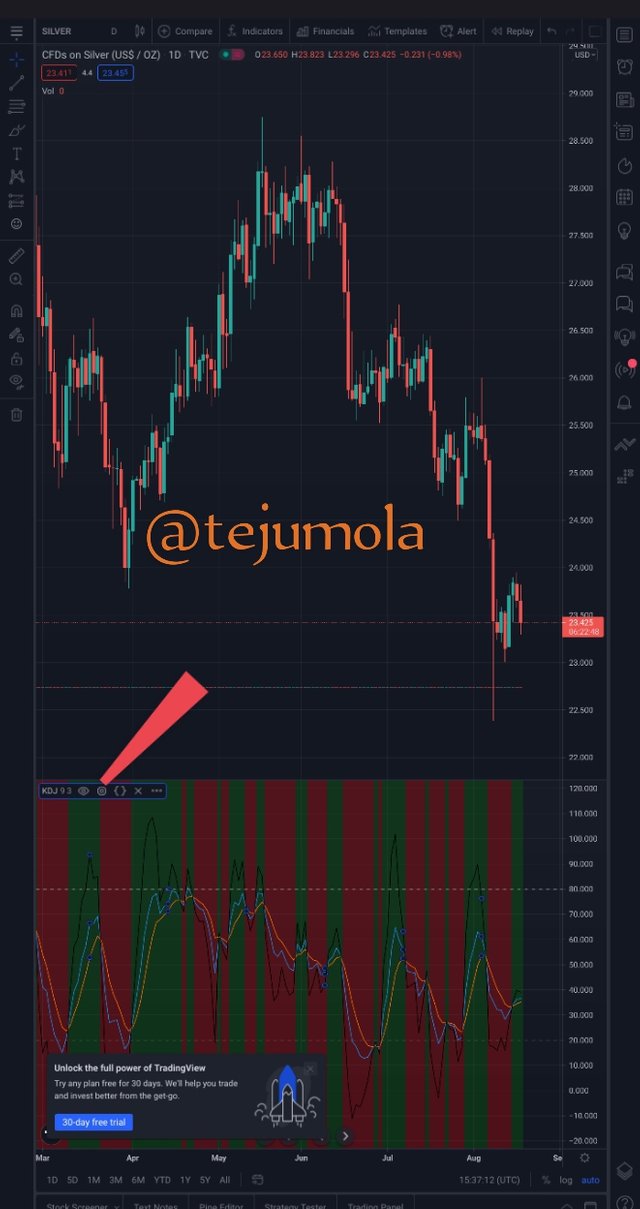
In the search engine, search for KDJ so that it can bring the list of indicator that looks like the word you have inserted in the search engine. I clicked on the first KDJ because it is by ll21LAMBOS21. After when you have clicked on it, it will immediately show on your chart. So, close the box with the list of indicators on it. You will see it on your chat as you can see below.
THE RECOMMENDED PARAMETERS?
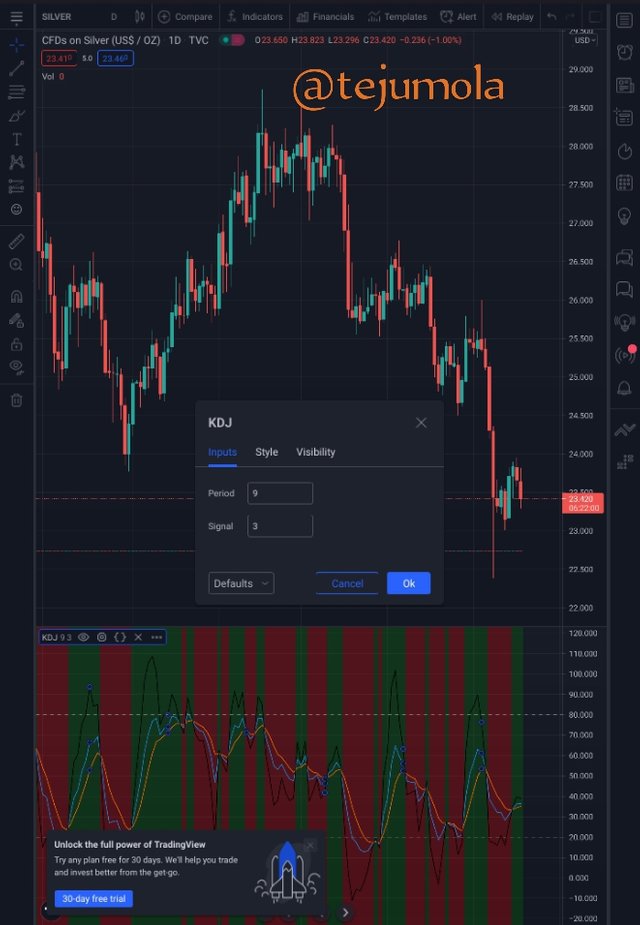
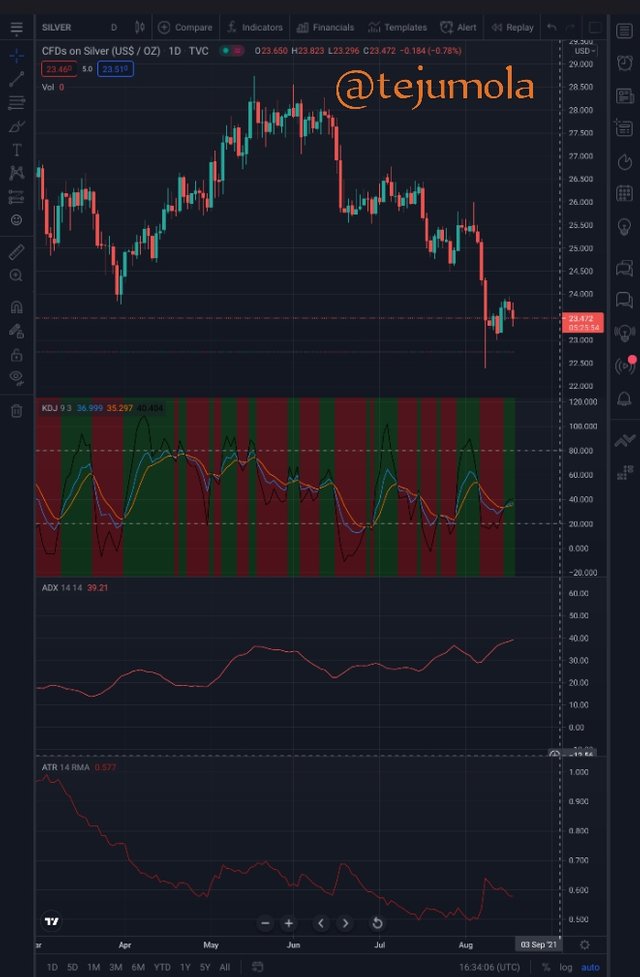
KDJ indicator which is also known as random indicator was first introduced by DR. Gorge Lane. It is a technical indicator tool that is commonly used for the analysis of gold, foreign exchange features, and the stock market. KDJ has its parameter which can easily be set by users according to different stocks and different periods. But the general or normal system default setting for the KDJ indicator parameter is 9. But, historically, according to experience, for the KDJ indicator to be more useful with some advantages, on a chart for prediction of price, its parameter can also be changed to 5,19,25 days.
Tradingview site
However, KDJ lines are of different colors for identification with their function. K-line is identified as the color blue, D-line has color red, and J-line has color black. The three are displayed in the above image. On trading view, you can choose to change KDJ input, style, and visibility. All is in the setting of KDJ as you can see below.
After when you have inserted the KDJ indicator on your chart, click on setting on as you can see below,
Tradingview site
After when you have click on the setting, it will display " input" as you can see below. It is now left to you if you want to change the size of the KDJ on your trading chart or not.
Tradingview site
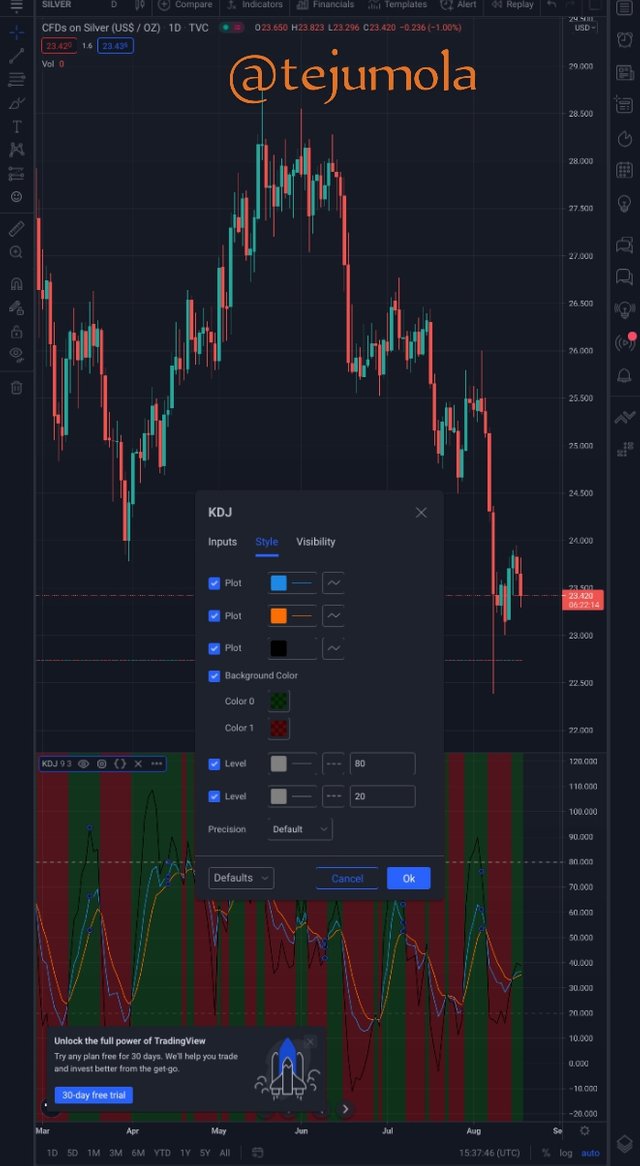
After "input" we also have "style". You can also decide to change the style of your indicator
it is left to you to change to your choice. See in the below chart.
Tradingview site
Lastly, on the setting, we have "visibility" as you can see below, you can also change the visibility if you chose to change it. It's your choice.
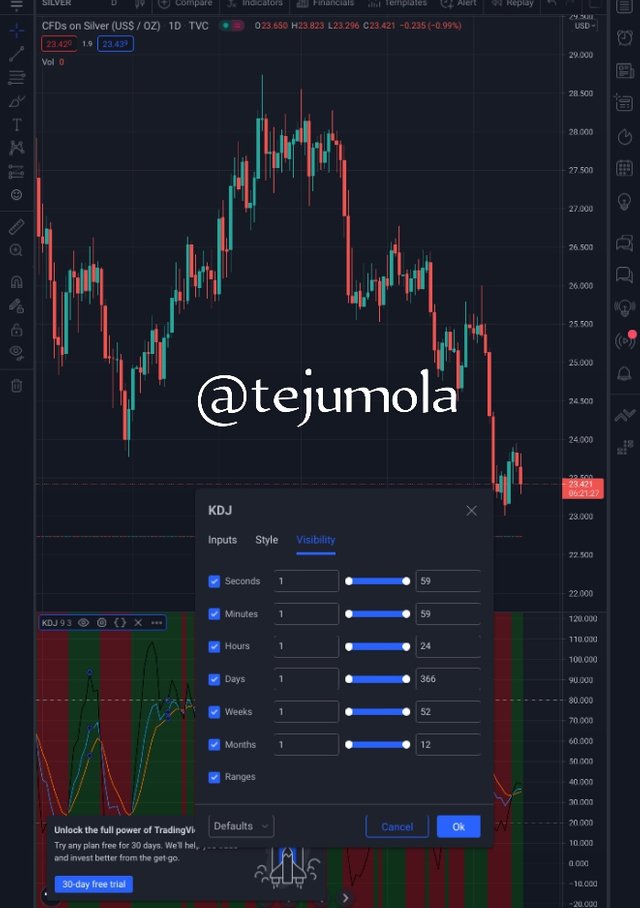
Tradingview site
DIFFERENCES BETWEEN KDJ, ADX, AND ATR
Indicators that I was told to explain their differences are KDJ, ADX, and ATR, which are technical analysis tools that can assist traders or investors in their analysis in predicting the future price of assets. ADX which stands for Average Directional Index and ATR which stands for Average True Range, are developed by the same person, J. Welles Wilder. While KDJ which represents K-line, D-line, and J-line was first introduced by DR. Gorge Lane, configured by ll21LAMBOS21. I will be differentiating below the difference between KDJ, ADX, and ATR. Follow me as I take you on the journey.
Tradingview site
KDJ is an indicator that is used by traders to determine the current movement of price trends. It helps traders to determine if an asset is overbought (70% or 80%) or oversold (20%). It is a very useful indicator that indicates the trend by analyzing its lines. The indicator is consists of three lines. It indicates price direction.
ADX which stands for Average Directional Index determines if we are currently in high or low volatility, regardless of the selected timeframe or assets analyzed. It is used to measure the strength and weakness of a trend and it does not show the price direction of a market.
ATR stands for Average True Range, describes the statistics of the price that is worthy of attention for particular assets on a specific timeframe. It's an indicator that measures market volatility. It is also an indicator to determine the market according to the lowest and highest value.
USE THE SIGNALS OF THE RANDOM INDEX TO BUY AND SELL ANY TWO CRYPTOCURRENCIES. (SCREENSHOT REQUIRED)
I will be using the KDJ indicator which is also known as a random index to buy and sell cryptocurrency. The first cryptocurrency pair I will be using randomly to buy and sell is USDCAD. I will be trading both tradingview and metadata 4 demo account to open and close the order.
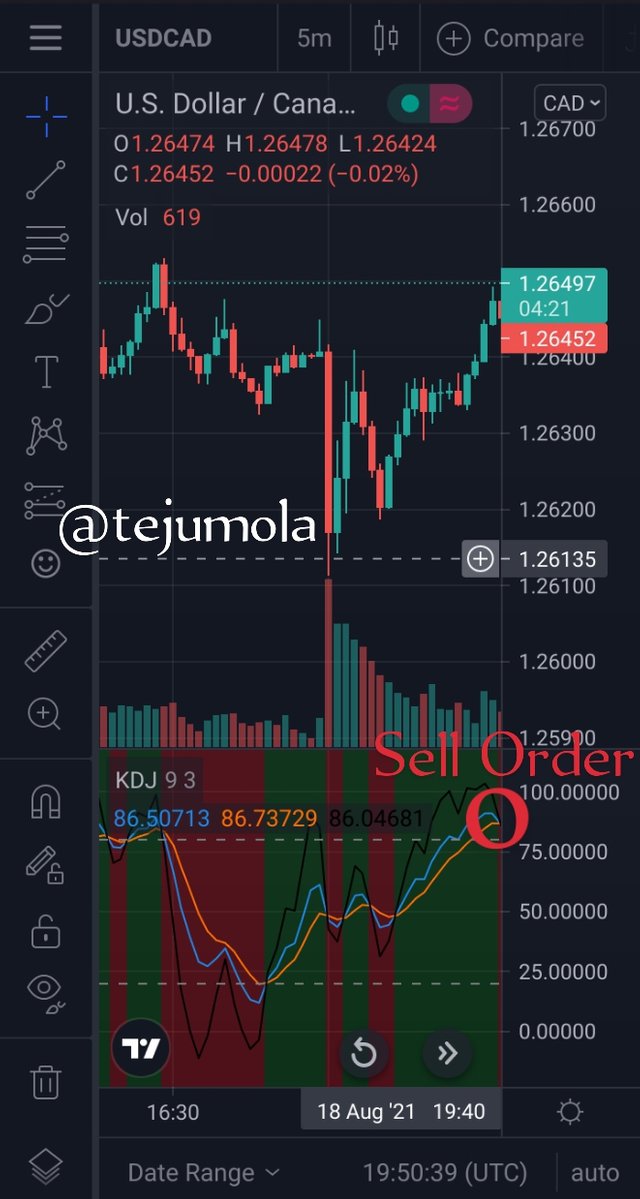
I made my technical analysis on tradingview but I purchased and sell orders on the Metatrader 4 demo account. As you can see below my chart page on tradingview. I discover KDJ indicator background just turn to green, J-line as cross above both K and D- line and that gives a signal to buy.
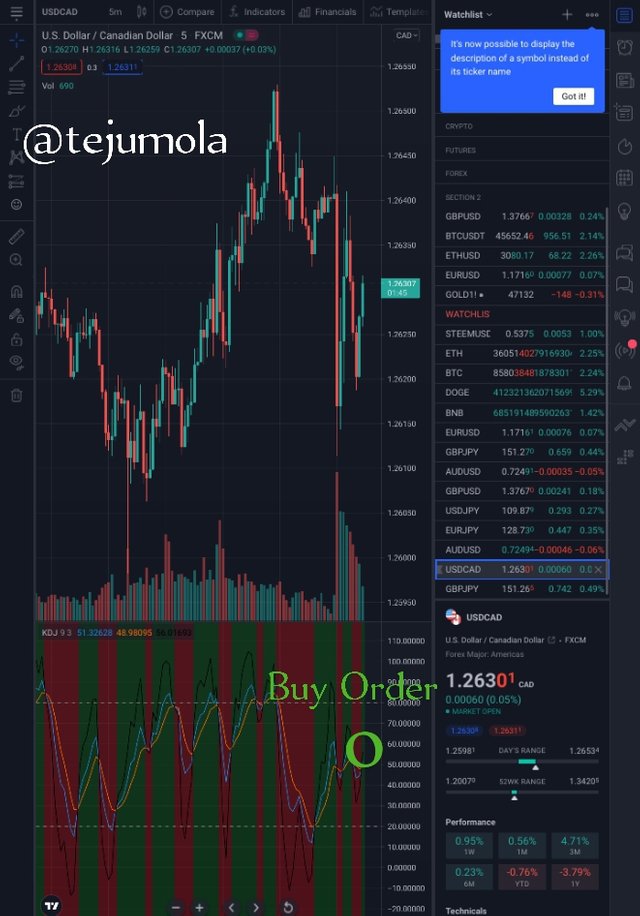
Tradingview site
After when I have discovered that, I went to Metatrader 4 demo account app to purchase the USDCAD as you can see in the below image.
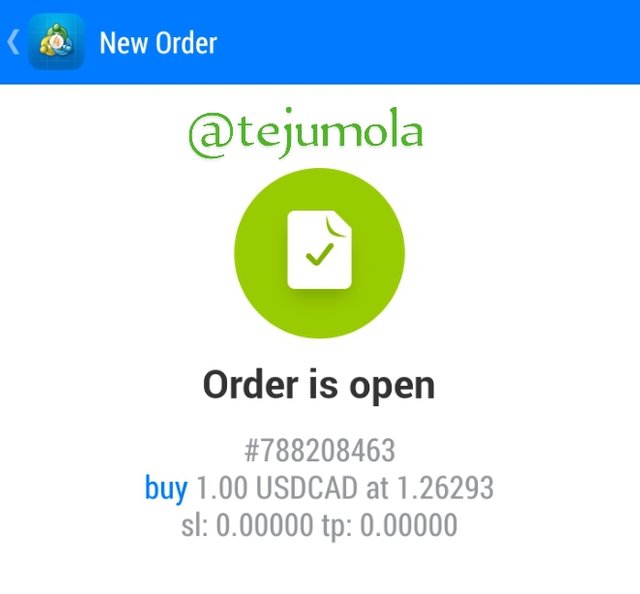
Metatrader
I went back to the tradingview chart page after some minutes because my trading timeframe is 5m. So I discover the green as started turning to red and that gives a signal of a bearish period because the J-line started going below K and D lines.
Tradingview site
After when I have close and sell the order, I was able to leave the trade with a profit of 154.95, as you can see below.
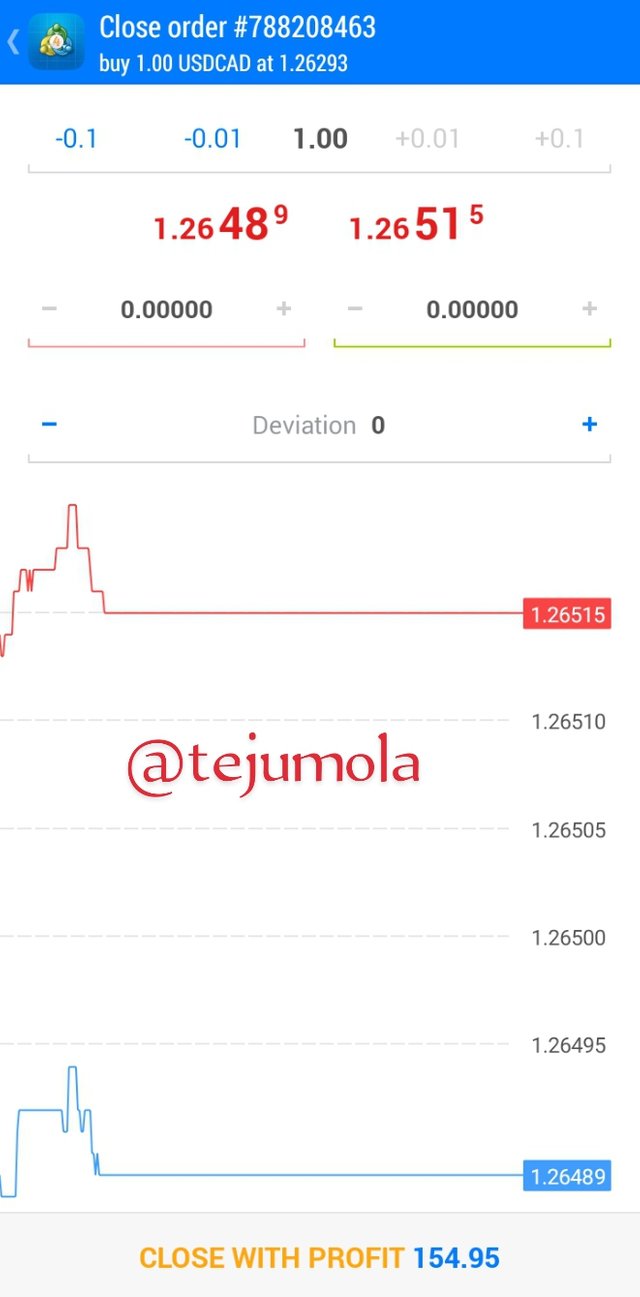
Metatrader
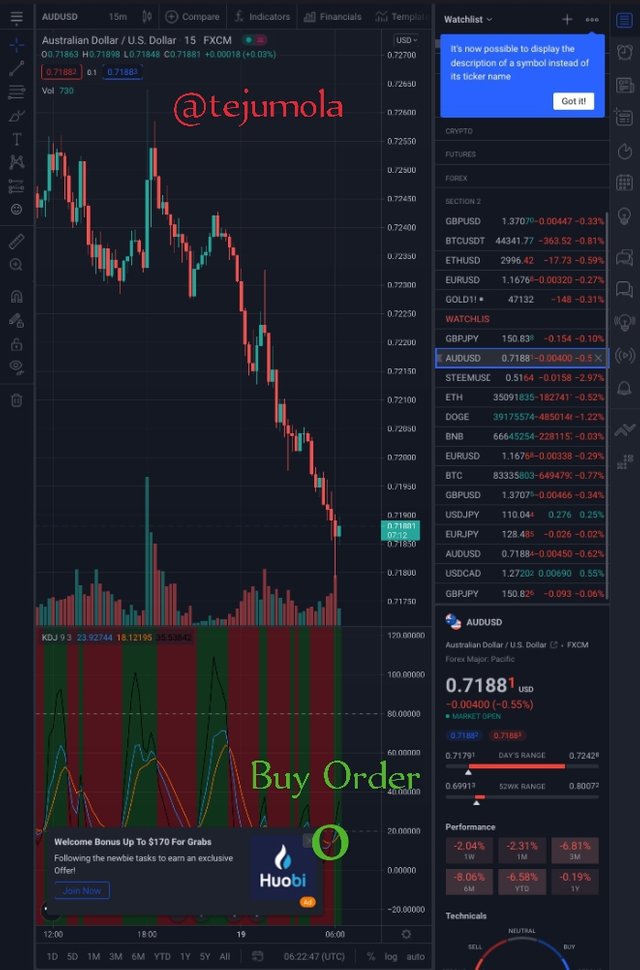
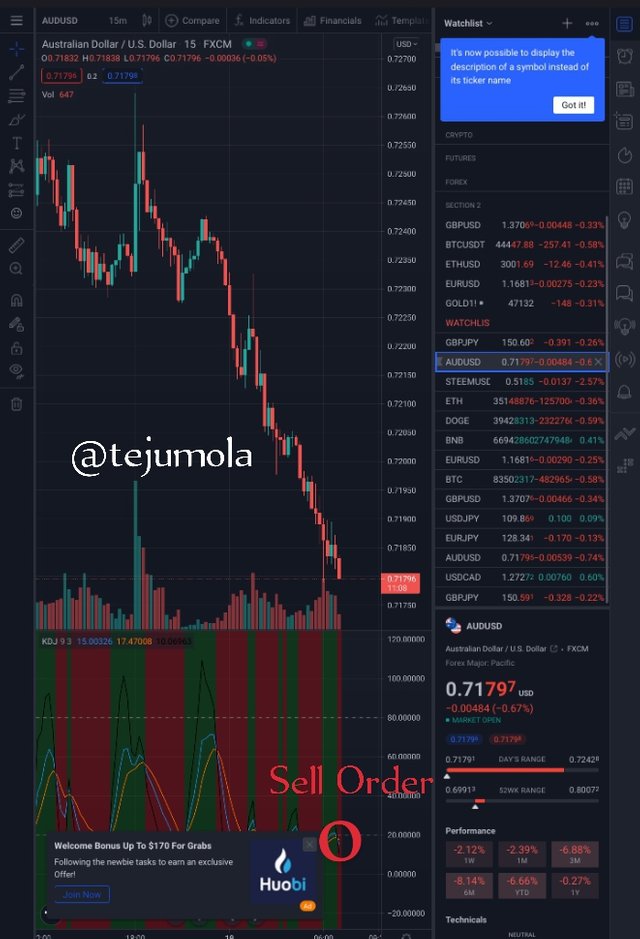
In the next cryptocurrency pair, I will be displaying how we can buy and sell cryptocurrency. Using the random index to buy and sell AUDUSD, with the use of the Tradingview site and Metatrader 4 demo account.
I made use of the KDJ indicator on tradingview to know when to buy or sell. I first added the KDJ indicator to my trading chart with the pair of AUDUSD. Not long, I saw that KDJ is about to be in an uptrend because I saw J-line crossing above both the K and D- line, as you can see in the below image.
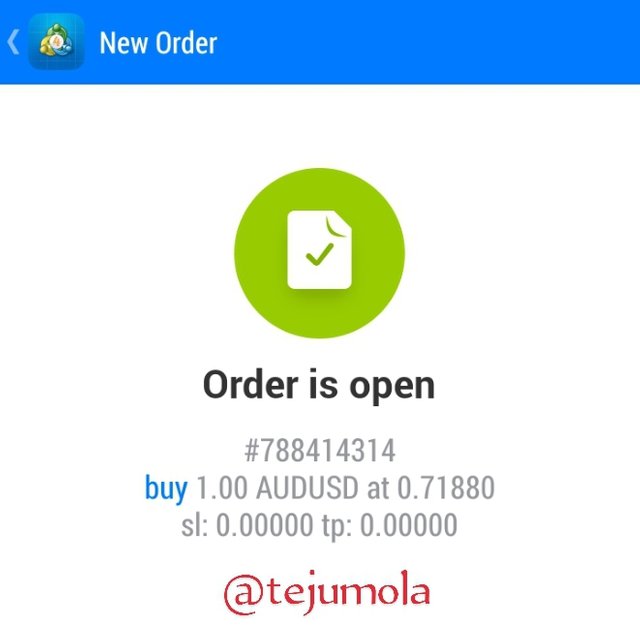
After when I have discovered that AUDUSD is about to be in an uptrend, I quickly went to my Metatrader 4demo account to open an order of AUDUSD pairs as you can see below.
I stayed in trades for some time, as you see below, before I discover the uptrend is over after when I saw that J-line is crossing the K and D- line below, also the background of the current trend has changed to red color.
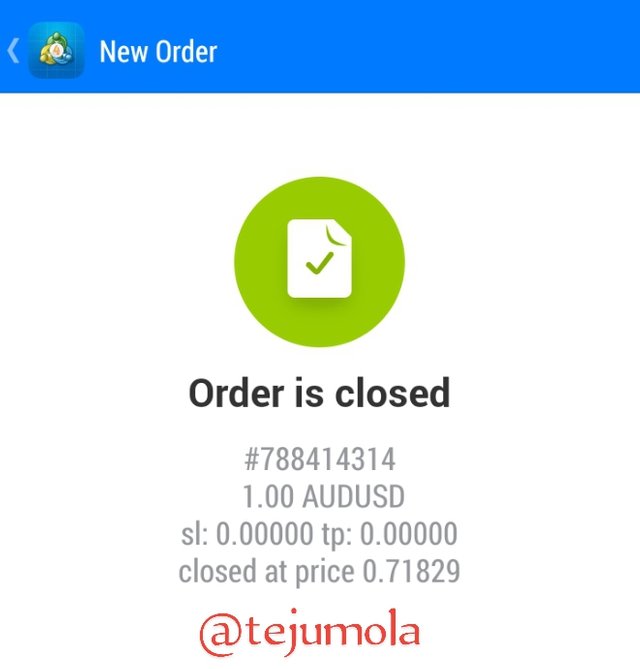
So I quickly went back to my Metatrader 4 demo account to sell the order as you can see below.
In conclusion, the KDJ indicator which is also known as a random index is an indicator that was derived from stochastic oscillators indicator with the difference of J-line. K-line and D-line show or signify if a security is overbought (above 70% or 80%) or oversold (below 20%) and J-line shows the changes in the price movement. It also shows good market entry and when to exit the market.
I want to use this medium to appreciate my Prof. @asaj for this wonderful topic. I enjoyed the class and it has added to my knowledge. Thank you very much, I look forward, receiving more lectures from you sir. Thanks for reading through my post.
Superb performance @tejumola!
Thanks for performing the above task in the eighth week of Steemit Crypto Academy Season 3. The time and effort put into this work is appreciated. Hence, you have scored 9 out of 10. Here are the details:
Remarks
You have displayed a good understanding of the topic. You have completed the assigned task. Your have performed the tasks in a commendable fashion.
Thank you very much professor