Cryptoacademy season 3- Homework post for @reminiscence01: Trading patterns
Questions
1.) In your own words, explain the psychology behind the formation of the following candlestick patterns.
- Bullish engulfing Candlestick pattern
- Doji Candlestick pattern
- The Hammer candlestick pattern
- The morning and evening Star candlestick pattern.
2.) Identify these candlestick patterns listed in question one on any cryptocurrency pair chart and explain how price reacted after the formation. (Screenshot your own chart for this exercise)
3.) Using a demo account, open a trade using any of the Candlestick pattern on any cryptocurrency pair. You can use a lower timeframe for this exercise.(Screenshot your own chart for this exercise).

1.) In your own words, explain the psychology behind the formation of the following candlestick patterns.
- Bullish engulfing Candlestick pattern
- Doji Candlestick pattern
- The Hammer candlestick pattern
- The morning and evening Star candlestick pattern.
Before I proceed with this question, I would like to say that there is either a bearish or bullish effect on every candlestick pattern and this helps a trader
to analyse determine who is in control of the market at the moment. On to the question;
1a.) The Bullish engulfing candlestick pattern:
This candlestick pattern comprises of 2 candles, a bearish candle and a bullish candle. The bearish candlestick is followed by a longer bullish candlestick which tends to overshadow the bearish candlestick on the chart.
.png)
Source
The psychology behind the pattern simply signifies that buyers have "overthrown" and taken full control of the market after a bearish trend. This often leads to a bounce back(reversal) in the chart and would mean that the price of the commodity is rising which will help a trader know that he/she should buy the commodity.
1b.) Doji Candlestick pattern:
This candlestick pattern occurs when the price of a commodity opens and finalises(closes) at the same price. There are 3 examples of Doji candlesticks and they are:
- Dragonfly doji
- Long-legged doji
- Gravestone doji
Dragonfly doji: This is the doji in which the candlestick opened and closed at the same price which is also the highest price the commodity went through.
.jpeg)
Source
The dragonfly doji signifies that the buyers are in control as the price of the commodity fell but was still closed and finalised at the same opening price which means that the activity done by the sellers was somewhat insignificant compared to that of the buyers. This usually indicates a bullish trend after
Gravestone doji: This is the exact opposite of the dragonfly doji. It is when the lowest, opening and closing prices are the same on a candlestick.
.jpeg)
Source
The psychology behind the gravestone doji is that sellers are in control of the market despite the activity of buyers and a bearish trend will follow after the bullish trend. This tells traders to sell.
Long-legged doji: In this type of Doji, the candlestick opens and closes at the same price but is neither at the highest or lowest prices.
.jpeg)
Source
The long-legged doji represents an indecisive market where no one is in control. Some may presume there to be an equivalence in the activities done by both buyers and sellers in the market(which Is wrong). When this candlestick occurs in a chart, traders are advised to wait for the next candle to form before taking a decision.
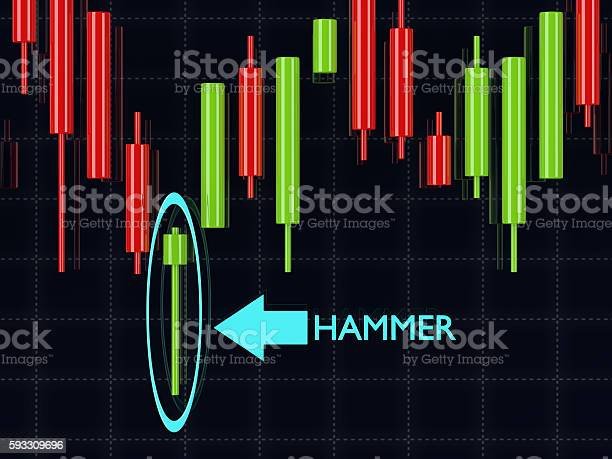
1c.) The hammer candlestick pattern: It has the name "Hammer" because the candlestick takes the shape of the hammer. Like I said before, for every candlestick pattern, there is a bullish and a bearish form and the hammer candlestick is no exception.
Bullish Hammer candlestick: This is when the highest and closing prices are equal. It shows that the buyers are in control of the market at the moment as the price rises. This pattern can be used to show a reversal after a bearish trend.
Bearish Hammer candlestick: The exact opposite of the bullish hammer candlestick. This appears to be inverted compared to its counterpart as the lowest and opening prices are the same.
Source
1d.) The morning Star pattern: The star patternspattern consists of three candles, a bearish candle, a doji candle and a bullish candle. In the morning Star pattern, a bearish candle comes in first and is then followed by a doji candle and finally a bullish candle. The psychology behind the morning star is that as the price depreciates, there would be a point in which sellers would be incapable of controlling the market(represented by the doji) and then the buyers take over(represented by the bullish candle). This is used to indicate a reversal in the previous bearish trend.
.jpeg)
Source
- The evening star pattern: Consisting of the same candles as the morning star, the evening star is more of a bearish pattern as the bullish candle appears first with a doji coming after and then a bearish candle. This pattern denotes that the sellers have taken control of the market after the buyers were in control and were incapable of continuing the trend. This pattern normally indicates a strong reversal in the previous bullish trend.
.jpeg)
N/B: Any type of Doji can occur in the star patterns depending on the movement of the price.
2.)Identify these candlestick patterns listed in question one on any cryptocurrency pair chart and explain how price reacted after the formation. (Screenshot your own chart for this exercise)
- Bullish Engulfing Candlestick:
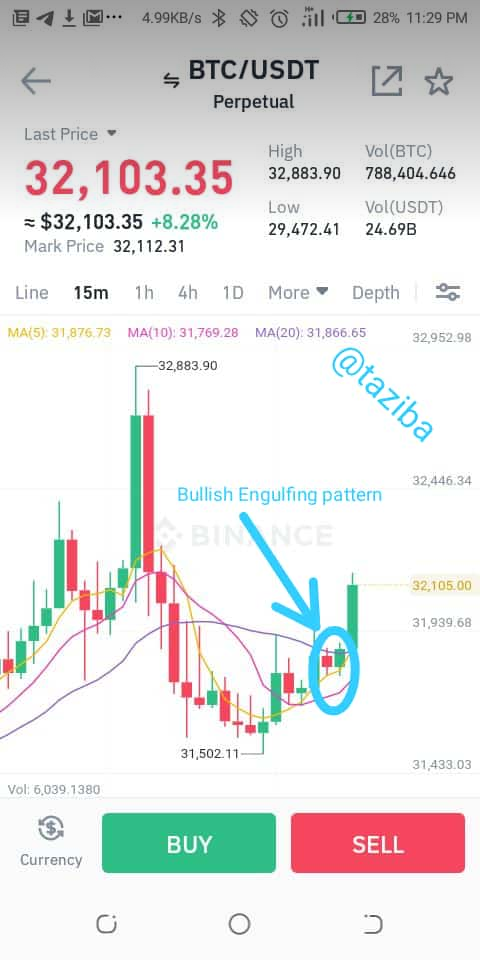
Trading chart for BTC/USDT
Above is a bullish engulfing pattern i identified on the trading chart for BTC/USDT. As we can see, the bullish candle overshadows the bearish candle and indicates that buyers(people converting their USDT to BTC) are in control of the market. This is further justified by the next candlestick which is another strong bullish candle. At this point, it is adviceable for trader to buy.
- Doji Candlestick pattern:
Dragonfly doji
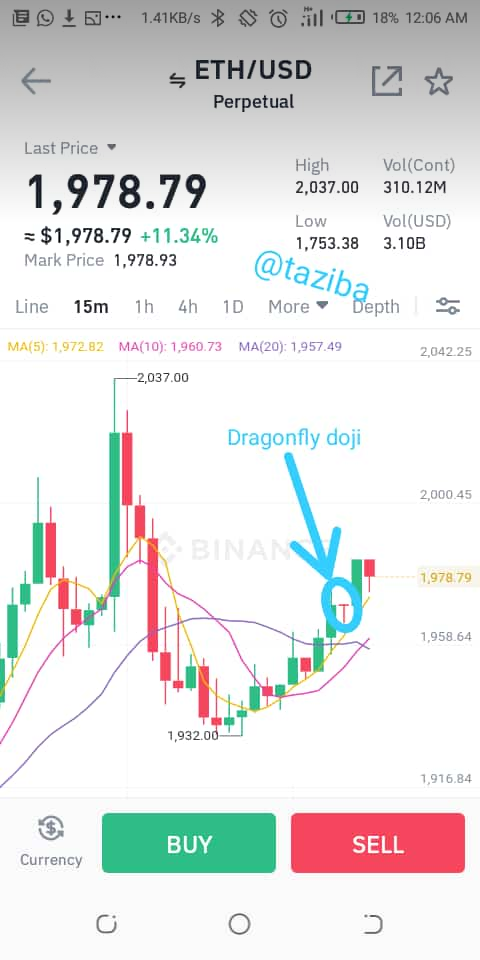
Trading chart for ETH/USD
I was able to identify a dragonfly doji pattern in the trading chart for ETH/USD. The dragonfly doji is meant to represent buyers taking over the market and did exactly just that on the chart. But the only thing is that in the chart, buyers were already in control of the market, so the activity of sellers were futile as they couldn't take control of the market and the price of Ethereum kept on rising.
Long-legged doji:
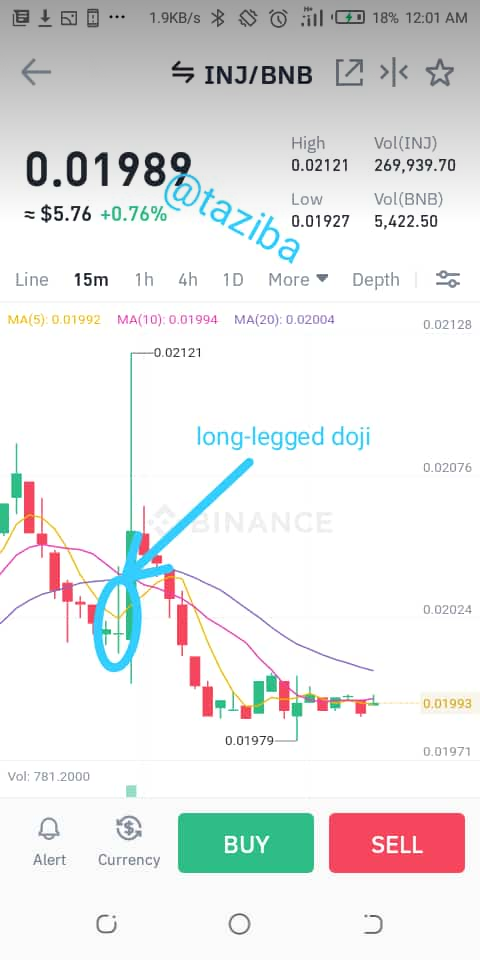
Trading chart for INJ/BNB
In this chart, there was a bearish trend indicating that sellers were in control of the market until a small bullish candle which indicates that the market might be controlled by the buyers in a possible reversal trend. After this came the long-legged doji. At this moment, it simply meant an indecisive market. But the next candlestick showed that the buyers were in control as the price boosted up.
Gravestone doji
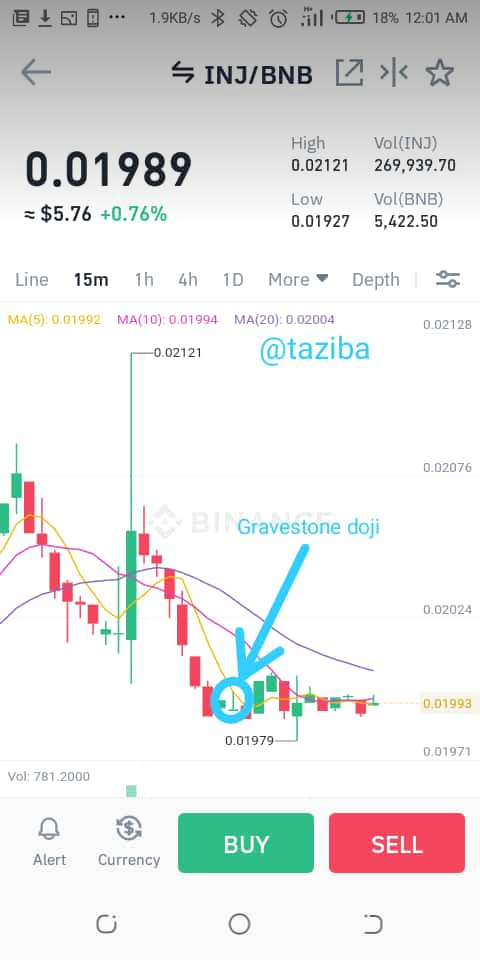
Trading chart for INJ/BNB
In this same chart, I was able to recognise a gravestone doji pattern which occurred during a bearish trend. The gravestone doji signified that the sellers were still in control of the market despite the efforts of buyers and this meant that the price of the commodity still went down.
- Hammer candlestick pattern:
Bullish Hammer candlestick
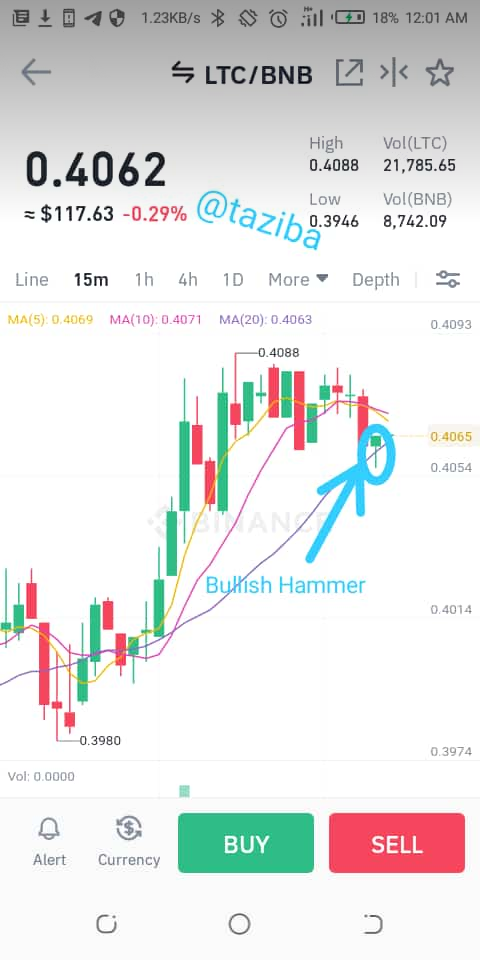
Trading chart for LTC/BNB
The hammer candlestick pattern above can be seen after a bearish candle and this indicates that buyers are in control despite the activity of sellers and the price rose after this.
Bearish hammer candlestick:
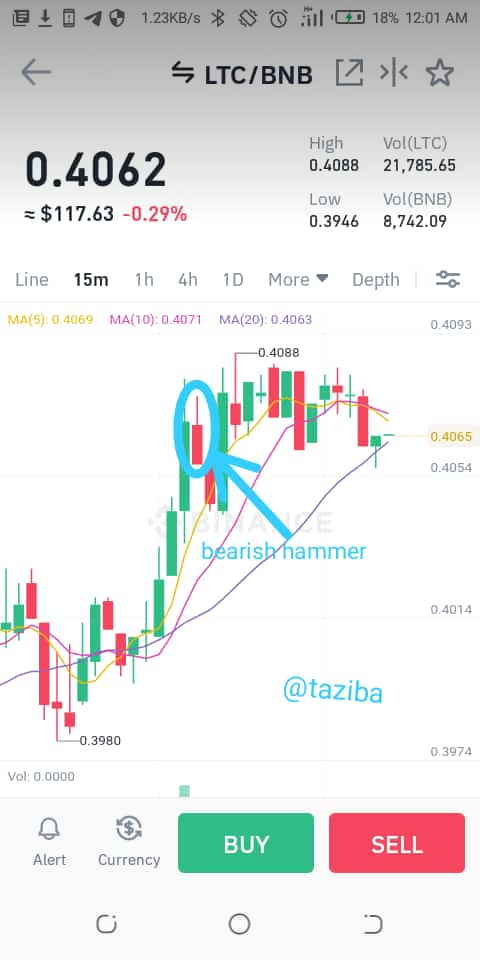
This bearish hammer occurred after a bullish candle and it implied that sellers got in control of the market. This fall in price was further denoted by the next candle and implied that that sellers were the ones controlling the market at the time.
- The morning star candlestick pattern:
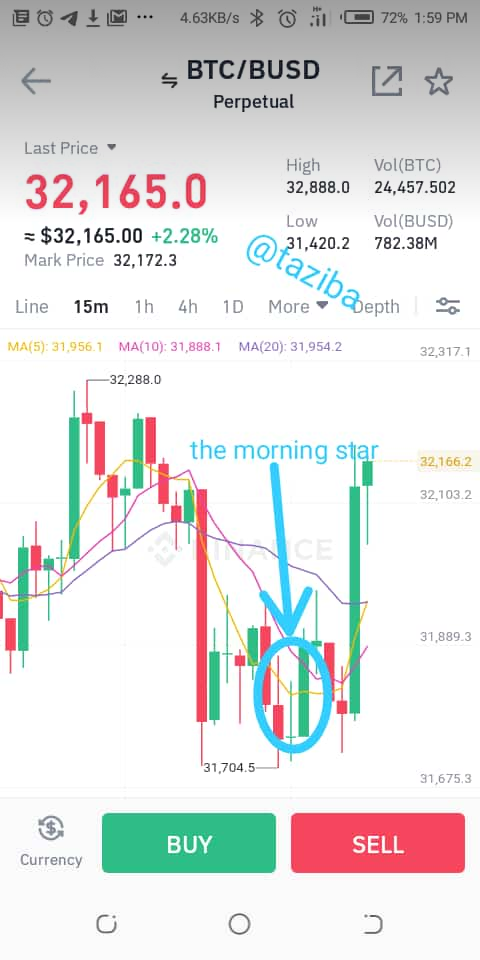
Trading chart for BTCBUSD
The morning star pattern is used to indicate a reversal after a bearish trend and so it did. The price went up as shown in the candlestick after the star indicating that buyers were in control of the market. The price of the commodity increased.
- The evening star pattern:
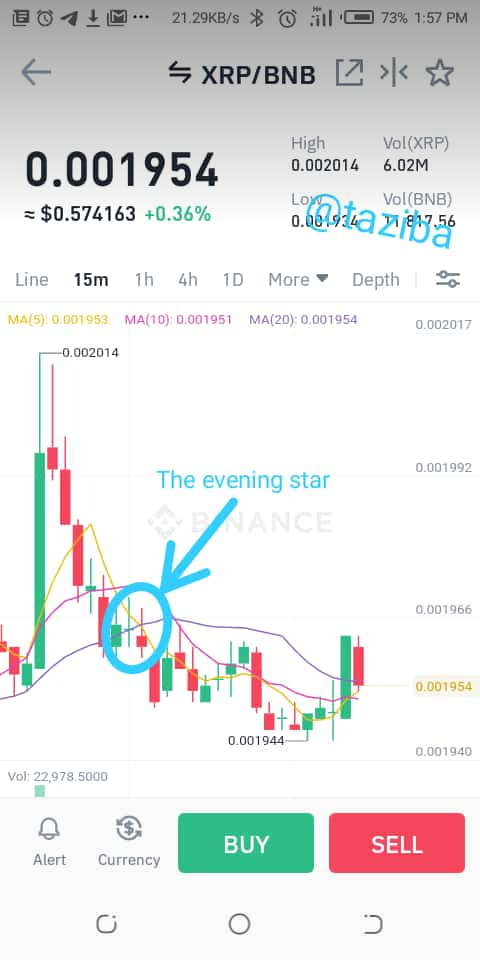
Trading chart for XRP/BNB
Having identified the evening star pattern above, I can denote that the buyers were incapable of being in control, thereby putting an end to the bullish trend and then the takeover by the sellers. The price of XRP dropped accordingly after this and can be seen as represented by the proceeding candlestick.
3.)Using a demo account, open a trade using any of the Candlestick pattern on any cryptocurrency pair. You can use a lower timeframe for this exercise.(Screenshot your own chart for this exercise).
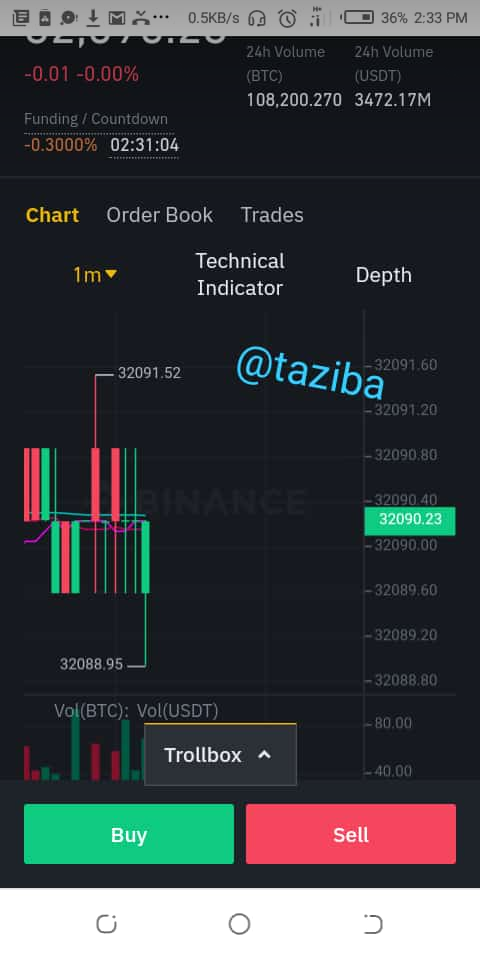
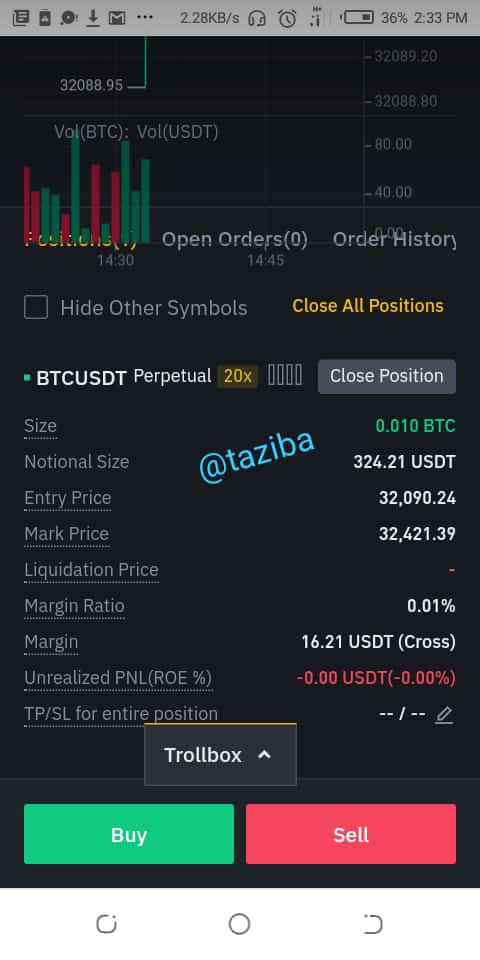
This trade was made on my binance futures account(demo). I traded on the crypto pair BTC/USDT by buying.. The psychology behind me buying was that I observed two long-legged doji candles which were green and I assumed that buyers were the ones in control of the market. But after buying, sellers tried to take control of the market but were unable and so, the next candle formed was a bullish hammer. So as a result, I got no profit from the trade.
N/B: the time frame used was 1minute.
Conclusion
Trading patterns are patterns normally spotted on trading charts which help traders determine price movement and make good trading decisions. Knowledge of these patterns is essential to trading but this alone cannot make one a good trader. Looking forward to the next lesson. Thank you.
CC: @reminiscence01
Hello @taziba , I’m glad you participated in the 4th Week of the Beginner’s class at the Steemit Crypto Academy. Your grades in this task are as follows:
Observations:
You have used images with watermark. This is not acceptable in Steemit Crypto Academy. Please use images with copyright free sources and reference them properly.
Recommendation / Feedback:
You did a great work but failed to adhere to the the homework guidelines by using images with watermark.
Thank you for participating in this homework task.
Thank you for the feedback prof
I will try to be more careful with the images I use next time