Trading Strategy with Median Indicator - Steemit Crypto Academy |S6W4| - Homework Post for Professor @abdu.navi03
INTRODUCTION
Hello my fellow Steemians, It is a great pleasure having you all in the 4th week of season 6 in the Steemit Crypto Academy. This week, we will be learning about the Median Indicator. Generally, indicators are important technical analytical tools in today's financial market. It will be amazing to learn one out of the numerous indicators. I appreciate professor @abdu.navi03 for the great teaching on Median Indicator. Let's start by understanding how this indicator works and then apply our knowledge of the indicator into generating trading signals from the indicator.

Understanding Median Indicator
Indicators are important technical analytical tools in the financial market a trader can make use of while making a good trading decision in the market. Median indicator just like the moving average, is a trend-based indicator used for identifying the market trend. The median indicator differs from other trend-based indicators in the sense that, the indicator measures market volatility using channel created with an ATR from the median line.
The volatility in price is determined by the ATR of the median line which is drafted above and below the median line. The median line is just like an EMA of the same length but the difference between the median line and the EMA of the same length is the cloud that forms on the indicator which determines the market trends. The colour of this cloud changes from purple to green which indicates a bullish or a bearish market.
The presence of a green cloud when the median line crosses above the EMA signals a bullish trend. And the presence of a purple cloud when the median line crosses below the EMA.
Parameters and Calculations of Median Indicator
Technical indicators are derived from mathematical models of price action like the highs, lows, closing price and opening price over a given period. The Median indicator utilizes the ATR as well as a multiplier to draft the upper and lower band above and below the median line. Below is the calculation of the median indicator.
Median length = This refers to the number of data points that is put into consideration when calculating the median. The value of which is 3 by default.
ATR = This means the time put into consideration when calculating the median. The value is 14 by default.
ATR Multiplier = In the formation of the upper and lower bands, the ATR value is multiplied by the ATR. The value is 2 by default.
Lower band = Median length - (2ATR)
Upper band = Median length + (2ATR)
The values given above are the indicators derivatives.
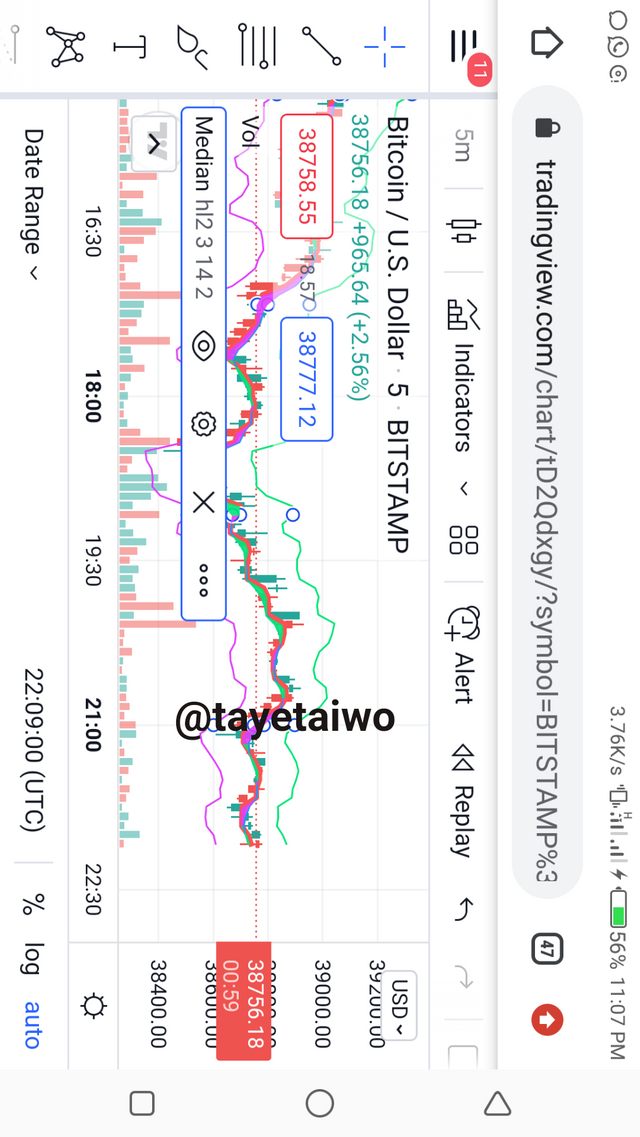
Represented in the chart above are the parameters of the median indicator which I have described in the calculation before now. Wrong inputs of the ATR and median length values can alter the smoothness of the indicator and give fake outs or false signals.
Uptrend from Median Indicator
The median indicator like the moving average, is a trend-based indicator. The main determinant of a bullish or a bearish trend is the difference between the median line and an EMA of the same length.
When the median line is above the EMA, the cloud is green, signalling an uptrend. Here, the a trader look out for a bullish position in the market. Below is an example of an uptrend from a median indicator.
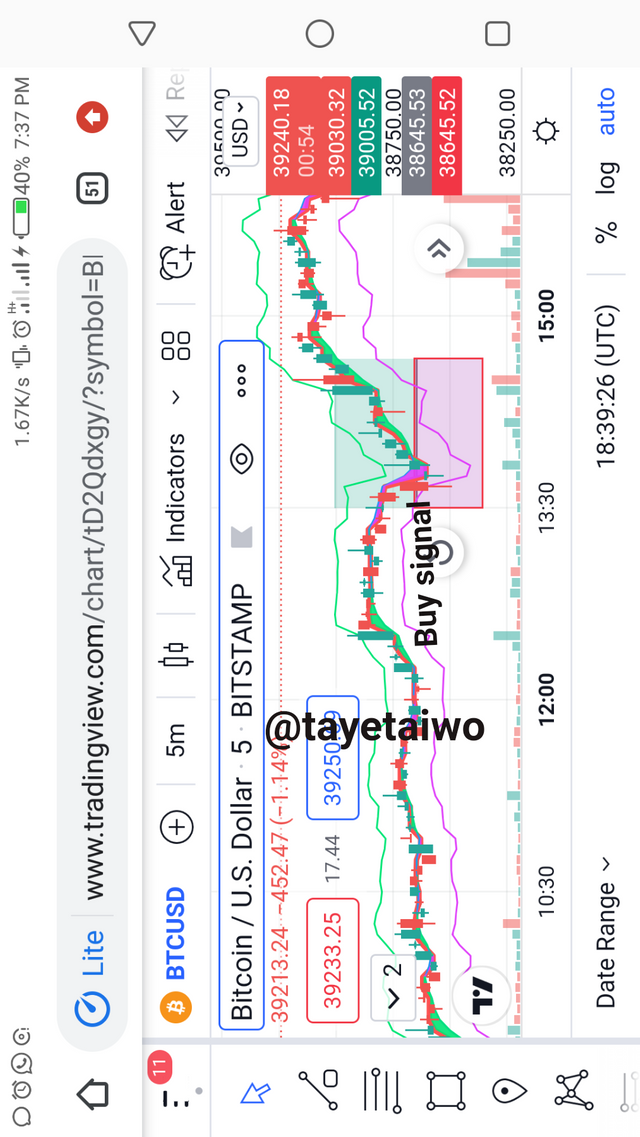
In the above image, the clear change in the cloud's colour from purple to green signifies a bullish trend.
Downtrend from median indicator
The marked out difference between the median indicator and an EMA of the same length is seen in the formed cloud and it determine the market trend. When the median line is seen below the EMA the cloud changes from green to purple to signify a downtrend. When this is seen in the market, traders can take advantage of it to open a sell order. Below is an example of a downtrend from median indicator.
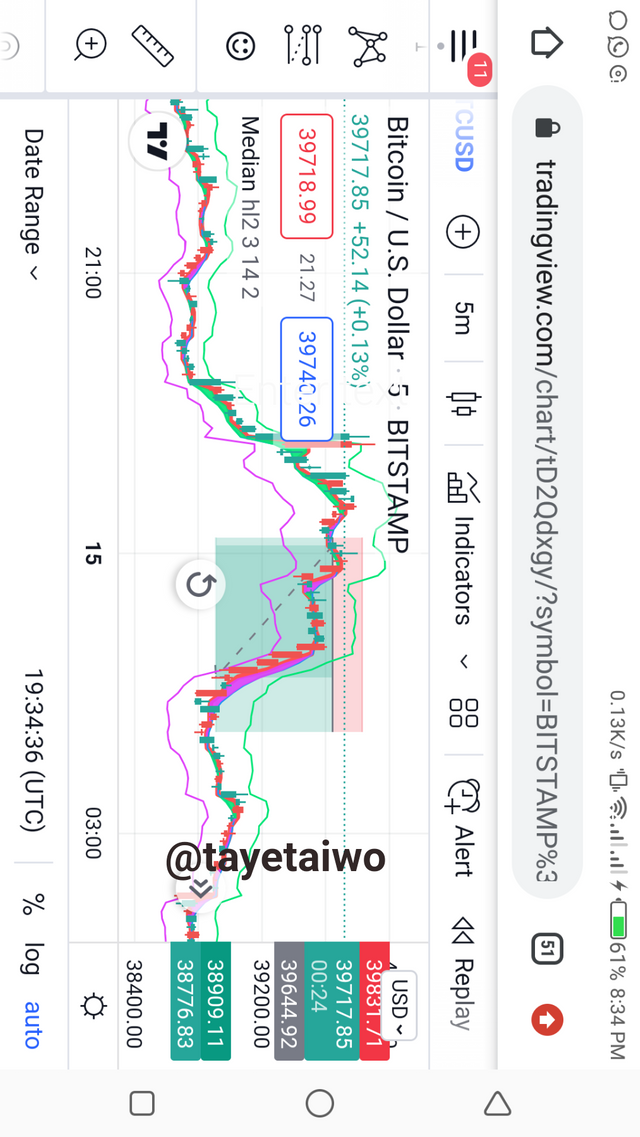
In the above chart, the change of cloud from green to purple after a bullish trend signifies a trend reversal to the bearish side.
Identifying Fake signals with Median Indicator
Technical indicators cannot 100% accurate because there is no ideal machine. Therefore, there are chances of indicators giving fake signals. Median indicator is not an outlier as it can also give fake signals. Some indicators are seen behind time chart and thus gives fake signals. Indicators provides more accurate signals when combined with other technical indicators to eliminate false signals. Here, I will be using the moving average indicator to sieve out the false signal from the median indicator.
Moving average unlike RSI is a trend-based indicator that signals price movement at a given period.
Source
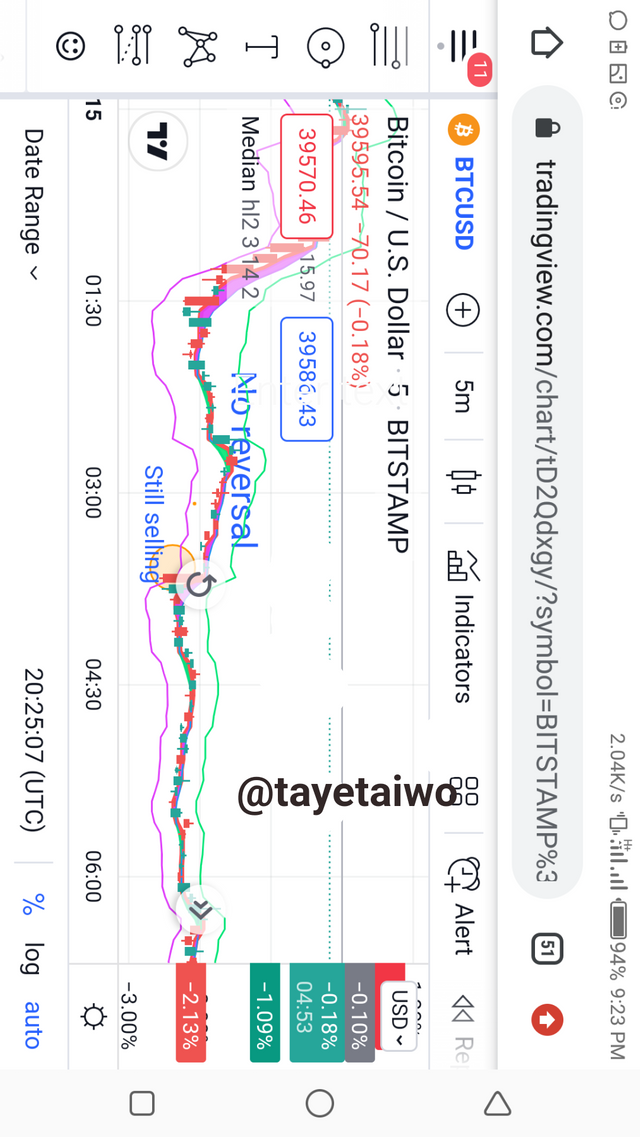
From the above screenshot, you can see that the green cloud didn't form well before the purple line took over again to continue the downtrend.
Also, the moving average indicator confirmed that there was no reversal as you can see.
Opening a Demo Trade using the Median Indicator
Here, I will be making a demo trade from the signal gotten from the Median indicator. I will carry out the analysis on source and I will execute the trade using Tradingview paper trading.
Buy trade on ETH/USDT
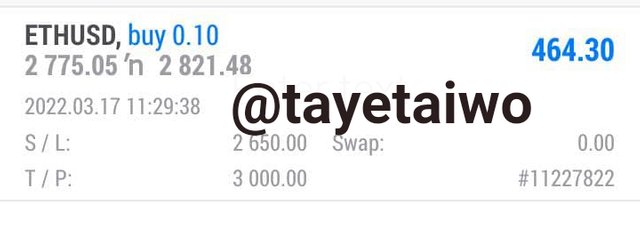
Taking a good look at ETH/USD chart, I observed price was in a downtrend as indicated by the median indicator with a purple cloud. After some time, the cloud changed from purple to green with a bullish reversal candlestick pattern. This signifies a reversal in the market trend and an opportunity to open a buy position. I opened a buy position on ETH/USD with a risk-reward ratio of 1:3.
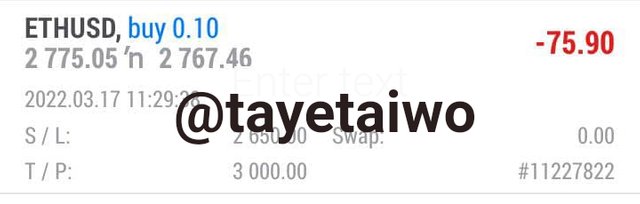
After some times, below is the result of my trade.
Sell trade on BTC/USDT
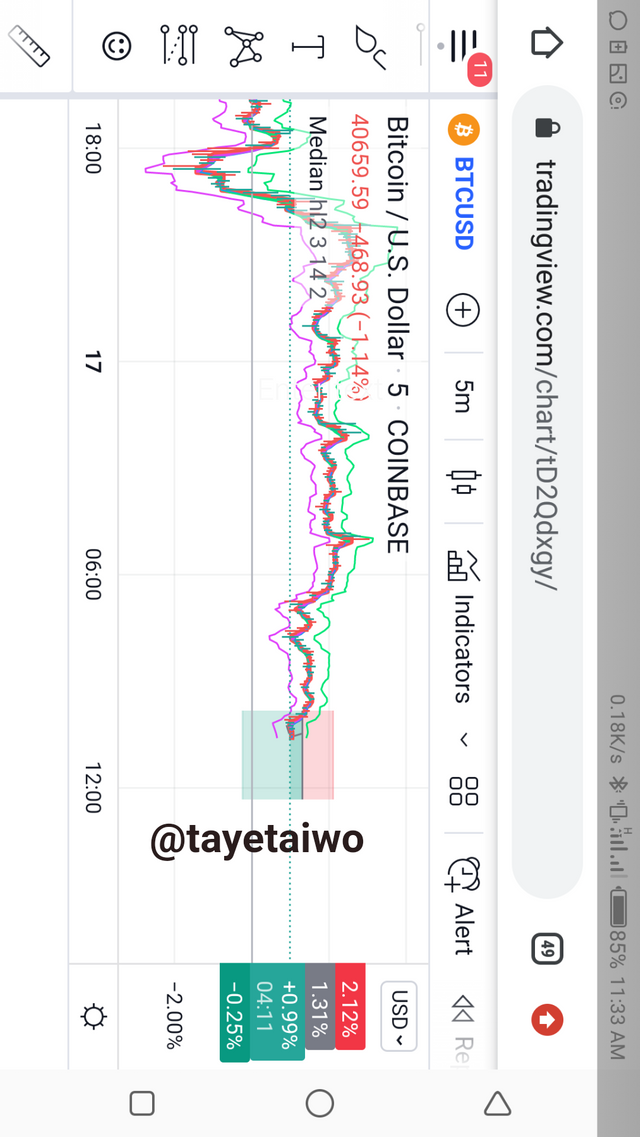
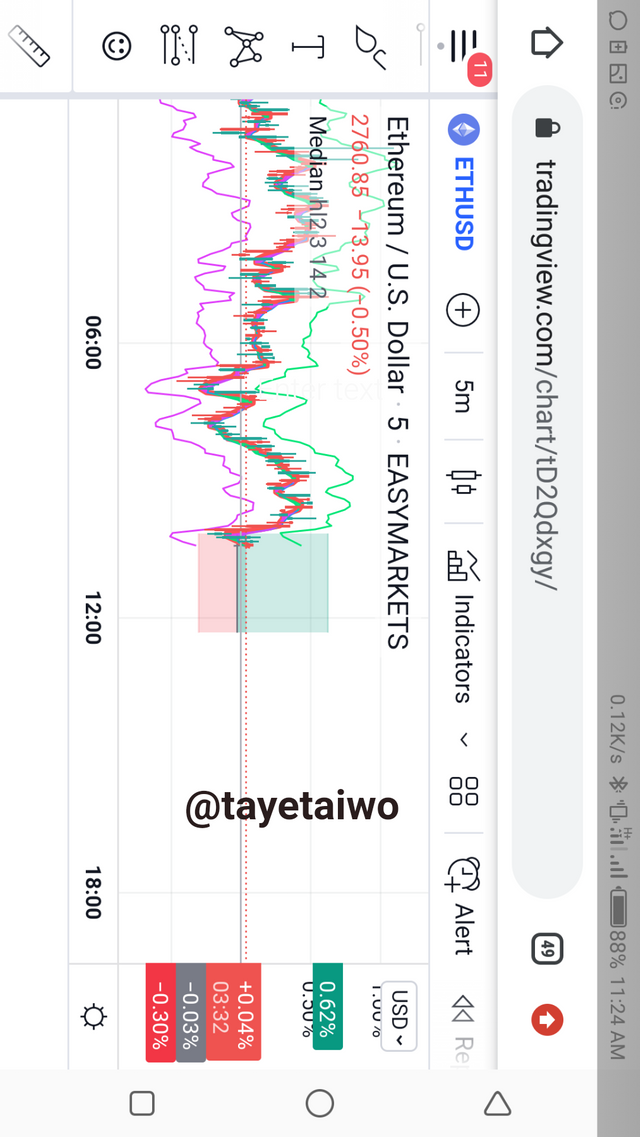
Taking a look at BTC/USD chart, I noticed a ranging market as the median cloud maintained the purple cloud and at a time it changed to green and then from green to purple. The change signals a downtrend and an opportunity to open a sell position. I opened a sell position with a risk-reward ratio of 1:2.
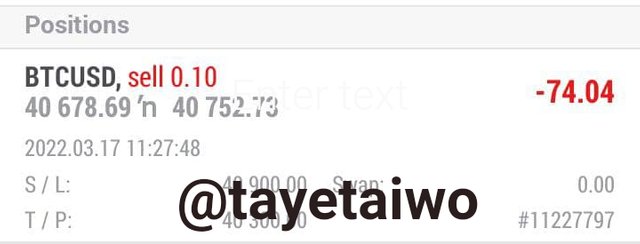
Unfortunately this trade touched the stop loss and closed.
Conclusion.
In conclusion, median indicator is a trend-based indicator, that shows the trend and also give hint of the market direction and possible entry point.
Indicators are not always accurate so, it is advisable to use two or three indicators to make an analysis before placing a trade.
I appreciate professor @abdu.navi03 for this wonderful teaching on median indicator.