Crypto Trading With Average True Range (ATR) Indicator - Crypto Academy /S5W1-Homework Post for kouba01
Question (1)
Discuss your understanding of the ATR indicator and how it is calculated? Give a clear example of calculation
The ATR or the Average True Range is a technical indicator that was developed by an Analysis technician called J. Welles Wilder Jr. in his book New Concepts in Technical Trading Systems. This indicator was developed to monitor the market and identify the presence of Volatility in the market.
Very high volatile markets have always been a problem for traders to trade because of the quick up and down movements that the price action makes, but with this indicator, a trader can identify entry and exit points in the market, also it can be used as a risk management guide because it helps traders to set stop loss and take profit.
The ATR was initially developed for trading commodities but since it has been used for trading other markets like Stocks Indicies and Crypto, in fact, in any market where there is a potential presence of high volatility the ATR could be used in trading such markets.
The ATR is good at spotting entry and exit zones for the market but it might be limited in predicting the likely direction a trend will take during this volatile movement that is why it is advisable to combine the ATR with other favourable indicators to achieve a more favourable or successful outcome.
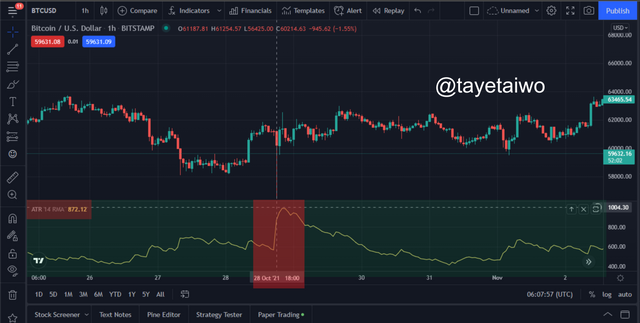
Above is a clear image of the ATR indicator on the BTC/USDT. In the Red zone marked area the ATR identifies a Bearish spike in the market, this means that the ATR is better used for a highly volatile market.
The Average True Range or ATR can be calculated just like any other technical indicator, but I would like to simplify how it is calculated for a better understanding.
First, we have to understand that the ATR is like a moving Average and it works with periods which affects the impact of the indicator depending on the period used during its use. The ATR comes with a default setting of 14 day period, this means that the ATR of the asset over 14 days is what is calculated.
For a setting that has a lower period of 14 days, the ATR would be more reactive to the price action of the underlying asset, for example, if 5 days is used as a setting for the ATR, this means the at it would be calculated within the range of 5 days.
The calculation of the ATR is based on 3 methods that are used to identify the TR or True Range.
- Current high - current low
This is used when the current candlestick bar is wider in range than the previous price
- Current high- previous close
This is used when the current candlestick closes higher than the previous candlestick
- Current low - previous close
This is used when the current candlestick closes lower than the previous closing price
Therefore to calculate the TR the formula below is used
TR = max[( High – Low of the day) abs(High – previous days close) abs(previous days close – Low of the day])
Thus the Formular for calculating the ATR is
Current ATR=((Prior ATR x 13)+Current TR)/14
Where Prior ATR = Previous 14 day period of the ATR
where Current TR = Most recent Value of the current day ATR
let's take for example if the previous true range of an asset is 2.5 on 14 days and the current TR of the asset is 3.5.
Therefore the ATR = [(2.5 x 13) + 3.5]/14
ATR = (32.5 + 3.5)/14
ATR = 36/14
ATR = 2.5714
Therefore the current ATR = 2.6 (2 s.f)
Question (2)
What do you think is the best setting of the ATR indicator period?
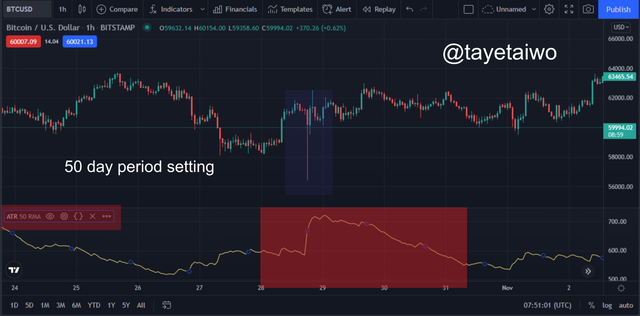
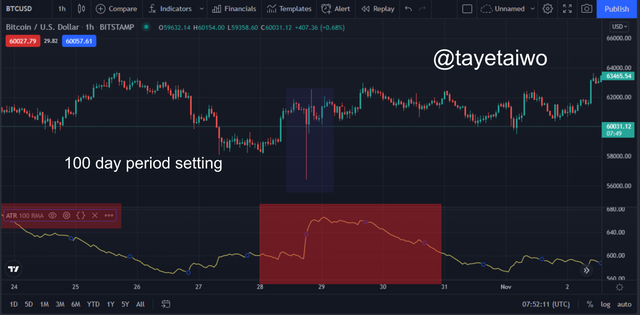
The ATR is a very sensitive indicator this means that it would react to sudden changes that occur within a particular market, but these changes could only be best pronounced based on the period that the user of the ATR has chosen.
The ATR identifies quick upward and downward movements in the market, this means that it can only do this under a short period. Scalper and swing or day traders mostly take into account volatility in the market because that is where they make their most profits due to the quick up and down movements of the price.
Below are images of different ATR periods which I will observe to identify the best result or outcome while they are in use.
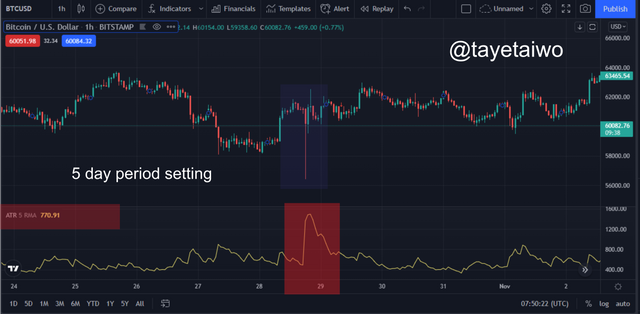
The image above depicts the 5 days setting for the ATR, this image shows that the 5 days setting tends to pronounce the effect of the price movement on the ATR.
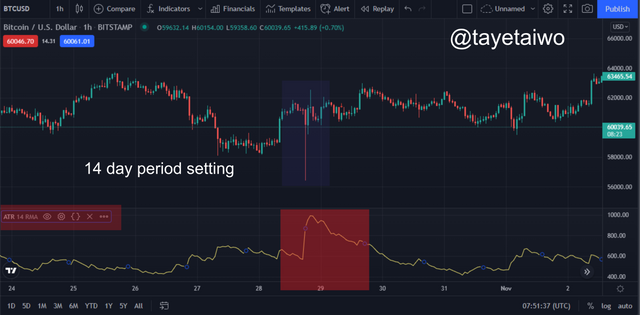
The image above depicts the default 14 day period setting for the ATR, this image shows that the 14 days setting tends to pronounce the effect of volatility a little less than the 5 days movement on the ATR.
The image above depicts the 50 days setting for the ATR, this image shows that the 50 days setting tends to smoothen out the effect of the price movement on the ATR.
The image above depicts the 100 days setting for the ATR, this image shows that the 100 days set tends to almost completely ignore the effect of the price movement on the ATR.
From the images that have been observed above, it is safe to say that the best setting to use the ATR indicator is within the range of the 5 - 14 day period because it identifies the effect of the up and down movements of price on the ATR.
Question (3)
How to read the ATR indicator? And is it better to read it alone or with other tools? If so, show the importance. (Screenshot required)
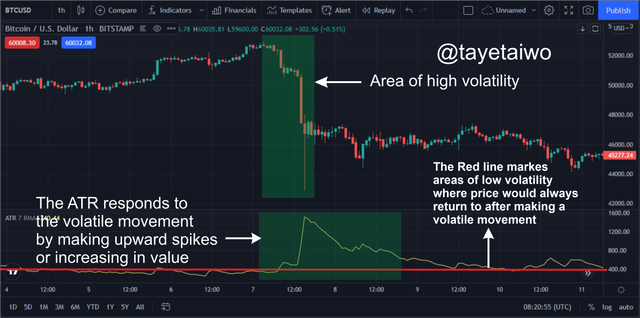
The ATR is not so complex to understand, unlike other Osolisiting indicators. The ATR makes upward spikes in correlation to the volatility of the market, this means it is a repeated cycle in which price will always go back to its area of low volatility.
The image above is the BTC/USDT, here we can see that the ATR indicator can identify the Bearish volatile movement of price on the chart by making upward movement or spike.
However, the repetition of this movement is likely to occur because, after every upward spike in the ATR, it tends to retrace back to a low volatile base movement which I marked with the Redline in the image above.
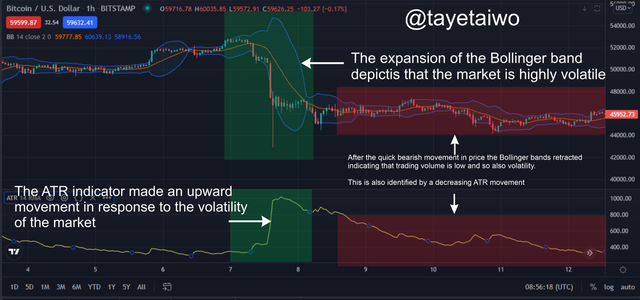
The ATR is a very good indicator when you want to identify entry and exit points and also when you want to set a risk management procedure for a trade, but it is hardly useful to identify the momentum of a trend or the direction in which a trend might take, that is why it is ideal to merge the ATR with other favourable indicators to achieve a better result. for example the Parabolic SAR Bollinger Bands and the CCI Indicator.
The image above shows a combination of the ATR indicator and the Bollinger Bands. From this image, we can see that the Bollinger Band was able to confirm the high volatility in the market by its expansion due to a quick increase in the trading volume of the asset at that period. Also, the ATR confirmed this Volatility by making an upward movement or an increase in value.
The Bollinger Band is also able to identify areas of low Volatility which is a result of a low trading value in the market. this is also verified by a decreasing movement of the ATR.
Therefore it is safe to say that a combination of the ATR and other favourable or corresponding indicators is good because it helps in providing better results.
Question (4)
How to know the price volatility and how one can determine the dominant price force using the ATR indicator? (Screenshot required)
When an asset is been largely bought and sold in a short period it creates the quick up and down movements that are seen on the charts.
The ATR in correlation with price impulse which is depicted on the chart with candles is key to identifying potential volatility in the market. The volatility of price can be identified by the ATR when price makes quick impulse movements. This means when large candlesticks are created the ATR will always respond to them because they signify high volatility in the market.
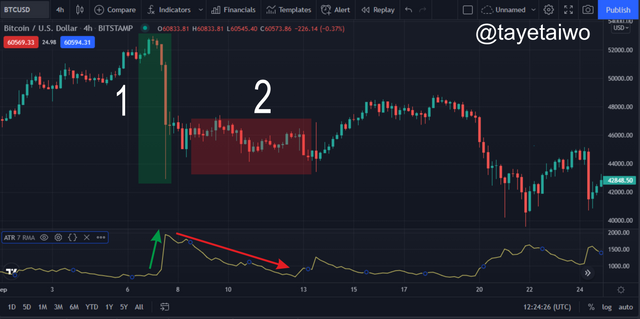
The BTC/USDT chart image above shows an illustration of the ATR indicator. From the Green box(1) the price movement created quick Bearish impulses that were displayed with long bearish candles ( this is as a result of the BTC/USDT being heavily traded over a short period), this was quickly identified by the ATR which then made quick Upward movement or increase in value.
Taking a look at the Red box(2), this was shortly after the quick increase in volatility the price of the crypto asset started to make a sideways movement, this was also identified in the ATR which started to decrease in value or make a downward slide.
The Dominant price force of an asset can be determined by the ATR when the ATR increases in value in correspondence with the Bearish or Bullish impulse of price. This means that before you can say that a particular price movement is dominant it has to be identified by the ATR when the price moves in either direction of the market.
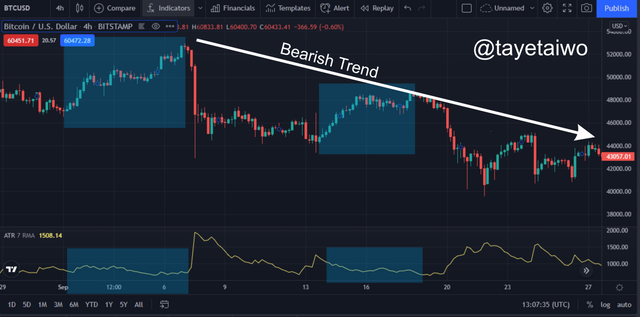
From the BTC/USDT chart above, we can see that from the areas marked with Blue boxes on the chart, they identify a bullish increase in price but this was not identified by the ATR, which means there is not enough dominant force that is driving the price increase.
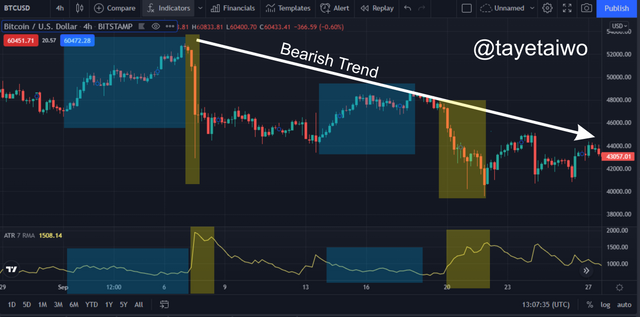
From the BTC/USDT chart above, we can see that from the areas marked with Yellow boxes on the chart, they identify a bearish decrease in price, but in this case, they were identified by the ATR indicator which then made an upward movement or an increase in value, therefore this clearly states that the dominant price force of the BTC/USDT market are sellers, because they keep driving the price of the asset down regardless of the number of buyers in the market.
Question (5)
How to use the ATR indicator to manage trading risk ?(screenshot required)
Risk management is an ideal course that every beginner in trading should take because it is the essential ingredient that is needed to have a successful trade.
The human brain is not naturally wired to have patience, therefore human emotions can play a key role when trading that is where the Risk Management technique is being encouraged to use because it will help eliminate raging emotion depending on when the trader is in profit or loss.
The Financial market do not go to sleep, but this is a problem for the trader because there are other priorities in life other than trading, therefore Risk management is used to control or manage the number of losses or profit a trader can accommodate.
Stop Loss and Take Profit are two-main Risk Management techniques that are used by traders to minimize risk.
The Stop Loss is a market order that is placed so that the trader can automatically exit the market after it goes against their favour. The stop loss is best set not too close and not too far from an executed trade to minimize the amount of loss and also to prevent a quick exit due to the stop-loss order being too close to the executed trade.
The ATR indicator has a formula that is used to identify a potential stop-loss region for trade.
SP = Entry price +/- 3x ATR value
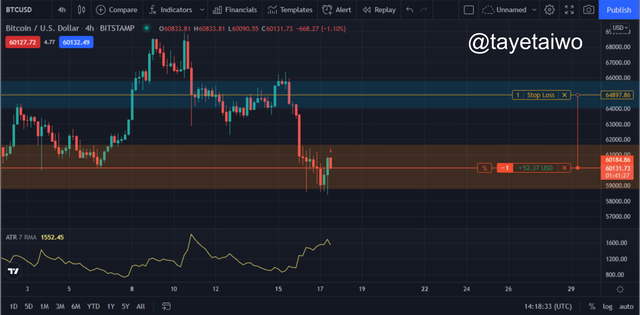
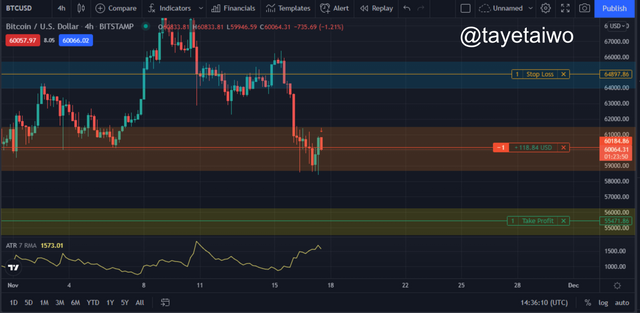
For example, I executed a market order on the BTC/USDT market at $60,184.86 with its current ATR value at 1571. Therefore to calculate the Stoploss for the trade using the SP formula;
SP = $60,184.86 + (3 × 1571)
SP = $60,184.86 + 4713
SP = $64,897.86
Most times when mature traders are in profit their hopes are so high that they throw caution to the wind in hopes that they would become millionaires or billionaires as long as they are profit, this makes them ignore activating the Take profit.
This act of negligence has cost so many traders both amateurs and Pros, that is why it is ideal to make use of Taking profit to eliminate Greed.
Take Profit is a market Order that is set to automatically exit a trade when in the already projected profit zone. It is ideal not to set the take profit at a very high region, because the price of the asset may not be able to reach it, also it is ideal not to set too low to avoid a quick exit from the market.
The same ATR formula which is TP = Entry price +/- 3x ATR value is used in calculating a take profit for an asset
Therefore to calculate the Take profit of the initial trade I executed above is as follows.
TP = $60,184.86 - (3 × 1571)
TP = $60,184.86 - 4713
TP = $55,471.86
The images above show the executed Stoploss and Take profit of the executed market order, this is an amazing feature of the ATR that will indeed help traders identify areas of Taking profit and Stop Loss.
Question (6)
How does this indicator allow us to highlight the strength of a trend and identify any signs of change in the trend itself? (Screenshot required)
The trend is the direction in which the price action takes, it could be in a Bearish or Bullish direction. The ATR alone cannot identify a trend because it only reacts to volatility, therefore to find or identify a trend in the market, the ATR will be merged with the Price Action technique.
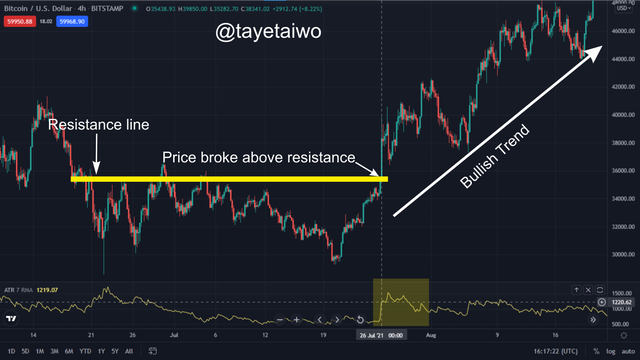
When a price moves in a sideways direction over a long period, the price at this period will constantly hit or bounce off the resistance level. A Breakout is what is on the lookout in either direction of the market and this can only be possible if either side of the traders has more fore at that period in the market, it could be Buyers or sellers.
When there is a breakout of price there is usually a quick impulse in the price movement, this can be reflected by a wide candle moving in either direction of the chart. At this point, the ATR should be able to identify the volatility of the trend is of buys or sellers based on the price action analysis.
The image above shows that of the BTC/USDT chart where there was a breakout of price towards the Bullish trend, this outburst of impulse was reflected by the ATR which made an increase in value and also an increase in an upward direction, thereby verifying the dominant force in price which are buyers based on the volatility in price movement.
Trend reversal is common in the market but it is sometimes hard to identify, but using the ATR in correlation with price action it is possible to identify a trend reversal.
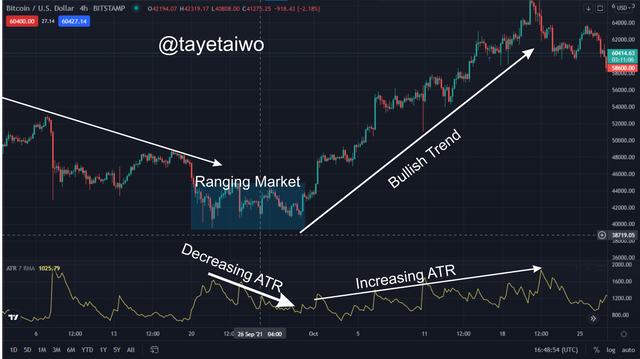
When a particular trend has been exhausted due to lack of buyers or sellers this is reflected by a decreasing ATR, this means that the dominant force that has been pushing the price to move in a certain direction has been exhausted and in a short while, there might be a change to the other direction.
From the image above the Bearish trend switched to a ranging market after the sellers were exhausted in the market, this was identified by the decreasing value of the ATR, this acts as a signal for a potential reversal of price. Shortly after the ranging market, there was a Breakout towards the Bullish trend and this was identified by the increasing value of the ATR.
Question (7)
List the advantages and disadvantages of this indicator
It is easy to understand and less complex for beginners in trading.
The ATR helps traders identify volatility in the market, by reflecting the impulse of Price.
The ATR is a good Risk management tool that helps traders to calculate a safe stop loss and take profit zone. This helps to minimize loss for traders.
It helps traders identify entry points for a trade when merged with other indicators or trading strategies.
The ATR may identify volatility but it cannot predict which direction that the price action might take.
The ATR does not have precise or accurate results.
It does not identify a trend reversal, this means that during a volatile market it cannot accurately tell if the direction of price might change.
The ATR cannot be used alone because it can only identify or provide a limited amount of data, that is why it is ideal to merge it with other indicators
Conclusion
The ATR indicator is a good technical indicator that helps to identify volatility in the market, it also helps in making entry and exit decisions. Risk management in trading is of the essence and the ATR plays a vital role in the identification of stop-loss and takes profit areas, thereby minimizing losses.
It is ideal to note that it is not good to use the ATR as a stand-alone indicator rather is better to merge it with other favourable indicators to achieve a successful result.
Thank you Professor @kouba01 for this great lecture

Hello @tayetaiwo,
Thank you for participating in the 1st Week Crypto Course in its 5th season and for your efforts to complete the suggested tasks, you deserve a Total|9.25/10 rating, according to the following scale:
My review :
Excellent content in which I was able to answer all the questions related to the ATR Indicator with a clear methodology and depth of analysis which is a testament to the outstanding research work you have done.
A brief interpretation of the ATR indicator, but it was possible to rely on a chart to confirm the results obtained in calculating the value of the indicator at the moment t.
The rest of the answers were convincing and clear, with my request for more depth in some points such as how to identify reversal and How to know the price volatility.
Thanks again for your effort, and we look forward to reading your next work.
Sincerely,@kouba01
Thank you so much Professor for this wonderful review.. I can't wait to attend your next class 😃♥️