Steemit Crypto Academy Season 3 Week 7| Home Work Post For @Yousafharoonkhan| How to create an account on TradingView, how to use indicators,tools, features of tradingview

Introduction
This week the 7th offer from the steemit cryptocurrency academy is based on a trading watch platform. Therefore, all class questions will be answered explaining what and how to use tradingview, how to register, what is offered for registration, how to edit charts in tradingview, how to use the indicators within charts and finally we will be able to give an example with a few cryptocurrensets then use my favorite reference as a descriptive example.
NOTE: I want to point out that my purpose is not to make this presentation too long, but to address each motto with all the details related to the most important ones.

Defining the TradingView site and how to register an account on TradingView? What are the different registration plans? (screenshot required)
Tradingview
Tradingview is a trading analysis platform with a variety of tools, features, and services that benefit all traders, whether they are trading stocks, forex, crypto, or anything else. In fact, the platform is not limited to a specific type of trading, but we can find charts, details, and features linked to each type of asset that exists today.
Tradingview is one of the best free trading website available to all from any devices. The platform was launched in September 2011, a platform with unique features and tools that have helped millions of traders make successful trading decisions.
For a newbie, the platform is very easy to use, and the difficulty is reduced. It is also a rich site for experienced retailers.
In addition, It also provides a service that allows us to explore cryptocurrencies, currencies, stocks, indices, bonds, and futures in the market.
How to register an account in TradingView?
The website is usable and easy to use, the basic free option is enough for beginner Tradingview users. Then perhaps after the user has gained some knowledge about Tradingview and has a better understanding of the market, he may choose to opt for other options.
Search on google tradingviewLink
_LI.jpg)
Then click on Start Free Trial in the top right corner of the screen.
_LI.jpg)
A new page will appear, showing the various plans for different levels of objectives, The Free Basic Plan, Pro Plan, Pro + Plan and The Premium Plan.
_LI.jpg)
To sign up for Tradingview using the Free Basic app, scroll down, find and click on Try Free Basic as shown in the image below
_LI.jpg)
There are many options to start the registration process, you can register with Google, Facebook, Twitter, Yahoo, Apple, LinkedIn and email. I prefer email, so I prefer email.
_LI.jpg)
I entered my favorite username, and I entered my email and used a strong password. I keep clicking on the small box to accept the terms and opt out of receiving marketing emails. I confirmed "I'm not a robot" and clicked "Create an account".
_LI.jpg)
A verification link was sent to the email I provided and I opened my email and clicked on the link to activate my account.
_LI.jpg)
I entered my name and surname, and I could decide to include my own photo if I wanted to.
_LI.jpg)
I have successfully signed up for a free account on the Tradingview platform, and I can now access other features that work in the Free Basic program
The Free Basic Plan
Basic Tradingview is free for all programs, allowing the user to access the trading view but with limited functionality and is usually offered within 30 days. This program is free and gives the user new and intuitive information on what the whole platform looks like and is familiar with the right tools. A basic system can allow a user to view and use one chart at a time.
Pro plan
Pro Plan is the most basic plan in the field of paid plans, currently priced at about $ 15 per month and has the advantage that 5 indicators can be used on each chart, no annoying ads, has volume indicators, two (2) charts can be viewed in one window, and you can also find warnings and bar repeats but is still considered a limited strategy since the Pro + system and premium system offer many tools and better services.
Pro + plan
The Pro + program has a value of almost $ 30 per month and has the following advantages for users: it doubles the number of graphs that can be viewed on a single screen (4 graphs), accepts 10 graphs per graph, and avoids ads when conducting technical analysis, with indicators and warnings 100 server. It is a very advanced program in the Pro program as we see that the only thing it offers is the quantity and efficiency of the features of each Pro program.
Premium Plan
In this basic and standard system, it is used by the trader and beginner or new users and the only thing that is wrong is that it sometimes brings notifications that appear on the chart and users do not have access to all the tools.
Each plan can be purchased on a monthly or annual basis. If a full year is paid, a 16% discount on the full amount is offered, which is about 2 months free
Explain the different features of tradingView and what is your favorite feature and why? (Screenshot required)
TradingView incorporates features and operational features that make it a unique trading analysis platform that helps traders make trading decisions in today’s market. I will explain a few of them
Chart
Chart features on the Tradingview platform will allow you to view a couple graphs of any asset, and search for them. On the left side of the chart, you will find many drawing tools, as well as the ability to draw and write on charts. There is also the opportunity to adjust the timing of the charts at the top, as well as to select and apply other indicators in the chart. All of these tools are very beneficial for traders because they enable them to keep track of price patterns and make the best trading decisions needed.
_LI.jpg)
Search
his is the first feature in the trade view to the quick search feature. This gives you a quick search for all digital currency pairs on the trading site.
_LI.jpg)
Screeners
The screen also displays on the market product as shown below: stock screener, forex screener, and crypto screener. This can be used to filter stock based on your pre-defined settings. It can look at all available stocks to find what fits exactly what the user likes.
_LI.jpg)
Market
Like our general market, when we have a variety, the market feature reflects all the products available on the trading platform
_LI.jpg)
Community
This shows the various communities found in the trading view, where any trader can join to learn and demonstrate his expertise in trading. In the main market view, we have a series of drawing tools on the left side of the screen that the user can explore, and on the left, we have a list of user preferences tools such as alarm, calendar, public and private chat, notification, etc.
_LI.jpg)
Watchlist
The watch list gives you the display of tokens that you have placed under scrutiny, instead of going through a solid search rate, your tokens can be viewed in the watch list.
_LI.jpg)
#My favourite feature of the TradingView and Why?
My favorite feature is the charts
This is the basis for the overall trading experience, digital currency trading is very important for predicting price. However, a lot of speculation and speculation is made by looking at other parameters included in the conversation, for example moving averages usually 50 shots and 200 moving averages longer than something they say about market trends and this informs the seller what the next is.
Another popular feature is the indicator / device feature, which allows the user to quickly insert pre-configured indicators. This makes the site easy to use especially for those new users who can use the drawing and other useful tools available.
In addition, the Chart allows me to draw a line, and this I can use to draw a support line and resist any asset pairs. With the help of the index I can easily predict the next trend in the stock and this will help me to make better trading decisions
How to set up a chart in TradingView and use two tools to edit it.(screenshot necessary)
Setting up a chart in a trading view is easy and not a good way to do it, it is just a matter of going to the suspension stage in the chart area where technical analysis is done and setting colors, parameters, styles, characters, size among others.
Set chart symbols
One of the things we can fix is the graphics. For this we have to go to the tradingview and click on it when it says "Chart".
_LI.jpg)
After that you have to press the top button on the right. The button has a gear shape and is a settings button.
_LI.jpg)
After that, we will be inside the graph setting and see that on the left side we can select what we want to edit normally. We select when it says "Symbol" and we see that we can set the body, edges and string of the graph.
The body is a complement to the volume volume bars, we can remove it from this adjustment if we want and change its default green and red colors.
The border is literally the body border of the graph and is colored green and red.
The strings are a nice addition to the pictures in each volume bar on the graph.
And the price line is a horizontal line currently set
_LI.jpg)
Next, let's look at an example of a graph if we decide to remove the strings and body from it.
_LI.jpg)
Scales
another option in the chart setting, where you can decide to show or hide some labels by just ticking the box, labels such as financial name, symbol name, last price and more.
_LI.jpg)
Appearance
Appearance is an option in the Chart setting, here you can edit the background format, and customize its color, we can continue to change the text and color size, horizontal and vertical grid lines, and navigation buttons.
_LI.jpg)
How to use Two tools to edit the Chart
In this activity, I will use two different tools on the chart and will show you how to use them with tool functions. The tools are Trend Line and Text
Trend Line
This tool is used to draw lines on charts, is most commonly used to draw support and resistance points or to show any patterns of inclination on the chart.
To use this, go to the Tradingview website and find the Chart, on the left to find the Trend Line tool.
_LI.jpg)
After that I scroll to where I want to draw, for example I will be drawing a resistance line on the BTC / USD chart. When I get to a point I click and drag it that will determine the length of the line. Additionally you can change the color and weight of the line
_LI.jpg)
From the screenshot above, I draw a resistance line on the BTC / USD chart and turn the color blue,
Text
This is another tool in the chart section, with these tools you can write anything on the chart, and you can customize the text size, font and color.
_LI.jpg)
To add text to your chart, navigate to the left side of the page, find an icon in the text tool T, enter text your favorite text, and you can adjust the size, font and color.
.png)
From the screenshot above, I added my Steemit username and changed the font and color I liked.
How do we add an indicator on the chart and what is my favorite indicator?
Indicators provide the trader with market information, help traders know the trend and pattern of the asset, this can be used to predict the next movement of the asset if used properly and helps traders make better trading decisions. I will show you how to include the Moving Average Indicator on the BTC / USD chart
In the chart, navigate up and find and click on fx Indicator.
_LI.jpg)
Search for your preferred index, because I enter Moving Rate, search for MA and double-click it to enter two intermediate submissions
_LI.jpg)
For the two Active Travel Indicators to work properly we must prepare them, I will be adjusting MA 1 and MA 2 for easy access.
.png)
Click on MA 1 (first MA) and select the settings icon to configure it. The MA 1 is a short range measurement line, so I go to the input option and change the length to 50, then I go to the Style section and change the color to blue this will help me see it easily.
.png)
.png)
Now in MA 2 (second MA), click on it and choose to set the icon to set it up, this is a long-distance navigation line so I go to the installation phase and change the length to 200, then go to the style section and change the color to red this will help me I saw the line easily.
.png)
Do you think TradingView is useful for predicting the cryptocurrency market (trend / price)?
I believe trading views are a very useful page for predicting world market prices and prices with the help of indicators and tools. The key to it all is to do a good technical analysis and tradingview has all the tools to work comfortably and effectively within the chart. In addition to this, you can have predictions of global market conditions, unaware of the best sellers and rewards, you can enter the public domain to get news, details, comments and opinions from all businesses and global traders.
Among other things, tradingview is a widely used platform to perform technical analysis of cryptocurrency assets and two, world markets and more. For this reason I firmly believe that it is very useful, firstly because of its popularity and secondly because of its good results and tools.
Conclusion
The topic of discussion was a trade view and we found that trading trading is a very important tool for predicting the cryptocurrency market and stock prices and The site is rich in tools and feature that can make it a good one for users. Many retailers have found it very useful for beginners and advanced traders. Beginners have the right to be taught by prospective vendors who have been in cryptocurrensis for a while.
Digital currency pricing estimates are more accurate when looking at charts and trading views give its users subscriptions, if you sign up, they are given a free 30-day time to know the tools and features even though there is limited access but you can be given more access according to your subscription.
what is your relation with these accounts, transaction show that you are receiving,,
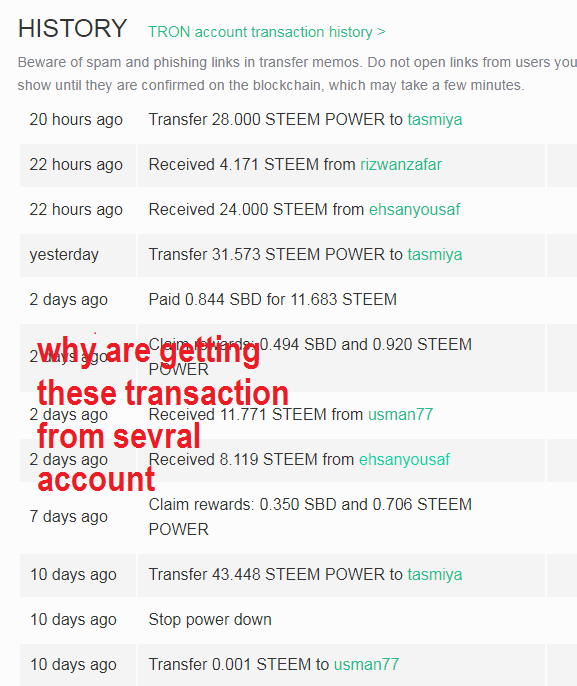
I bought some steem these accounts
Pleased sir grade my post