Steemit Crypto Academy Season 2-Week 8 | Cryptocurrency Trading with Bollinger Bands | By @syedmraza01
Assalamualaikum,
Hello and welcome everyone on my homework post which describes all about Bollinger Bands and this homework is given by professor @kouba01. So let's get started,

Define the Bollinger Bands indicator by explaining its calculation method, how does it work? and what is the best Bollinger Band setup?
Bollinger bands was invented by John Bollinger in 1980 at that time the sole purpose of this indicator is to read the volatility and formality of stocks in stock market and now it is also used in Crypto market as well.
These bands are the statistical plot of prices and volatility of market in a measured time frame and trends can be known through its support and resistance levels.
The Bollinger band consists of three lines,
- Upper line
- Middle line
- Lower line
The Upper line is also known as upper band, whereas, middle line known as middle band and lower line known as lower band.
Calculations
Bollinger Band by default use 20 day moving average to determine all the possibilities, this means it uses last 20 Candlesticks to determine the volatility and space of market,
Whereas the formula of finding moving average is given as,
Moving Average = Sum of prices over x days/number of days
There X can be number of days a trader may use it can either be 20 , 10 or 50 as wanted.
The other parameter for bollinger band is Standard Deviation, like for 20 day picture the system use 2 standard deviation whereas, for 10 day it uses 1.5 standard deviation and for 50 day it uses 2.5 standard deviation.
Calculation Of Bands
- The upper band is calculated by adding 2 standard deviation in moving average.
- The lower band is calculated by subtracting 2 standard deviation from moving average.
Best Bollinger Band setup
Now I am going to tell you that how to add Bollinger band on your chart and for this purpose I used Binance trading website because I also like it personally and use it by myself.
- First we have to open Binance trading website.
- Then go on trade and click on classic then chart will appear on your screen.
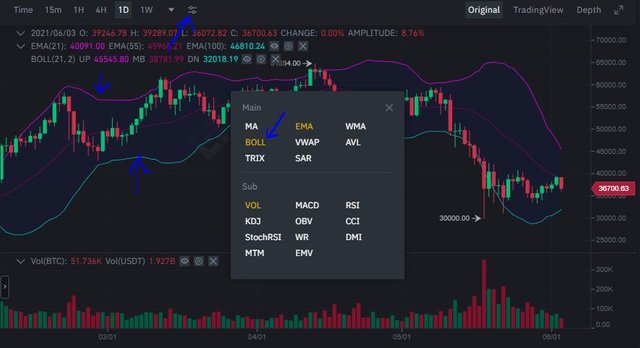
- Then you have to click on indicator option on the top of chart and then all indicators will open as shown in first screenshot.
- Then you have to click on Boll in the screen and Bollinger Band will appear on your chart.
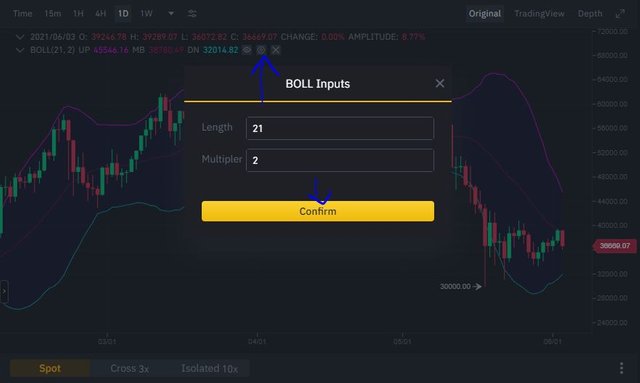
- If you want to open its settings you have to click on setting icon on Bollinger bands and a screen appears where time frame of 20 is set by default and 2 standard deviation is used there.
Screenshot 1
Screenshot 2
What is a breakout and how do you determine it? (Screenshot required)
Breakout is occur when market behave unusual or it breaks the trend market following.
In Bollinger bands market breakout can be determined when the candles broke out the upper and lower bands and form out from the bands because in bollinger bands the price of normal market is always between the upper and lower lines.
We can also know it through the support and resistance levels formed outside the bands.
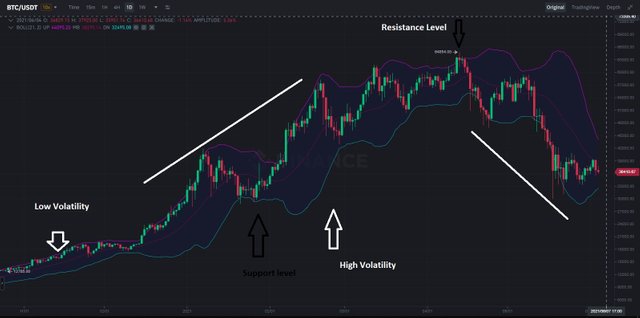
Now I have taken BTC/USDT pair to show working of Bollinger bands in breakout. I have taken BTC/USDT pair because of its market capital and its influence so that we can get a better view of this,
First of all you can see that this coin has very low volatility as shown by bollinger bands and it was in a stable state
Afterwards just before the start of 2021 it crosses the upper band forming a support candle outside the band that indicates a positive signal in the market and price started to risen up and also the volatility of market this means that traders started giving their money to the market.
When the candles go out through the bands they forms either supportive or resistive situations which helps in predicting the future of it.
You can also see that when resistive level forms after breakout the market follows a bearish trend and you can see that there was also great volatility, the reason is that many traders trying their part to get out from the market because of its constant decreasing factor.
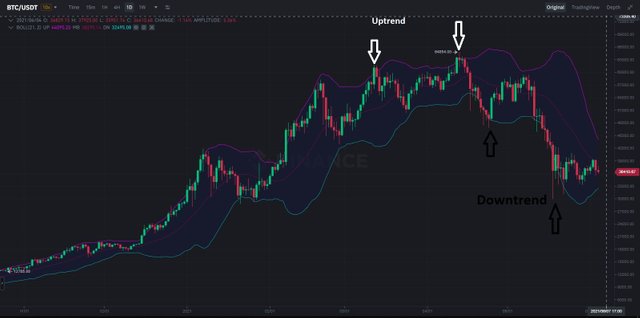
You can also see that when breakout occur in Jan 2021 there was a price reversal trend formed and price started to risen up . Similarly, after the April of 2021 breakout prices continuously followed a downtrend due to price reversal.
The breakout pattern in Bollinger bands is very effective and highly predictable as we have examine earlier due to which we are able to make better predictions through it.
How to use Bollinger bands with a trending market? (screenshot required)
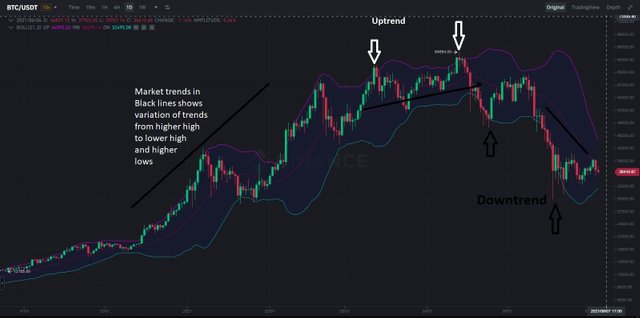
Before taking a dip into it we first analyze about what is a trending market? Trending market is of two type either it is Uptrend or downtrend.
- Uptrend in which market is in overbought region which means that any time it can follow a trend reversal so good interaction with technical analysis helps get more and more profit in this situation,
- In downtrend the market is in oversold region that time traders wants to invest more and more in it to gain afterwards.
Whereas, sometimes market remains in overbought and oversold region for so long that it forms a traumatic condition in traders at that moment a good interaction and analysis can give you higher profits.
As the candles touch the bands from lower side it will effect market mostly in bullish trend and price hikes up forming a support in the lower region of band. However, Traders have different styles of trading many doesn't prefer default style whereas I have setup default setting with 2 standard deviations in 2o days time frame which gives a realistic view of market.
Keep in mind about the reversal of trends where many times market took a continue exposure of any one trend either uptrend or downtrend so always look for the right time to buy if not then loss is always waiting for you.
What is the best indicator to use with Bollinger Bands to make your trade more meaningful? (Screenshot required)
Talking about Indicators I always try to make use of them as much as possible in my trading because there is nothing enough but we have to look into every single small object to save from any loss.
Bollinger bands are itself very effective but I also uses RSI and MACD together because I learnt them in previous lectures and they are very useful. With Bollinger Bands I tried both MACD and RSI and I felt that MACD indicator is more durable with Bollinger Bands.
Why MACD?
MACD indicator itself contains different indicators in itself which are zero line on which bricks form below or upper showing the trend of market and also have a MACD line with signal line which helps in predicting the future of market.
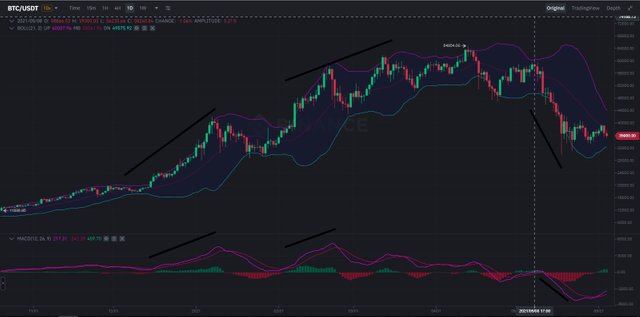
As you can see in above screenshot that whenever bollinger band gave the signal of uptrend MACD indicates the same and approves the result. However, you can also notice the variation of predictibility in both indicators that they almost produce same result but of course they are different in calculations and other aspects.
So the continuous result produce the meaning in trading at a point and trader seems more confident with it.
What timeframe do the Bollinger Bands work best on?And why? (Screenshots required)
Although, The Bollinger band works great in all time frames, For the one who is in search of quick profits they should be focusing more on from 1/2hours and a minimum of 15 minutes charts, and likewise, the Bollinger band will be set on the hours time frame, As you can see the pair showing an uptrend in a short timeframe(1hr)
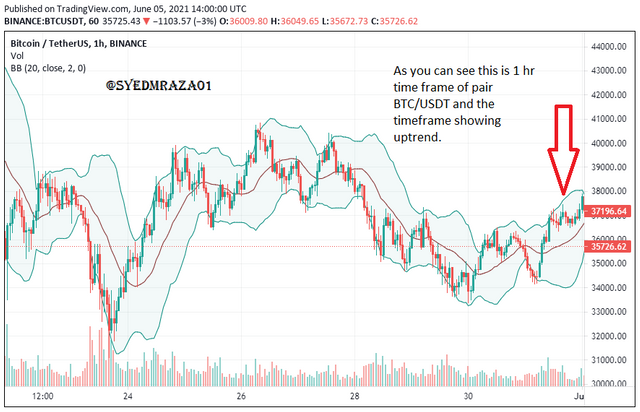
While, On the other hand, there are many people who use daily, weekly time frames, and the Bollinger band will be adjusted at any time frame to get the observations more accurately, and is preferable also:
In the end, I would say that if you want effective Trading signals, Daily and weekly timeframes are more preferable as you can see an overall view of uptrends and downtrends.
Review the chart of any pair and present the various signals giving by the indicator Bollinger Bands. (Screenshot required)
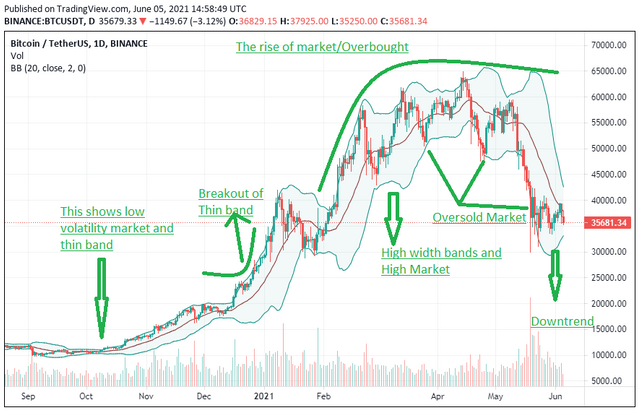
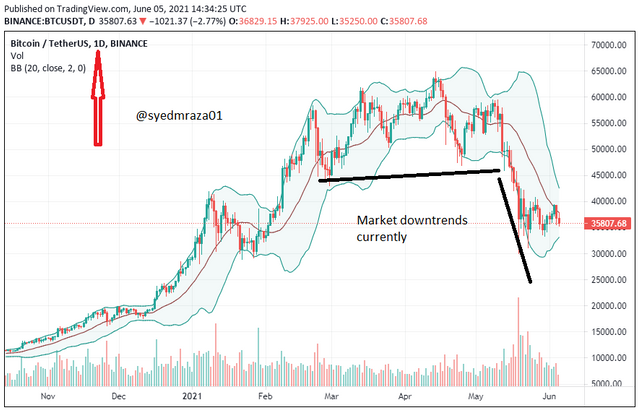
As you see in the above Screenshot I have chosen the pair of BTC/USDT and In the 1-day timeframe, I chose the indicator of Bollinger Bands.
In the 1st phase of the market, you can see a small thin band with low volatility to Approximately December and in the mid-December, you can see there is a breakout in the market of Bitcoin which automatically uptrend the market into bullish.
After the high rise of the Market, you can see the High widths of bands which shows the high volatility of the market apart from the high volatility, you can observe the overbought market and which also uptrends the market for a short period, After a high bought, People in search of profit started to sell off their bitcoins which ultimately caused the oversold and made the market bearish and downgraded the prize of bitcoin.
Conclusion
To conclude all of the above I can say that Bollinger band is no doubt a very helpful and easy to use technical indicator which make technical analysis more easy and accurate. I also want to add that always use technical indicators in a combo so that you may get better result and low chances of failure.
That's all from my part I hope that you all like it.
I also wanted to thank @cryptoacademy for these courses and Professor @kouba01 for this amazing lecture and their dedication towards it.
Hello @syedmraza01,
Thank you for participating in the 8th Week Crypto Course in its second season and for your efforts to complete the suggested tasks, you deserve an 8/10 rating, according to the following scale:
My review :
Good content, in general, where you tried to get as close to the right answer as possible, and I was mostly satisfied. The last question requires more interpretation of the signals and tracking the price movement of the pair.
Thanks again for your effort, and we look forward to reading your next work.
Sincerely,@kouba01
Thanks for the response. I will make sure to perform better ahead.