Crypto Academy Week 14 - Homework Post for professor @Kouba01 | By @syedmraza01
Assalamualaikum,
Hello and Greetings to everyone. I hope that you are doing well. Today I am writing my homework in which I describe MACD indicator briefly and it was given by Professor @kouba01. I hope that you like it so let's get started,

What is the MACD indicator simply? Is the MACD Indicator Good for Trading Cryptocurrencies? Which is better, MACD or RSI?
The Moving Average Convergence Divergence (MACD) a technical indicator just like RSI which we were discussed in last class. It is also a momentum oscillator indicator used to know about the trends of any cryptocurrency or assets in the market.
Relatively MACD comprises of other indicators as well to make it more accurate, better and able to understand. It contains signal line, zero line and Histogram.
Histogram is the boxes (in green and red in below screenshot) present at the center and they move up and down with MACD line.
Signal line is the result of 9 day of EMA regulations throughout as set by the user and it is proceeds with MACD line (purple color), it helps to directly indicates the bullish or bearish trends by looking at MACD line, either it is below or above the signal line.
Zero line is at the center of boxes of Histogram on which different boxes formed in the upper and lower portion.

MACD indicator: Good?
Everything in this world was either invented or discovered and it is somehow help this world to grow more. MACD indicator is no doubt a sufficient tool in trading market which help indicates the trends of it and it is really helpful for investors, whereas, many predictions may possibly got wrong due to many circumstances so it is also. But it is a really helpful tool provide by mathematicians. I will elaborate it further in this article about its wellbeing.
Who is BETTER: RSI or MACD
As I said earlier that these indicators were made to make trading more easy and rapid. Although if we talk about to compare them both then we must have to first dig into it,

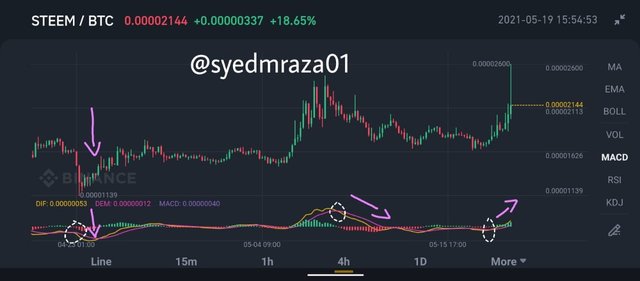
This is the chart of STEEM/BTC coin and if we have to look it for technical analysis we took these two indicators RSI and MACD, Let's look what they are telling us right now,
In this 4 hour chart, you can have a look at RSI indicator which shows us that Steem has recently touched its highest point and now heading backwards following a bearish trend and through this I conclude that, YES! Steem will follow bearish trend.
Similarly, if we look at MACD the first thing we notice about the action of boxes at zero line where we can see that it is at above point of zero line and still standing at the highest point, Although, when we look at the MACD line and signal line we saw that MACD line is below signal line which means that it might face bearish trends as told by MACD line.
So question arises I took a completely same signal from both indicators so who will be Better?
- First thing is that, it is more likely that most indicators give same signals.
- But we have to look for more accurate one. In this sense I can say that RSI is much easier to study but MACD provides more ingeneous and more feasible results through its lining and its zero line.
Note: I am just a student so it is very likely that I might make any mistake in reading graph. Forbid and correct me if any.
How to add the MACD indicator to the chart, what are its settings, and ways to benefit from them? (Screenshot required)
There are so many trading apps through you can trade or can see live charts of crypto currencies. I preferably use Binance as my trading app and wallet. Here are some steps to add MACD indicator to the chart.
At first you have to open your Binance App, I use in Smartphone because it is more easy to use there.
You have to click on trade icon at the bottom center of screen, then you have to click on graph icon marked by yellow circle in below screenshot.
.jpeg)
- If you click on MACD option as marked in below screenshot the indicator will open and if you have to change its setting then click on setting option marked by blue circle.

- After you clicked there a bar is opened where other options as well as indicators available, you have to click on indicators.
.jpeg)
- Now Index settings open up where all indicators are present as well as MACD you have to click on MACD.
.jpeg)
- Now you can see different options available for colors, values and boldness, we must have set them as our wish. In my account it is set as default.
.jpeg)
- when you came back and click on MACD the indicator will open there, i hope you will understand it.

Trading Strategies By Using Signal Line And Zero Line
We can direct our trading strategies by using other indicators that also uses with MACD line so that we can gain a more accurate and absolute awareness about the future.
MACD and Signal Line:
Macd and Signal line has a very easy relation through which you can make assumptions about future trading.
- When Macd line crosses signal line from below to uper i.e in below Screenshot you can see at lower circle then the chart follow bullish trend.
- When Macd line crosses signal line from upper to below level i.e the upper circle then it is more likely that it follows bearish trend.

MACD and Zero line
- When the line of Macd is above the zero line then this shows uptrend and possible bullish trend.
- Whereas when the line of Macd is below the zero line then this shows downward trend or bearish trend.
Detect a Trend by using MACD
All of the indicators used in crypto trading has one main object of detecting the trend. MACD indicator also uses to direct trends for future pricing and help traders.

As you can see in this screenshot pf TRX/USDT coin, that how much the trend changes with time to time.
- If we find trends of this coin by using MACD indicator, we can see that in early portion the line of MACD is always below zero line which indicates bearish trend and you can see that the price of TRX fall to lower-low point.
- Then you can see a white line in chart which shows uptrend, whereas, MACD line also surpasses above zero line indicating bullish region.
- Ahead you can see another uptrend when green color bricks formed on the zero line in upward direction which is also a sign of uptrend.
- Then the whole line of TRX became to fell down and MACD line went below zero line and a continuous down trend is going on till date.
False Trends:
Although nothing is quite good enough or 100% everything must contain flaws in it.
You can also find difference of predictions between indicators and charts sometimes and it may result in a wrong prediction. This phenomenon is supported by divergence in trends which are of two types,
- Bullish Divergence
- Bearish Divergence
Bullish Divergence

source
In the upper image you can see that in the graph the price of asset is falling whereas in MACD indicator it indicates that the price is going upward that particular divergence in result is known as Bullish Divergence.
Bearish Divergence
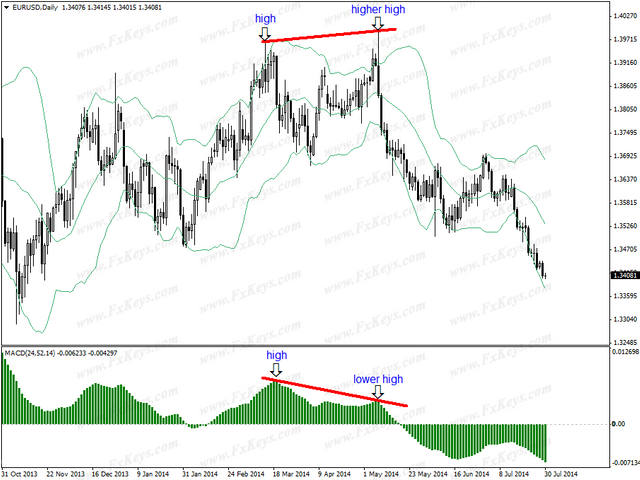
source
In the above picture you can easily see that in graph of asset the price is increases from high to higher-high point whereas MACD indicates a price from high to lower-high. This type of divergence is known as Bearish Divergence.
Support Or Resistance
Resistance and Supports are the factors that every person who want to invest in any crypto currency should know about it.
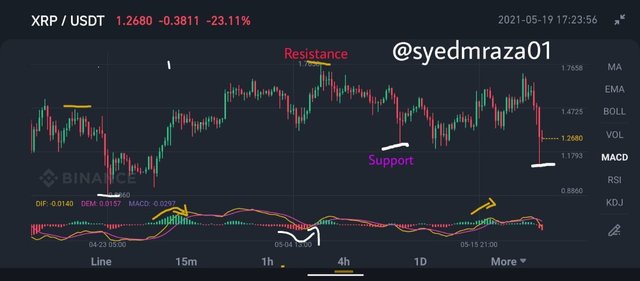
Support is the point where the prices stop falling and started to arose from that point or we can see a surge in the prices after that point.
Resistance is the point after which it is more likely that price will decline and increase in the prices may stop.
A important thing is that we can somehow not able to make right predictions because it is not always follow what it seems to be so you must have to be careful when giving the predictions after looking at resistance and supports.
Review the chart of any pair and present the various signals from the MACD. (Screenshot required)
For this question I have chosen DOGE/BTC coin and I review it also with the help of MACD.
As you can see in the chart that the price is very stable a month ago and MACD also not suggest any change in pricing however it shows first buy sign( circled below in Macd indicator) when MACD line crosses zero line above of it this means a positive trend will start and it will.
Then it indicates a sell region when you see in MACD graph it has shown a decline in uptrend.
In the purple circle it again gave an uptrend signal where we should buy it. Then the price is in a stable state until the MACD cut the signal line and started going below and it indicates a downtrend and it is showing that price will further moves low and I think you have to wait some more time in order to invest in it because it will go more down.
Conclusion
From this homework we conclude that if someone wants to completely and professionally invest and earn through crypto currencies and he has first learn about all the basic indicators and other techniques.
MACD is surely a great tool helping investors for future. But we have not to put our 100% faith in it that only MACD is enough. There are also other indicators you must have to learn about which are surely helpful.
At last I want to thank Professor @kouba01 for this topic that we have learn about and also @cryptoacademy for organizing such amazing courses at this platform.
Hi @seydmraza01
Thanks for your participation in the Steemit Crypto Academy
Feedback
This is just average work done. Kindly put more effort into your work. More clarity is needed in your explanations.
Homework task
5
Thank you for your response. Your suggestions are very appreciable. I will try to put every inch of effort ahead.