Strategy and use of Donchian Channels - Crypto Academy / S5W1 - Homework post for @ lenonmc21
Hello Steemit!
Here is my homework post for Professor @lenonmc21. This is undoubtedly a great lesson, and it increased my knowledge at all, let's start with the post.
.png)

1.) Explain and define in your own words what the Donchian Channels are?
An indicator devised by a renowned derivatives trader called Richard Donchian is known as the Donchian channel. To calculate the high, low, and median values of a stock or other asset over a specified period, the indicator uses moving averages. Indicators collect this data and may be used by traders to make trading choices based on it.
Investors often utilize Donchian channels to evaluate an asset's support and resistance levels, as well as its breakout and breakdown points, as well as current and emerging trends. It is possible to compare the Donchian indicator to the Bollinger Bands in a superficial fashion.
Are you familiar with Donchian channel indicators?
Here are some examples of the Donchian indicator in action to show you how it works and what it may tell you about a stock.
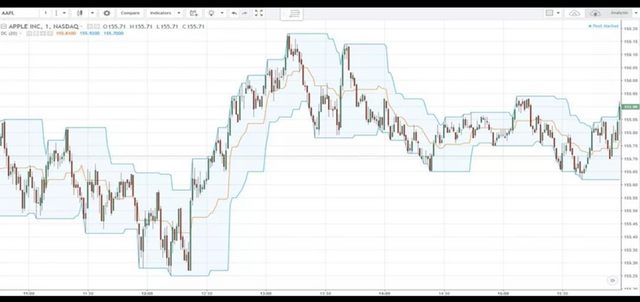
For 20 days, here's a 1-month Nifty 50 chart that clearly shows the Donchian channels. Using the Donchian indicator is quite flexible, and you may tailor it to suit your own trading needs.
Donchian channel indication may be seen in the blue area shown in the screenshot. Each channel has a separate function and a different set of parameters, yet they all work together. There is a blue highlight for the top and bottom channels and an orange highlight for the central channel.
Donchian channels' top channel represents the asset's greatest price during the selected period, which in this example is 20 days. As with the Donchian indicator, the lower channel represents the asset's lowest price throughout the period. As its name suggests, here is where the middle channel comes into play; it's the average of the upper and lower channels.
How do Donchian channels work?
On Donchian channels, three distinct bands indicate the current market movement. The upper band represents the highest high of the previous period, the lower band represents the lowest low of the previous period, and the middle band indicates the average high and low of the current period.
At any one time, investors may establish either a long or short position in an underlying market by using Donchian channels as a means of tracking the market's movement.
There may not be a clear overall bullish or bearish trend if an asset is trading in the center of the range with no significant departures toward the upper or lower band.
However, traders may utilize this information to initiate a long position and benefit from the market's growing value if the market is going toward the upper band. To benefit from a market decline, a trader would initiate a short position if market momentum is presently going towards the lower band.
Is there a way to trade using the Donchian indicator?
The Donchian channels can be utilized to detect breakouts and breakdowns. Therefore we'll go even farther into this notion and discover how.
● Scenario 1: Breakout
To spot an impending breakout trend, keep a watch on the Donchian channel indicator's upper channel. When an asset's price reaches or nears the upper channel, a breakout is considered progress. In this image, you can see that the asset's price reaches the top channel of the indicator, which then starts a new uptrend.
Traders refer to this position as the "breakout point," and it should be the point of entry. Consider waiting until after the breakout point has been reached before entering a long position. This way, you can guarantee that the trend has cemented.
● Scenario 2: The system fails.
A breakdown trend may be properly predicted by keeping a watch on the lower Donchian channel. When the price of an asset approaches or crosses the bottom channel of the Donchian indicator, a breakdown is considered possible. According to this image, this is true. In the photo, the first two candles are visible. There is a distinct difference in how close each of the two candles is to the bottom channel. As soon as the price drops into the lower channel, a new downward trend in the asset price begins.
As a result, the 'Breakdown point,' as traders know it, is when investors should look to enter the market. After the breakdown point, always keep an eye on the candles that emerge on the scene. This way, you'll be on the safe side of things if you wait until the trend has been established before entering a fresh short position.
2.) Does it explain in detail how Donchian Channels are calculated (without copying and pasting from the internet)?
Indicator calculation is simple enough for even complete novices to grasp.
How many periods you want to utilize usually affects the procedure. Traders often use a 20-day window. This is how the indicator will appear if we use it as an example.
● The 20-Day Low – Lower Channel
● This is the 20-day high for the upper channel
● The middle channel is defined as the sum of the 20-day high and 20-day low.
The formula is straightforward. In the top channel, you must choose the most expensive price over the specified period. For the bottom one, you choose the cheapest option at that time. The center channel is the sum of the two. Chart the findings once you've done the math.
The current price bar is not included in the computation of the indicator. Throughout 20 candlesticks, if you apply the indicator to that period, the bands are generated and shown depending on the preceding candlesticks.
Suppose a trader is utilizing a one-minute chart, and the stock price has risen to $125.50 in the previous 20 minutes, and the trader wants to see whether the stock price will rise or fall. It was $125 at the lowest point in the final 20 minutes. A line will be drawn at $125.50 on the indicator, with a line at $125 being the lower limit. When a mid-band is included, the price is calculated to be $125.25.
3.) Does it explain in detail how Donchian Channels are calculated (without copying and pasting from the internet)?
Advantages
The Donchian channel has proved itself to be a valuable trading signal in terms of its capacity to spot market volatility and construct a price range that encompasses the highs and lows of a specific period.
There is a constrained range and little profit possibilities for day traders when asset values remain steady.
During periods of more market volatility, Donchian Channel readings tend to expand, and this sort of situation is ideal for both short- and long-term trading profits (bullish and bearish).
As a result, traders may employ Donchian Channels in various ways to build long and short positions based on the overall market trajectory.
Disdvantages
It should also be noted that the global economy is subject to the same financial cycles that affect markets throughout the world.
It is possible that the precise time values utilized to draw a Donchian Channel on a technical analysis trading platform may not accurately represent market realities.
When this is the case, it is more likely that the Donchian Channel will create misleading trade signals that can restrict profits and weaken trading success in the near run.
Interpretation
When an asset price "breaks out" of the upper and lower price bands, Donchian Channel analysis plays an important role.
Volatility may be seen as a difference between the high and low bars. For turbulent markets, this gap will widen even further between these two lines. An asset's volatility indicates that it often fluctuates and with a wide range of changes in value. If there is less volatility, the lines will be closer together. An asset's volatility is defined as the degree to which its value changes throughout a certain period.
There has been a significant change in the market's current direction with the aforementioned "breakouts." When looking at a price point on your chart, you'll see what everyone else is thinking about. "breakouts" are common in the market because traders are constantly looking for new trends that may be profitably exploited immediately.
Donchian Channel's position may also be a useful indicator of the state of the market. When a price falls below a Donchian Channel Is lower and upper bands, it reveals the market's psychological makeup. This is a list of the four locations:
● Breaking the bottom band marks the start of a decline (a period of low demand and falling prices).
● Price breaking above the top band may signal the beginning of an uptrend. This shows that the asset's price and demand are both growing.
● If the price falls between the lower and middle bands, traders may anticipate a recovery or breakout from the bottom band.
● It is feasible for traders to predict the breakout or reversal from a price range between the middle and upper band.
You may utilize the chart's price position and direction to make trading decisions and strategy choices. It is improbable that the stock will go below or climb above them regardless of the market. There are two types of resistance and support: price ceilings and price floors.
Practice (Remember to use your own images and put your username)
1) Make 1 inning using the "Donchian Channel Breakout Strategy" and make 1 inning using the "Reversal and Retracement Strategy" . You must explain the step by step of how you analyzed to take your entry and make them into a demo account so I can evaluate how the operation was taken.
Breakout Strategy
For this question, I will be using ETH/USDT. I looked for candles sticking to the upper bands. I found them and when I saw that a few candles are sticking to the Upperbans, I knew that they indicated a strong bullish trend so I decided to take my entry there.
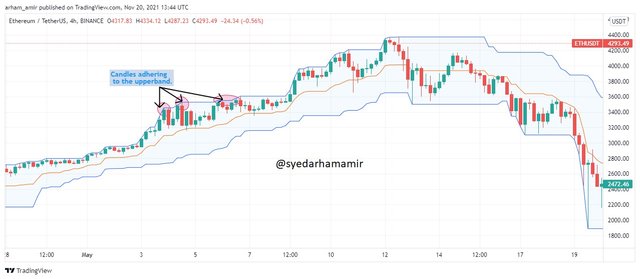
After that, I looked for an exit point. I waited till the price came down the Mid Range band as, in this scenario, this would indicate a bearish movement. I found the candestick crossing the Mid Range so I made it my exit point
.jpeg)
This was my final trade setup.
.jpeg)
"Reversal Strategy"
For this strategy, we have to keep our eye on the Mid Range band. So I looked for candlesticks crossing the Mid Range band and going into a bullish direction. I found one and made it my entry point.
.jpeg)
Similarly to exit we have to keep our eye on the price action and notice when it crosses the moving average again. I found the point and exit from the market there to avoid any loss.
.jpeg)
This was my trade setup
.jpeg)
Conclusion
An asset's price changes may be seen clearly by looking at the Donchian channel indicator's graphs, which are simple to read and understand. You don't need to do much more than going to your chosen charting app, choose the asset, and select the period for which you need the Donchian indicator. Using the indicator's specific algorithms, the program would automatically map the channels for you."
● It is a Donchian channel indicator for trend trading
● There are two bands, one on each side of the central line, used to indicate bearish and bullish reversals.
● It is determined from the maximum high of the past n periods to determine the top band.
● It is determined using the lowest lows in the past n periods to determine the lower band.
● For the centerline, current upper and lower bands are averaged together to get the middle line.
As a general rule of thumb, the Donchian Channel indicator is utilized to detect market swing reversals.
Donchian Channels have the best success rates when individual price swings are strong enough to indicate that an asset is substantially overbought or oversold.
As a result, Donchian Channels are useful for traders seeking fresh d movements in their early phases.
Thank you professor @lenonmc21 for this amazing Lesson.
@lenonmc21
@lenonmc21