[ Crypto Trading by Identifying Support and Resistance ]-Steemit Crypto Academy | S6W3 | Homework Post for @shemul21
Hey Steemit!
Here is my homework post for Professor @shemul21. It was a great lesson, and I hope you will enjoy reading my post.


Prior to actually executing any trade order, buyers and sellers should be able to discern all support and resistance lines on a chart using technical analysis. Traders often utilise these support or resistance zones to conduct historical research and then forecast future asset prices. They usually accomplish this by creating horizontal lines on a chart, or by drawing up and down trendlines. Traders may also use Fibonacci retracement to draw these zones on a chart.
These support or resistance zones normally operate as barriers, stopping asset values from being pushed farther in a certain direction, and they also allow traders to seek for potential trading at the precise locations where an asset's price will have to reverse.
The low range of an asset's price that acts as support since it hasn't yet been broken by a higher range that acts as resistance is known to as the support zone. Due to the large concentration of demand in this area, the support is projected to stall for a while. When the price of the asset struggles to break and fall below the zones, the asset's direction changes.
There is generally a lot of purchasing pressure (demand) at a support level, which causes the markets to oppose at that point by driving the asset's price higher.
The higher range of an asset's price that acts as resistance since it hasn't been broken by a lower range that acts as support is known to as the resistance zone. Due to the significant concentration of supply in this area, the resistance is likely to take a breather. When the price of the asset fails to break and finish above the zones, the asset's direction changes.
There is generally a lot of selling pressure (supply) near a resistance level, which causes the markets to resist by driving the asset's price down.
2. Explain different types of Support & resistance with proper demonstration.
When the marketplace reverses to the same region, the prior resistance would change into new support or the previous support will turn into new resistance, depending on whether the trend is up or down. This region of support/resistance in the market is always made up either of buyers or sellers. They frequently create horizontal trend lines during uptrends and downtrends.
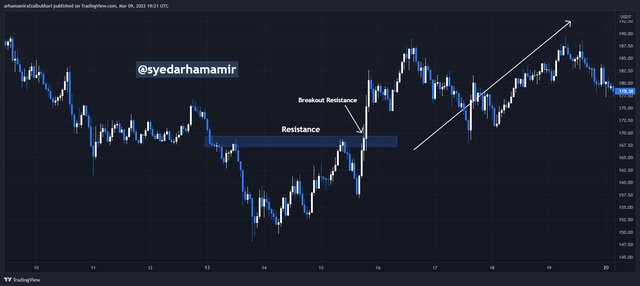
- Uptrend:
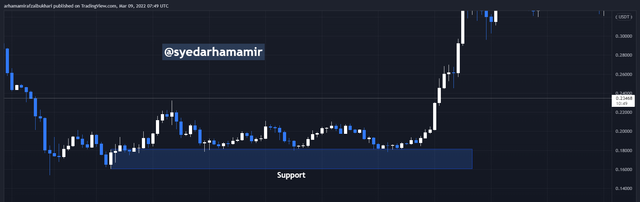
During an uptrend, there is generally a break above horizontal resistance, which always indicates the possibility of a trend continuation, and the position from which the resistance has been broken would become the new support, from which the price now moves upwards through forming steady higher peaks and higher low points as the price shifts from bullish to bearish.
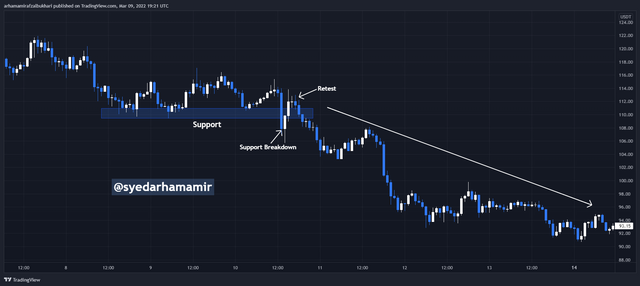
- Downtrend:
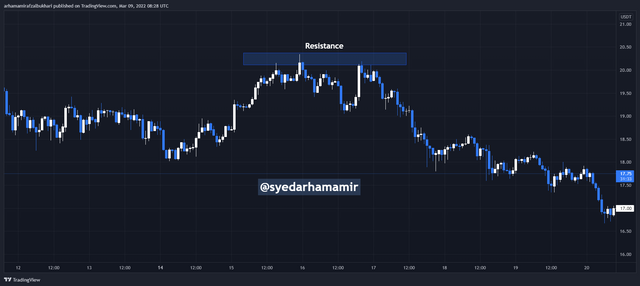
During a downtrend, a break below horizontal support usually indicates the possibility of a trend continuation, and the position where the support has been broken is becoming the new resistance, causing the price to keep moving downwards trend by establishing continuous lower highs as well as lower low points as the price starts to turn from bullish to bearish.
- Uptrend:
While there is a breach just at previous higher peak that does not break the prior levels but establishes a steady new higher high, sloping resistance as well as supports frequently appear diagonally throughout an uptrend. This happens diagonally all of the time. This means that throughout a bullish trend, at least two consecutive higher highs must be linked diagonally, resulting in an asset price rise.
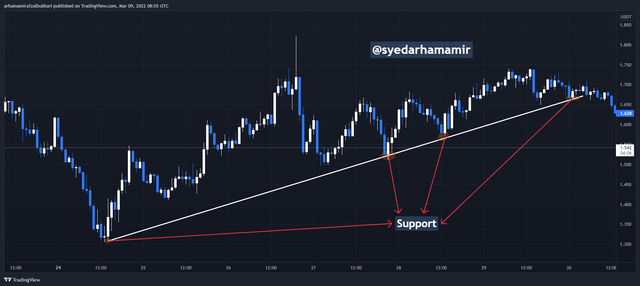
Price resumed its bullish movement by drawing back and resuming its upward movement whenever a support was violated, as seen in the chart above.
- Downtrend:
During a decline, slope levels of resistance as well as support frequently appear diagonally when there is a breach just at previous lower low that does not break the prior levels but does produce a continuous new lower low. This usually happens in a diagonal pattern. This means that during a bearish trend, at least two consecutive lower lows must be linked diagonally, resulting in a reduction in the asset price.
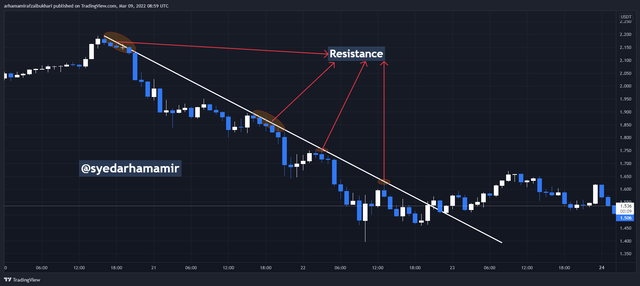
Price resumed its negative action whenever a resistance was rejected, as seen in the chart above, by pulling down and continuing its decline.
Moving average indicator can readily detect dynamic support as well as resistance levels, and it is generally a retracement in the marketplace as the market creates a fresh pullback by resisting that region and moving steadily in its original direction. During an upswing or decline, this dynamic support as well as resistance frequently appears. I'll use a Moving Average to demonstrate what I'm talking about.
- Uptrend:
When price breaches above line of the indicator then retraces back to resume its upward march during an uptrend, this dynamic support level may be noticed from the MA.
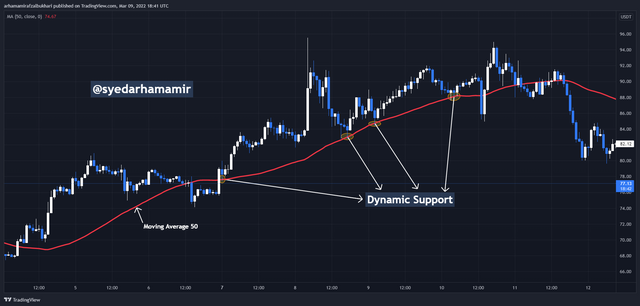
The Moving Average indicator was operating as a dynamic support while the price moved upward, as seen in the chart above.
- Downtrend:
When price falls underneath the line of the indicator then pulls back back to continue its downward path during a downtrend, this dynamic resistance level becomes observed from the MA.
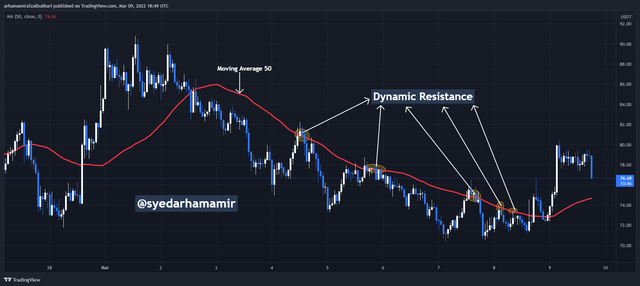
The Moving Average indicator was serving as a dynamic resistance because as price moved downward, as seen in the chart above.
3. Identify The False & Successful Breakouts. (demonstrate with screenshots)
This is a form of breakout that happens when a price rises from support or above resistance by either continuing in its original path or changing its direction to a new path. There are two types of breakouts: continuation and reversal.
- Continuation Breakout:
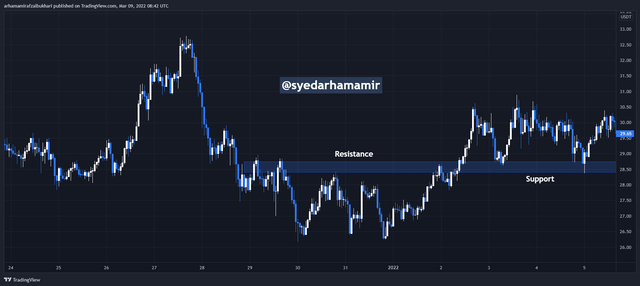
When an asset's price swings aggressively in one direction, creating whether support or resistance, this will retest and retrace by breaching that levels (either support or resistance), then continue in the same direction.
We can observe a continuing breakout in the chart above as price continues to move in the same direction.
- Reversal Breakout:
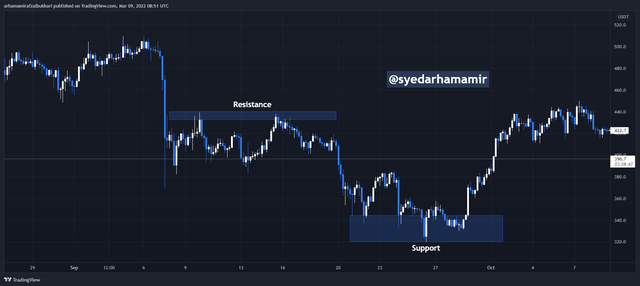
We may deduce from the term reversal that it refers to a successful shift in price direction, from either bullish to bearish or vice versa, since a trend direction normally emerges following a successful breakthrough. For example, if the price of is trading in an uptrend, it may retest the breakout point before shifting downwards and making new lower highs as well as lower lows.
After witnessing a breakthrough, we can note a shift in price direction in the chart above.
This often occurs when price moves beyond a breakout, from either resistance or support, and then reverses its advance by returning to the support and resistance levels.
4. Use Volume and RSI Indicator Combined with Breakouts & Identify the Entry Point. (demonstrate with screenshots).
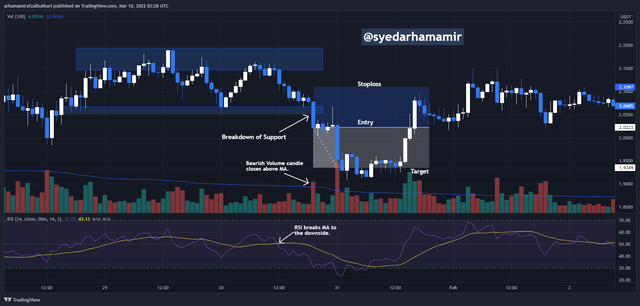
In the screenshot below, we can see that the price broke support and the candle closed below it. In confluence to that, we can also see the Bearish Volume candle closing above the MA. Also, the RSI has also crossed its MA to the downside. All these confluence indicate a Bearish movement. I identified the entry point to be the open of the new candle which was formed after the previous candle broke the support. I placed my stop loss above the support level and placed my target accordingly while maintaining a decent risk to reward ratio.
5. Take a Real Trade(crypto pair) on Your Account After a Successful Breakout. (transaction screenshot required).
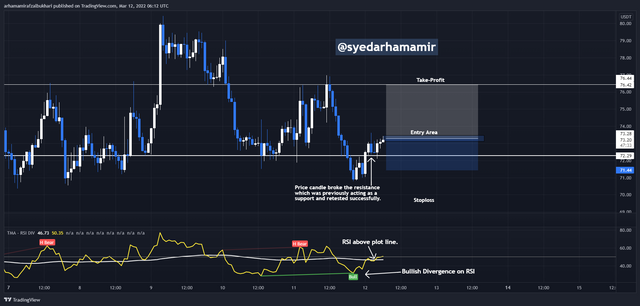
I used RSI indicator in confluence with support and resistance in order to identify a successful breakout and enter a trade. The pair which I used is AVAX/USDT. You can see that the price action was having a support which broke and would now be knowned as a resistance. But after a few candles, the price got back into the support zone breaking the resistance line to the upside. It also retested successfully. With confluence to this, I saw that there was a Bullish Divergence on the RSI and the RSI was also above the plot line, indicating a bullish movement. Therefore, I decided to enter the trade. I placed my stoploss below the support line and my target at the resistance and I took the entry at the market price.
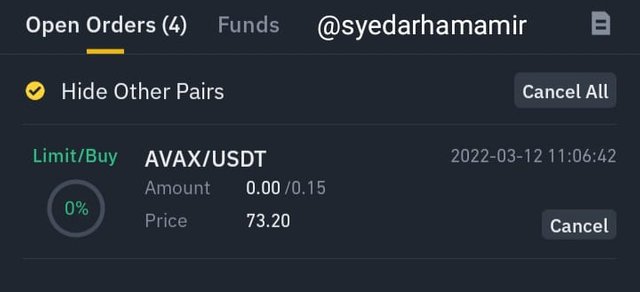
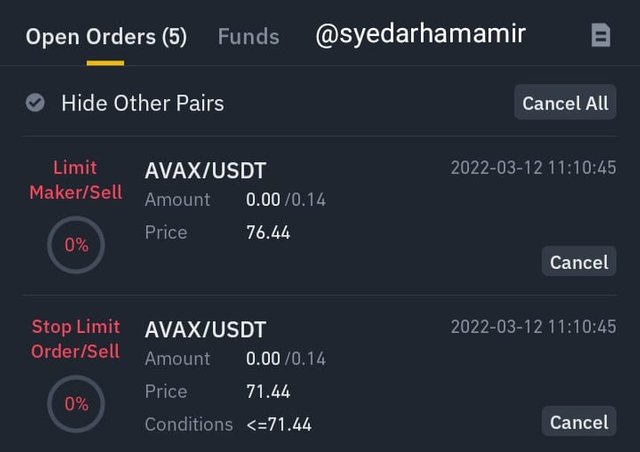
As I was done with marking my trade positions, I opened Binance and opened a buy order. I placed the buy order at the market price. Then, I opened a sell order and placed my target price and stoploss price. The screenshots of the orders is attached below.
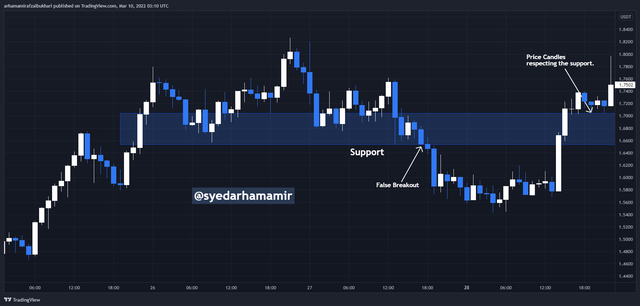
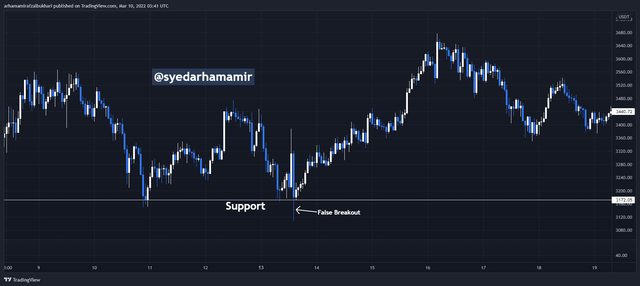
Due to high or low volatility of the market at sometimes, traders are unable to determine if a breakout at support and resistance levels is real or false. However, once one trader is able to determine such breakout, they will be extremely successful with his trade. For instance, when an asset price breaks over at a support level, the candle might lose its power by closing it above support level, causing traders to get misleading breakout signals.
So far, I've figured out what support and resistance are and how they differ. I also learned the difference between a real and a fake breakthrough. I was able to pinpoint entry and exit positions in the market using volume and the RSI indicator in combination with a breakout. Lastly, I would like to thank Professor @shemul21 for giving us such an amazing lesson. Thank you!