Steemit Crypto Academy Season 2-Week4 | Cryptocurrency Trading with RSI
source
Good Evening professor @kouba01 , and to the community of #steemitcryptoacademy , thank you for the learning that you leave us in this interesting process of teaching and learning about the management of RSI, then I deliver the assigned task.
What is the Relative Strength Index - RSI and How is it Calculated?
It is a technical indicator based on probabilistic theories that traders prefer to use for its versatility in its use, helping to predict the moment when the cryptocurrency is far from an expected value, allowing significant gains before the platform makes the relevant corrections predicting future trends of new cryptocurrency prices based on an overbought or oversold retracement. The Relative Strength Index RSI, was developed in the 1970s by Willis Wilder as a very useful tool for stock market performance, tracking the magnitude of prices and the speed with which it varies. In this sense the indicator behaves as an oscillator over time indicating the volatility in the market.
How to calculate it.
First we must add the variations of the last ups and divide by the last downs. And then apply this formula:
RSI = 100 - 100 / (1 + RS)
The RS is the average of the last increases by the average of the last decreases.
Can we trust the RSI on cryptocurrency trading and why?
Confidence is implicit in the trader's knowledge and skill in using the RSI. Although it is not an absolute indicator, it provides insight into the movement trends of cryptocurrencies.
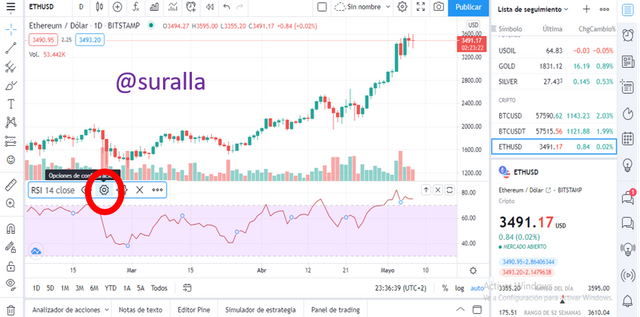
How do you configure the RSI indicator on the chart and what does the length parameter mean? Why is it equal to 14 by default? Can we change it? (Screen capture required)
You go to the TradingView page, register for free, then choose a Pair (ETHUSD), once inside, under the oscillations chart, there are some icons located to configure the RSI.
Screenshot
Screenshot
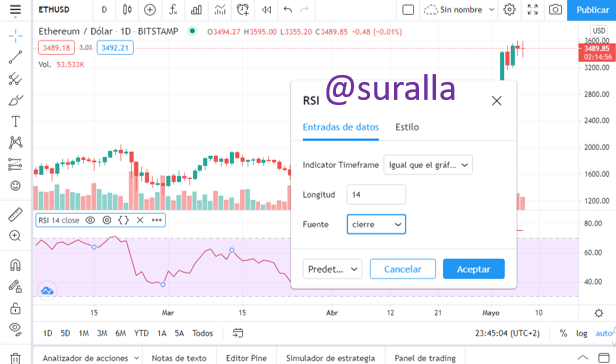
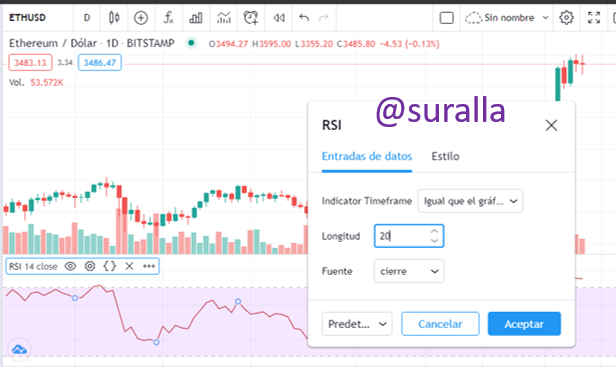
Can we change it?
Whether changes can be made to the RSI configuration
Screenshot
From what has been studied, the RSI default period is a pre-existing (default) value of a configuration that measures changes in cryptocurrency prices over 14 periods, which can be selected by the user according to the user's interest, i.e. every minute, hour, day or month, for example. In this chosen period, the ratio of upward and downward movements of the cryptocurrency is measured, adjusted in a normalized range from 0 to 100, of which any value above 50 is considered increase or gain and below fall or loss. Within this normalized range there are two levels, 30 and 70 which define areas of interest to the trader to make decisions according to the trend, if it crosses the trend from 30 down is defined as bearish divergence and above 70 a bullish divergence.
How do you interpret the overbought and oversold signals when trading cryptocurrencies? (Screen capture required)
When using the RSI indicator in the area above 70 to 100 is interpreted as overbought, which means that with respect to the previous price of the cryptocurrency, it is relatively cheap and in the area below 30 to 0, it is interpreted as oversold is relatively expensive. In the graph, it is represented as the oscillator fluctuates in the range of 0 to 100, signaling the levels of bullish divergence and bearish divergence indicating to the trader the existence of making decisions when to enter or exit the buy - sell market. These decisions are the ones that generate the changes in the reinvestments modifying the trends.
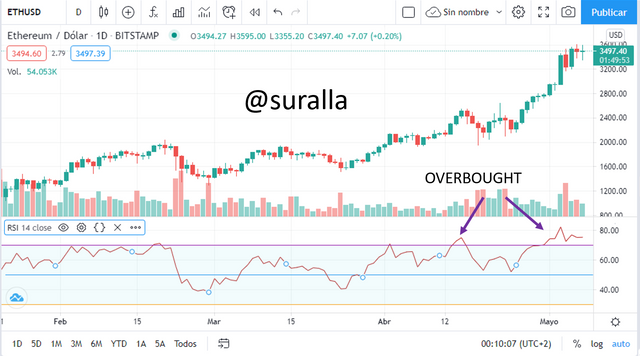
Screenshot
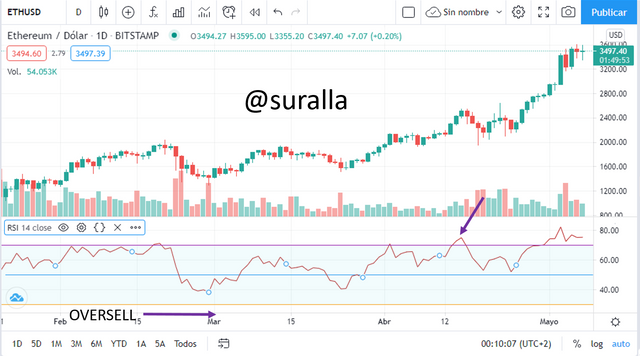
ScreenshotThis chart is not oversold, as it does not cross the 30 to 0 line.
How do we filter RSI signals to distinguish and recognize true signals from false signals. (Screen capture required)
This is achieved by tracking the behavior of the RSI, considering periods adjusted to the variation of the cryptocurrency price. For this it is necessary to know well the meaning of the divergence presented by the cryptocurrency, either bullish or bearish. When bearish trends are presented we find bullish divergences, this is when the minimum indicators rise while the next minimum is presented which is interpreted that there is a force trying to make the cryptocurrency prices rise. Similarly, when we observe on the chart that the highs are rising while the next high is present, there is a force trying to make the cryptocurrency price go down. So the bullish and bearish divergences are indicators of a reinvestment of the cryptocurrency price, which induces to take advantage of the indicators not to have losses.
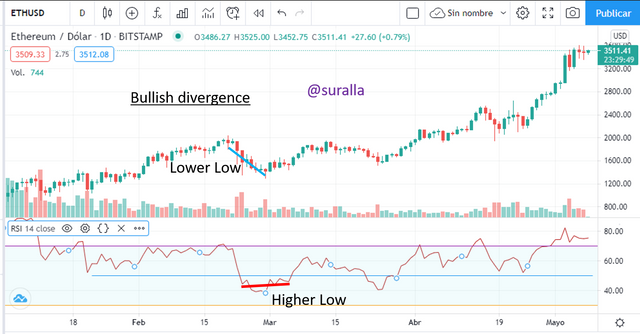
Screenshot
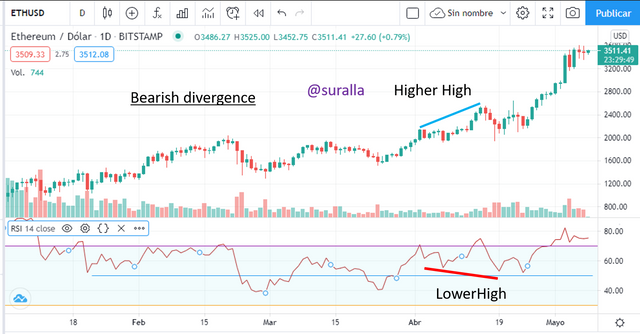
Screenshot
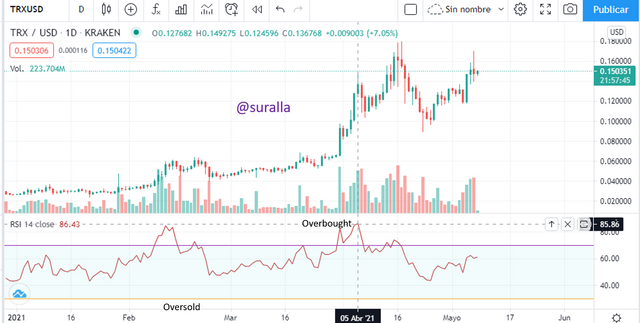
Review the chart of any pair (eg TRX / USD) and present the various signals from the RSI. (Screen capture required)
Screenshot
In the pair (TRX USD), in the time range selected in the chart, there is no oversold operation, however, in the overbought zone, such operation is observed on the dates (February 8 - February 14) (February 18 - February 20) and (March 30 - April 7).
CONCLUSION
The use of Rsi as an indicator of overbought and oversold cryptocurrency price trends allows the trader to have an estimate of when to trade for significant profits and to predict when a possible cryptocurrency price reinvestment might occur.
The confidence and security of using this valuable tool depends on the trader's skill and ability.
The use of the chart is essential for visualizing the trends and behavior of the RSI.
Thank you very much for the opportunity and the learning.
Hello @suralla,
Thank you for participating in the 4th Week Crypto Course in its second season and for your efforts to complete the suggested tasks, you deserve a 6/10 rating, according to the following scale:
My review :
Generally acceptable work, your answers were short and lacked an analytical dimension. Try to delve deeper into the points raised with more research and criticism.
Thanks again for your effort, and we look forward to reading your next work.
Sincerely,@kouba01