Crypto Academy Season 4 Beginner's Course-Task 10: Candle Stick Patterns
Introduction

Good evening, dear friends! My name is @suleja. I'm so excited right now and thrilled to write to you again about Professor @reminiscence01's insightful lecture on candlestick patterns. this week after attending his lecture. I must say that it has helped me understand a lot more about the Japanese candlestick chart and how simple it is for newbies like me and traders to use it in trading decisions. I will finish the homework task by providing my best answers to the following questions.
QUESTION
1a) Explain the Japanese candlestick chart? (Original screenshot required).
b) In your own words, explain why the Japanese Candlestick chart is the most used in the financial market.
c) Describe a bullish and a bearish candle. Also, explain its anatomy. (Original screenshot required)
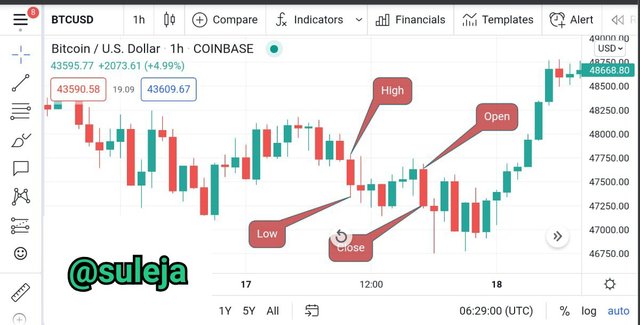
EXPLAIN THE JAPANESE CANDLESTICK CHART?
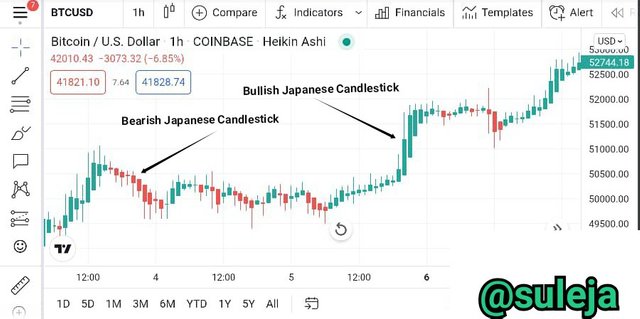
The Japanese candlestick pattern was originated in Japan. It is a type of pattern or mechanism which traders use to measure a change in the price. It has been very successful in the Crypto or stock markets. The Japanese candlestick pattern is a very popular pattern and is mostly used in trading. With the help of this chart, traders analyze the changes in the market and buy or sell their stocks at the right time just because of the help of the candlestick patterns. By understanding the patterns of the past, traders read them and predict the future price movements.
Trading is mostly linked with the patterns of the past. These can be read by the candlestick pattern. The reason for the success of the Candlestick pattern is that it analyzes the past patterns completely by showing the open prices, close time prices, the highest reached in that time, and the lowest.
This candlestick pattern was discovered by a man named Hooma in the 1700s. He was a simple rice trader in Japan and had very good knowledge about buying and selling and how many people are buying and also knew how much was the supply. He was curious to understand the fluctuations of prices and wanted to know the particular reason for those fluctuations. Because as we know now that the price is directly linked with the supply and the markets are influenced by the activities of the traders.
This is what the Candlestick pattern shows, the activities of the traders by representing the size of the candles and by different colours according to scale. We can set the time limit or duration and can see the data that way. It helps in better predictions and the price of a stock can be better predicted due to the variations provided according to time.
As we have already discussed that the structure of candlestick comprises of open price, close price, highest price, and open price.
IN YOUR OWN WORDS, EXPLAIN WHY THE JAPANESE CANDLESTICK CHART IS THE MOST USED IN THE FINANCIAL MARKET
4
Steemit Crypto Academy Season 4 - Homework Post for Task 10, Candlestick Patterns by @abdu.navi03
abdu.navi03 (58)in SteemitCryptoAcademy • 7 days ago
Hello everyone how're you all? I am back with a new assignment for beginners which is Task 10. This beginner assignment post is for professor @reminiscence01
In this lecture, we learned about The Japanese Candlestick Chart, Candlestick Anatomy, Candlestick Patterns, Trading Candlestick Patterns
WhatsApp Image 2021-10-25 at 9.08.48 PM.jpeg
This picture is edited by my mobile's default app.
C3TZR1g81UNaPs7vzNXHueW5ZM76DSHWEY7onmfLxcK2iQbBv4GvkaMjahujpT6a37K45VWhGqezCf2fcKd1jCdgzg1vWVdWqAVg3hUjvdQpXAVsKtVr6qC.png
The topic which we have to discuss in this task is ;
1a) Explain the Japanese candlestick chart? (Original screenshot required).
b) In your own words, explain why the Japanese Candlestick chart is the most used in the financial market.
c) Describe a bullish and a bearish candle. Also, explain its anatomy. (Original screenshot required)
C3TZR1g81UNaPs7vzNXHueW5ZM76DSHWEY7onmfLxcK2iQbBv4GvkaMjahujpT6a37K45VWhGqezCf2fcKd1jCdgzg1vWVdWqAVg3hUjvdQpXAVsKtVr6qC.png
a) JAPANESE CANDLESTICK CHART
The Japanese candlestick pattern was originated in Japan. It is a type of pattern or mechanism which traders use to measure a change in the price. It has been very successful in the Crypto or stock markets. The Japanese candlestick pattern is a very popular pattern and is mostly used in trading. With the help of this chart, traders analyze the changes in the market and buy or sell their stocks at the right time just because of the help of the candlestick patterns. By understanding the patterns of the past, traders read them and predict the future price movements.
Trading is mostly linked with the patterns of the past. These can be read by the candlestick pattern. The reason for the success of the Candlestick pattern is that it analyzes the past patterns completely by showing the open prices, close time prices, the highest reached in that time, and the lowest.
ss 1.PNG
source
This candlestick pattern was discovered by a man named Hooma in the 1700s. He was a simple rice trader in Japan and had very good knowledge about buying and selling and how many people are buying and also knew how much was the supply. He was curious to understand the fluctuations of prices and wanted to know the particular reason for those fluctuations. Because as we know now that the price is directly linked with the supply and the markets are influenced by the activities of the traders.
This is what the Candlestick pattern shows, the activities of the traders by representing the size of the candles and by different colours according to scale. We can set the time limit or duration and can see the data that way. It helps in better predictions and the price of a stock can be better predicted due to the variations provided according to time.
As we have already discussed that the structure of candlestick comprises of open price, close price, highest price, and open price.
C3TZR1g81UNaPs7vzNXHueW5ZM76DSHWEY7onmfLxcK2iQbBv4GvkaMjahujpT6a37K45VWhGqezCf2fcKd1jCdgzg1vWVdWqAVg3hUjvdQpXAVsKtVr6qC.png
b) In your own words, explain why the Japanese candlestick chart is the most widely used in the financial market.
I think the Japanese candlestick pattern has great importance in the financial markets due to many reasons. Some of them are;
Timely decision: It assists the traders or investors in making the right decisions at the time. By reading candlestick patterns, one can easily understand the fluctuations in the prices of the stocks and what fluctuation will happen in the future, this can also be predicted. The structure of candlestick that consists of highest, lowest, open, and close price helps the trader very much to know about the past patterns. By understanding this, a trader can easily invest at the right time.
Analyzation: Thanks to the Japanese candlestick pattern, understanding the ups and downtrends and the fluctuations of prices has become very easy, A trader can understand the complete market in very little time by reading the candlesticks of the past. This has been made possible by looking at the length and color of the respective candlestick. The candlestick is comprised of two colors, red and green. The red color always represents the negative price movement and the green color always represents the positive price movement.
Easily understandable: The Japanese candlestick pattern is very easy to understand. It gives a friendly illustration and helps the trader to understand the past patterns, different prices at different times, the reason for these fluctuations, and complete information. By changing the scale, you can receive the information regulated at different times.
DESCRIBE A BULLISH AND A BEARISH CANDLE. ALSO, EXPLAIN ITS ANATOMY.
BULLISH CANDLESTICKS
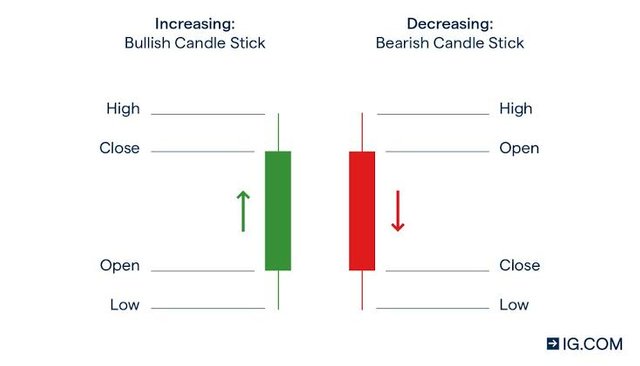
The literal meaning of bullish is hopeful, confident, or self-assertive. While in the Stock market it means the share is characterized by rising prices. The bullish candlestick shows the variations of increased prices in the market. It shows the relative amount of increased price in the market, how far it increased. The bullish candlestick is shown in green color. The presence of bullish candlestick shows the increase in the price of the assets. The closing price of the asset after a particular time is always greater than the open price in Bullish candlestick. The highest price is located on the top of the bar while the lowest price is located on the bottom of the candlestick.
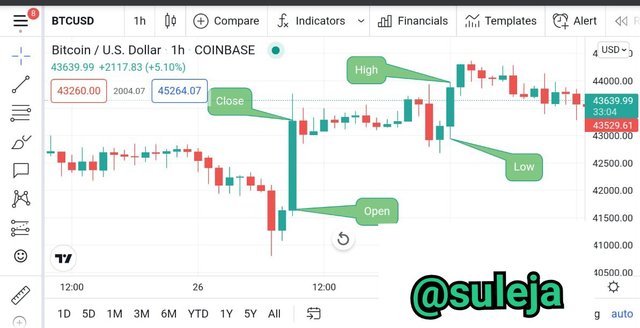
High Price
The high price is the highest price that is attained by the asset in a given interval of time. It is indicated at the top of the candlestick. The highest price can be higher or equal to the open or close price as it is the highest price attained throughout the interval of time.
Low Price
The low price indicates the lowest price which is recorded through a bullish price candlestick in a given interval of time. It is indicated at the bottom of the candlestick. This low price can be equal to or lower than the open or close price.
Open Price
The Open Price is the initiative price at which the bullish candlestick started its activity. The open price of bullish candlestick also indicates that the price will move in Up direction that is bullish direction.
Close Price
The close price is the closing price for a given interval of time at which the activity of bullish candlestick ended. In bullish candlestick, the closing price is always higher than the open price.
BEARISH CANDLESTICKS
4
Steemit Crypto Academy Season 4 - Homework Post for Task 10, Candlestick Patterns by @abdu.navi03
abdu.navi03 (58)in SteemitCryptoAcademy • 7 days ago
Hello everyone how're you all? I am back with a new assignment for beginners which is Task 10. This beginner assignment post is for professor @reminiscence01
In this lecture, we learned about The Japanese Candlestick Chart, Candlestick Anatomy, Candlestick Patterns, Trading Candlestick Patterns
WhatsApp Image 2021-10-25 at 9.08.48 PM.jpeg
This picture is edited by my mobile's default app.
C3TZR1g81UNaPs7vzNXHueW5ZM76DSHWEY7onmfLxcK2iQbBv4GvkaMjahujpT6a37K45VWhGqezCf2fcKd1jCdgzg1vWVdWqAVg3hUjvdQpXAVsKtVr6qC.png
The topic which we have to discuss in this task is ;
1a) Explain the Japanese candlestick chart? (Original screenshot required).
b) In your own words, explain why the Japanese Candlestick chart is the most used in the financial market.
c) Describe a bullish and a bearish candle. Also, explain its anatomy. (Original screenshot required)
C3TZR1g81UNaPs7vzNXHueW5ZM76DSHWEY7onmfLxcK2iQbBv4GvkaMjahujpT6a37K45VWhGqezCf2fcKd1jCdgzg1vWVdWqAVg3hUjvdQpXAVsKtVr6qC.png
a) JAPANESE CANDLESTICK CHART
The Japanese candlestick pattern was originated in Japan. It is a type of pattern or mechanism which traders use to measure a change in the price. It has been very successful in the Crypto or stock markets. The Japanese candlestick pattern is a very popular pattern and is mostly used in trading. With the help of this chart, traders analyze the changes in the market and buy or sell their stocks at the right time just because of the help of the candlestick patterns. By understanding the patterns of the past, traders read them and predict the future price movements.
Trading is mostly linked with the patterns of the past. These can be read by the candlestick pattern. The reason for the success of the Candlestick pattern is that it analyzes the past patterns completely by showing the open prices, close time prices, the highest reached in that time, and the lowest.
ss 1.PNG
source
This candlestick pattern was discovered by a man named Hooma in the 1700s. He was a simple rice trader in Japan and had very good knowledge about buying and selling and how many people are buying and also knew how much was the supply. He was curious to understand the fluctuations of prices and wanted to know the particular reason for those fluctuations. Because as we know now that the price is directly linked with the supply and the markets are influenced by the activities of the traders.
This is what the Candlestick pattern shows, the activities of the traders by representing the size of the candles and by different colours according to scale. We can set the time limit or duration and can see the data that way. It helps in better predictions and the price of a stock can be better predicted due to the variations provided according to time.
As we have already discussed that the structure of candlestick comprises of open price, close price, highest price, and open price.
C3TZR1g81UNaPs7vzNXHueW5ZM76DSHWEY7onmfLxcK2iQbBv4GvkaMjahujpT6a37K45VWhGqezCf2fcKd1jCdgzg1vWVdWqAVg3hUjvdQpXAVsKtVr6qC.png
b) In your own words, explain why the Japanese candlestick chart is the most widely used in the financial market.
I think the Japanese candlestick pattern has great importance in the financial markets due to many reasons. Some of them are;
Timely decision: It assists the traders or investors in making the right decisions at the time. By reading candlestick patterns, one can easily understand the fluctuations in the prices of the stocks and what fluctuation will happen in the future, this can also be predicted. The structure of candlestick that consists of highest, lowest, open, and close price helps the trader very much to know about the past patterns. By understanding this, a trader can easily invest at the right time.
Analyzation: Thanks to the Japanese candlestick pattern, understanding the ups and downtrends and the fluctuations of prices has become very easy, A trader can understand the complete market in very little time by reading the candlesticks of the past. This has been made possible by looking at the length and color of the respective candlestick. The candlestick is comprised of two colors, red and green. The red color always represents the negative price movement and the green color always represents the positive price movement.
Easily understandable: The Japanese candlestick pattern is very easy to understand. It gives a friendly illustration and helps the trader to understand the past patterns, different prices at different times, the reason for these fluctuations, and complete information. By changing the scale, you can receive the information regulated at different times.
Complete Information: This chart gives the complete information about the financial market. This chart became very famous because of its reliability and the complete information that it provides. Because of its reliability, the traders have become really successful and are efficiently trading with profits. The Japanese candlestick pattern provides traders the complete information about the fluctuation of prices in the market. This has been very successful to the traders in the past years and is providing benefits even now.
C3TZR1g81UNaPs7vzNXHueW5ZM76DSHWEY7onmfLxcK2iQbBv4GvkaMjahujpT6a37K45VWhGqezCf2fcKd1jCdgzg1vWVdWqAVg3hUjvdQpXAVsKtVr6qC.png
c) Describe a bullish and bearish candle. Also, explain its anatomy. (Original screenshot required)
ADdPNihJzmPcaLq5TT21hZJMQGMt65MygAivCwe8326JNFRmjT6suSGqUB2fqUAm4g4hou218nWFajtoW1qKLkZWn.png
source
BULLISH CANDLESTICKS:
The literal meaning of bullish is hopeful, confident, or self-assertive. While in the Stock market it means the share is characterized by rising prices. The bullish candlestick shows the variations of increased prices in the market. It shows the relative amount of increased price in the market, how far it increased. The bullish candlestick is shown in green color. The presence of bullish candlestick shows the increase in the price of the assets. The closing price of the asset after a particular time is always greater than the open price in Bullish candlestick. The highest price is located on the top of the bar while the lowest price is located on the bottom of the candlestick.
High Price
The high price is the highest price that is attained by the asset in a given interval of time. It is indicated at the top of the candlestick. The highest price can be higher or equal to the open or close price as it is the highest price attained throughout the interval of time.
Low Price
The low price indicates the lowest price which is recorded through a bullish price candlestick in a given interval of time. It is indicated at the bottom of the candlestick. This low price can be equal to or lower than the open or close price.
Open Price
The Open Price is the initiative price at which the bullish candlestick started its activity. The open price of bullish candlestick also indicates that the price will move in Up direction that is bullish direction.
Close Price
The close price is the closing price for a given interval of time at which the activity of bullish candlestick ended. In bullish candlestick, the closing price is always higher than the open price.
bulllishhh.jpeg
source
7kq2TLHKEHhBfZRYbJvEXxXoqL3FWypb9y9syj5ndRnDJM2QwZ3LhrKL24mDJ6t3vJ6hBCQgwFd4BAr531TL641Yyhgzr7YTNAdJGz3Xfqwuh31pedFC6sDhm9WvWtoeKpwxx3wQ5w8uvLze7NjueEtbPFsibDtFpa6xtQEFH5bR1wotyB6CjLADP7TiL3bYo9mehAxUgj9LV2tGmdZ8.png
BEARISH CANDLESTICKS:
The literal meaning of Bearish is being rough or clumsy. While in the stock market, Bearish means the stock is characterized by decreasing prices. The bearish candlestick shows the variations of decreased prices in the market. It shows the relative amount of decreased price in the market, how far it decreased. The bearish candlestick is shown in red color. The presence of bearish candlestick shows the decrease in the price of the assets
A Bearish Candle's Anatomy
4
Steemit Crypto Academy Season 4 - Homework Post for Task 10, Candlestick Patterns by @abdu.navi03
abdu.navi03 (58)in SteemitCryptoAcademy • 7 days ago
Hello everyone how're you all? I am back with a new assignment for beginners which is Task 10. This beginner assignment post is for professor @reminiscence01
In this lecture, we learned about The Japanese Candlestick Chart, Candlestick Anatomy, Candlestick Patterns, Trading Candlestick Patterns
WhatsApp Image 2021-10-25 at 9.08.48 PM.jpeg
This picture is edited by my mobile's default app.
C3TZR1g81UNaPs7vzNXHueW5ZM76DSHWEY7onmfLxcK2iQbBv4GvkaMjahujpT6a37K45VWhGqezCf2fcKd1jCdgzg1vWVdWqAVg3hUjvdQpXAVsKtVr6qC.png
The topic which we have to discuss in this task is ;
1a) Explain the Japanese candlestick chart? (Original screenshot required).
b) In your own words, explain why the Japanese Candlestick chart is the most used in the financial market.
c) Describe a bullish and a bearish candle. Also, explain its anatomy. (Original screenshot required)
C3TZR1g81UNaPs7vzNXHueW5ZM76DSHWEY7onmfLxcK2iQbBv4GvkaMjahujpT6a37K45VWhGqezCf2fcKd1jCdgzg1vWVdWqAVg3hUjvdQpXAVsKtVr6qC.png
a) JAPANESE CANDLESTICK CHART
The Japanese candlestick pattern was originated in Japan. It is a type of pattern or mechanism which traders use to measure a change in the price. It has been very successful in the Crypto or stock markets. The Japanese candlestick pattern is a very popular pattern and is mostly used in trading. With the help of this chart, traders analyze the changes in the market and buy or sell their stocks at the right time just because of the help of the candlestick patterns. By understanding the patterns of the past, traders read them and predict the future price movements.
Trading is mostly linked with the patterns of the past. These can be read by the candlestick pattern. The reason for the success of the Candlestick pattern is that it analyzes the past patterns completely by showing the open prices, close time prices, the highest reached in that time, and the lowest.
ss 1.PNG
source
This candlestick pattern was discovered by a man named Hooma in the 1700s. He was a simple rice trader in Japan and had very good knowledge about buying and selling and how many people are buying and also knew how much was the supply. He was curious to understand the fluctuations of prices and wanted to know the particular reason for those fluctuations. Because as we know now that the price is directly linked with the supply and the markets are influenced by the activities of the traders.
This is what the Candlestick pattern shows, the activities of the traders by representing the size of the candles and by different colours according to scale. We can set the time limit or duration and can see the data that way. It helps in better predictions and the price of a stock can be better predicted due to the variations provided according to time.
As we have already discussed that the structure of candlestick comprises of open price, close price, highest price, and open price.
C3TZR1g81UNaPs7vzNXHueW5ZM76DSHWEY7onmfLxcK2iQbBv4GvkaMjahujpT6a37K45VWhGqezCf2fcKd1jCdgzg1vWVdWqAVg3hUjvdQpXAVsKtVr6qC.png
b) In your own words, explain why the Japanese candlestick chart is the most widely used in the financial market.
I think the Japanese candlestick pattern has great importance in the financial markets due to many reasons. Some of them are;
Timely decision: It assists the traders or investors in making the right decisions at the time. By reading candlestick patterns, one can easily understand the fluctuations in the prices of the stocks and what fluctuation will happen in the future, this can also be predicted. The structure of candlestick that consists of highest, lowest, open, and close price helps the trader very much to know about the past patterns. By understanding this, a trader can easily invest at the right time.
Analyzation: Thanks to the Japanese candlestick pattern, understanding the ups and downtrends and the fluctuations of prices has become very easy, A trader can understand the complete market in very little time by reading the candlesticks of the past. This has been made possible by looking at the length and color of the respective candlestick. The candlestick is comprised of two colors, red and green. The red color always represents the negative price movement and the green color always represents the positive price movement.
Easily understandable: The Japanese candlestick pattern is very easy to understand. It gives a friendly illustration and helps the trader to understand the past patterns, different prices at different times, the reason for these fluctuations, and complete information. By changing the scale, you can receive the information regulated at different times.
Complete Information: This chart gives the complete information about the financial market. This chart became very famous because of its reliability and the complete information that it provides. Because of its reliability, the traders have become really successful and are efficiently trading with profits. The Japanese candlestick pattern provides traders the complete information about the fluctuation of prices in the market. This has been very successful to the traders in the past years and is providing benefits even now.
C3TZR1g81UNaPs7vzNXHueW5ZM76DSHWEY7onmfLxcK2iQbBv4GvkaMjahujpT6a37K45VWhGqezCf2fcKd1jCdgzg1vWVdWqAVg3hUjvdQpXAVsKtVr6qC.png
c) Describe a bullish and bearish candle. Also, explain its anatomy. (Original screenshot required)
ADdPNihJzmPcaLq5TT21hZJMQGMt65MygAivCwe8326JNFRmjT6suSGqUB2fqUAm4g4hou218nWFajtoW1qKLkZWn.png
source
BULLISH CANDLESTICKS:
The literal meaning of bullish is hopeful, confident, or self-assertive. While in the Stock market it means the share is characterized by rising prices. The bullish candlestick shows the variations of increased prices in the market. It shows the relative amount of increased price in the market, how far it increased. The bullish candlestick is shown in green color. The presence of bullish candlestick shows the increase in the price of the assets. The closing price of the asset after a particular time is always greater than the open price in Bullish candlestick. The highest price is located on the top of the bar while the lowest price is located on the bottom of the candlestick.
High Price
The high price is the highest price that is attained by the asset in a given interval of time. It is indicated at the top of the candlestick. The highest price can be higher or equal to the open or close price as it is the highest price attained throughout the interval of time.
Low Price
The low price indicates the lowest price which is recorded through a bullish price candlestick in a given interval of time. It is indicated at the bottom of the candlestick. This low price can be equal to or lower than the open or close price.
Open Price
The Open Price is the initiative price at which the bullish candlestick started its activity. The open price of bullish candlestick also indicates that the price will move in Up direction that is bullish direction.
Close Price
The close price is the closing price for a given interval of time at which the activity of bullish candlestick ended. In bullish candlestick, the closing price is always higher than the open price.
bulllishhh.jpeg
source
7kq2TLHKEHhBfZRYbJvEXxXoqL3FWypb9y9syj5ndRnDJM2QwZ3LhrKL24mDJ6t3vJ6hBCQgwFd4BAr531TL641Yyhgzr7YTNAdJGz3Xfqwuh31pedFC6sDhm9WvWtoeKpwxx3wQ5w8uvLze7NjueEtbPFsibDtFpa6xtQEFH5bR1wotyB6CjLADP7TiL3bYo9mehAxUgj9LV2tGmdZ8.png
BEARISH CANDLESTICKS:
The literal meaning of Bearish is being rough or clumsy. While in the stock market, Bearish means the stock is characterized by decreasing prices. The bearish candlestick shows the variations of decreased prices in the market. It shows the relative amount of decreased price in the market, how far it decreased. The bearish candlestick is shown in red color. The presence of bearish candlestick shows the decrease in the price of the assets. The closing price of the asset after a particular time is always lower than the open price in bearish candlestick. The highest price is located on the top of the bar while the lowest price is located on the bottom of the candlestick.
Open Price
The Open Price is the initiative price at which the bearish candlestick started its activity. The open price of bearish candlestick also indicates that the price will move in down direction that is bullish direction.
Close Price
The close price is the end price of the price chart for a given period of time. The close price of an asset is higher than the open price of an asset in the bearish candlestick.
High Price
The high price is the highest price that is attained by the asset in that given interval of time. It is indicated at the top of the bearish candlestick. The highest price can be higher or equal to the open or close price as it is the highest price attained throughout the interval of time.
Low Price
The low price indicates the lowest price which is recorded through a bearish price candlestick in a given interval of time. It is indicated at the bottom of the bearish candlestick. This low price can be equal to or lower than the open or close price.
Note: I've power up all my earnings in the last 7 days, in my last task Professor @dilchamo omitted my #club5050 mark, I called her attention to it but she didn't responded. I hope this doesn't happen again
Thank you!