Trading Steem with TD Sequential.
| Note: TD Sequential Indicator is no more available hence in this post we have provide details on TD Sequential but for chart example we have applied Luxalgo sequencer which has same output as TD Sequential. |
|---|
Question 1: Understanding the TD Sequential Indicator.
Theory: Explain what the TD Sequential Indicator is and how it differs from other commonly used trading indicators. In your explanation, mention the concepts of "TD Setup" and "TD Countdown" and their importance in the context of cryptocurrency trading.
Tom DeMark developed the TD Sequential Indicator, an effective technical analysis tool for predicting future trend reversals by identifying weakness points in a trend. TD Sequential is a counter-trend indicator, making it especially useful when markets are fluctuating or overestimated. TD Sequential Indicator can be utilized on a variety of timescales and market situations, but its look effecting mostly on 4 hours timeframe chart and above, this can assist traders in determining the exact time of trend exhaustion and probable price reversals.
➜ TD Setup.
The TD Setup is an essential part of the TD Sequential indicator. It is an unique pattern generated by nine consecutive pricing bars. When market in uptrend, every single candle close price is higher than the previous 4 candles closing price, whereas when market in downtrend, every single candle close price is lower than the previous 4 candles closing price. The completion of a TD Setup marks a possible turning point in the market which indicate that the current trend is about to end and can be start of new trend, but the direction of this new trend is still based on broader market setuation.
When the market is in uptrend, it shart with numeric 1 that drawn if candle close higher than the previous 4 period candles closes. When a market is down, it it shart with numeric 1 that drawn if candle close lower than the previous 4 period candles closes.
➜ TD Countdown.
The TD Countdown is an another essential part that comes next to the TD Setup and tries to validate the expected trend reversal identified by the Setup. It is composed of a numerical sequence that counts to 13 and begins only when particular conditions are met, such as a precise relationship between the current bar and the bars preceding it. The TD Setup detects price exhaustion, and the TD Countdown verifies it, resulting in stronger and more reliable signals for traders. When the Countdown sequence is finished, it suggests a high possibility of a trend reversal.
➜ Importance in the context of cryptocurrency trading.
The TD Sequential Indicator is very significant in cryptocurrency trading because of its market natural volatility, As we know that the cryptocurrency market is dynamic market wherein anything can happen within a minute. In such market trades on exact timing is must require. TD Sequential Indicator assists traders in identifying future market High and Low levels, allowing them to detect reversals in volatile conditions. Traders can use the TD Sequential to make informed judgments, successfully manage risk, and benefit from short-term market swings.
Practice: Choose a cryptocurrency pair including STEEM (e.g., STEEM/USDT) and identify the TD Setup and TD Countdown sequences on a 4-hour chart. Describe the observations you make and what they mean for a trader.
Below is the price chart of Steem/USDT. not sure how the image may look like because the numbers of TD Setup and TD Countdown sequences are smalls, I tried to enlarge it for better visivlty but this much only it can be enlarge.
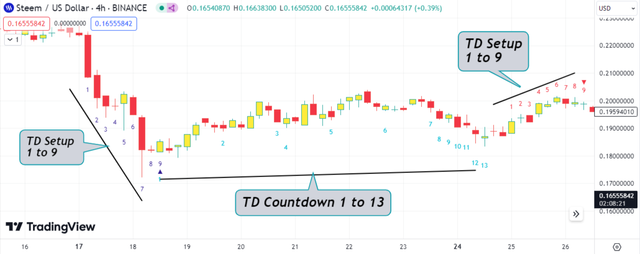
Starting from left, we have identified a TD Setup that appeared in the down movement, we can see the number sequence 1 to 9, when 9 platted, this means for traders to consider trend reversal. Accordingly we can see the candles started moving up, this is TD Countdown sequences 1 to 13 that is confirming the trend, when 13 appeared this means for traders to consider trend reversal, later at the right we can see bullish trend and form TD Setup again 1 to 9, again when 9 platted, this means for traders to consider trend reversal.
Question 2: The Psychology behind the TD Sequential.
Theory: Describe the psychology underlying the use of the TD Sequential Indicator. How can this indicator influence traders' decisions and the dynamics of the cryptocurrency market?
The TD Sequential Indicator relies into investor psychology by recognizing periods of tiredness in a trend, which may cause a number of emotional responses such as worry, FOMO, greed, and excitement. When a trend has been lasting for some time, traders may get concerned about its continuation or reversal, and the TD Sequential assists in gauging this tiredness, offering a psychological indication that the trend may be about to an end.
As the TD Countdown increases, expectation grows, frequently resulting in FOMO, higher buying pressure, and probable price spikes. However, following a profitable trade that relied on a TD Sequential indication, traders may get overconfident, taking on further risks which might end up in losses.
The TD Sequential Indicator may influences traders' decisions by providing an organized, based on rules system that minimizes emotional making decisions while encouraging logical trading. By providing unambiguous signals regarding possible reversals at certain points such as the TD Setup and TD Countdown, it boosts traders' confidence in their trade orders. This indicator supports in risk management by predicting possible turning points and allowing traders to determine stop loss and book profit levels. It also influences trade entry and exit points by advising where to enter as well as exit a trade in response to possible trend reversals.
Regarding influence cryptocurrency market dynamically, so the common use of the TD Sequential Indicator can have an important effect on market dynamics, impacting market sentiment, volatility in prices, and the efficiency of the market. As traders continue to depend on the TD Sequential and execute trades on its signals, true predictions could occur, with expected reversals happening as a result of collective effort. This collective action can affect investor emotions, resulting in raised price volatility, particularly near the end of TD Setups or Countdowns, when traders modify their positions in expectation of trend reversals. Furthermore, the TD Sequential can improve market performance by effectively forecasting price movements and allowing for the expected future price movement.
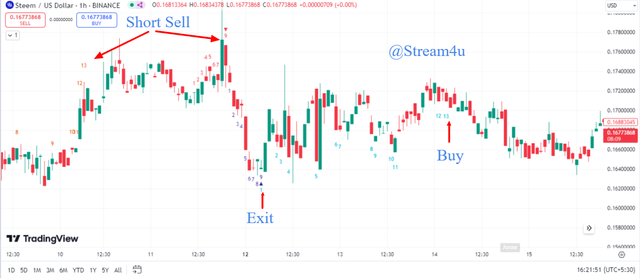
Practice: Based on a recent example, discuss how traders' psychology might have influenced the price of STEEM when TD Sequential signals appeared. Use historical charts to illustrate your point of view.
In the below Steem/USDT price chart, we can see how traders' psychology may influenced when TD Sequential signals appeared.
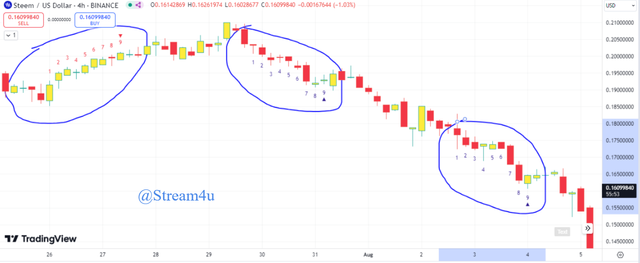
From left as we can see the TD Setup numeric appeared 1 to 9, here the 9 consider as turining point and since it is directing down side hence it can influence traders' psychology and according to it the trader may exit from their existing trade or place a fresh short sell trade.
Further, we can see after appearing 9, it actually does not fall from next candle and keep rise price, here if any traders placed heavy quantity trade when 9 appeared, he may be worry by seeing loss because price is keep rising.
However, further, we can see fall in the Steem/USDT price. Next, we can see again TD Setup numeric appeared 1 to 9. This time it shows up side turning point, means price can go up now. This can influence traders' psychology and according to it the trader may place buy orders after 9 shown on the chart. But, market did not rise, instead it fall more. Then next, again TD Setup numeric 1 to 9 appeared on the chart and again its indicating up side, traders may add more money to average or place new buy order. However, the price keep fall.
This is how the traders' psychology might have influenced the price of STEEM when TD Sequential signals appeared on a price chart.
Question 3: Explanation of the TD Setup.
Theory: Describe in detail the conditions necessary for a TD Setup to be completed. What specific criteria should be monitored, and why are they crucial for a trader?
To complete a TD Setup, some requirements must be completed within 9 continuous price candles. For bullish TD Setup, every candle close price must be smaller than the previous 4 candles closing price, this indicate that selling pressure has likely been weak and there is possibly preparing the way for price trend an upside reversal. On the other hand for bearish TD Setup, every candle close price must be higher than the previous 4 candles closing price, this indicate that buying pressure has likely been weak and there is possibly preparing the way for price trend an downside reversal. The sequence of 9 candle must be continued, if any candle does not fulfill the mentioned conditions, the TD Setup indication becomes wrong and then it will pointing out the necessity of constant market movement during the setup phase.
The criteria for a TD Setup are important because they play a role in finding areas of weakness within a trend where momentum is decreasing, helping traders to predict possible reversals and make smart decisions on entry and exit trades. The TD Setup requires continuing actions, such as a 9 candles sequence and continue sustained price movement, this indicating a increasing discrepancy in market sentiment, whether it is a bullish trend or bearish trend. This gives traders an advantage in terms of trade timing and risk management because spotting upcoming trend weakness allows them to set smart stop-loss levels and modify position sizes more effectively.
Monitoring the TD Setup frequently is critical to guarantee its success rate. The traders must have verify that each candle matches the prerequisites without halts as proactive attention can minimizes the invalid signals and improves the TD Setup accuracy of possible trend reversals. Add on to it, taking into account that the larger market environment hence combining the TD Setup with other technical indicators can improves its success rate for identifying market movements.
Practice: On a daily chart of the STEEM/BTC pair, identify a recent TD Setup and explain how a trader could have used this information to make a trading decision. Include screenshots and an analysis of the results obtained.
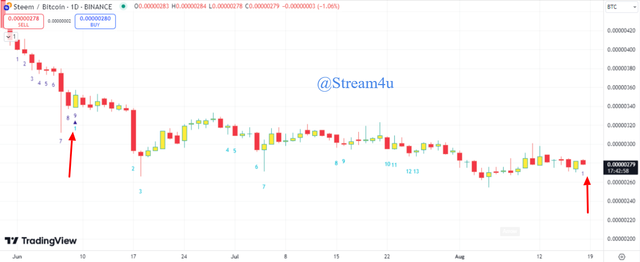
In the above image of STEEM/BTC prce chart, we can see the recent TD Setup. In this we can see from 1st June 2024 to 9th June 2024 the TD setup was formed on a chart, we can see continue 9 bullish candles formes. Then again todays candle 18th August 2024, we can see the 1 number candle has formed which is begening of new TD setup.
Trader can notice this for making trading decision like on 9th June 2024 after TD setup completed then could under consider that its a trend change movement. Since the numbers forms below the candles so it indicating trend may change from bearish to bullish. According to this the traders can place buy orders as price is likely go up.
Similarly, today 18th August 2024, new TD setup is forming, we can see 1st number candle has formed. Since the number is appearing below the candle so its indicating trend may change from bearish to bullish. Here, traders can wait till completion of TD setup means till 9 continue candles formed. Once 9th candle completed, traders can consider its a point where trend may change hence once the candle is completed then can place fresh buy orders.
Question 4: Using TD Countdown to Predict Reversal Points.
Theory: Explain the TD Countdown process and how it can be used to predict market reversal points. What is the difference between TD Setup and TD Countdown in their practical application?
The TD Countdown is the next stage for the TD Sequential Indicator, occurring after a completion of TD Setup. While the TD Setup highlights possible trend weakness, the TD Countdown predictions the probabilities of a trend reversal by numbering from 1 to 13, with each number representing a price bar that matches particular requirements in relation to previous bars.
For bullish TD Countdown, each candle closing price must be less than or equal to the low of two candles earlier, whereas in a bearish TD Countdown, each candle close price must be more than or equal to the high of two candle earlier.
The TD Countdown process ends when the 13 candle meets these conditions, indicating a high possibility of an upcoming trend reversal and a solid sign suggesting the trend has most likely reached its limit.
The TD Countdown differentiates from the TD Setup with regard to as practical use. The TD Setup is primarily used to detect possible trend weakness, acting as a means of early warning for traders. It assists in detecting early signals that a trend may be losing momentum. On the other hand, the TD Countdown is used to confirm this loss of momentum and believe the exact point at which a reversal is possibly to happen, providing a more specific signal for proper timing trades.
The TD Setup helps traders to predict moves and develop basic risk management techniques, whereas the TD Countdown gives the necessary confirmation to securely modify stop-loss levels or trade sizes depending on the possibility of an upcoming reversal.
These TD Sequential Indicator stades (TD Setup and TD Countdown) work together to assist traders to find the possible reversal levels as well as execute their trades more successfully, but we need to keep in mind that the indicator is uncertain, and not every countdown will give a successful reversal points.
Practice: On a 1-hour chart for STEEM/USDT, find a complete TD Countdown sequence and analyze how it influenced trading decisions. Did you observe a trend reversal at the end of the TD Countdown? Provide a detailed analysis.
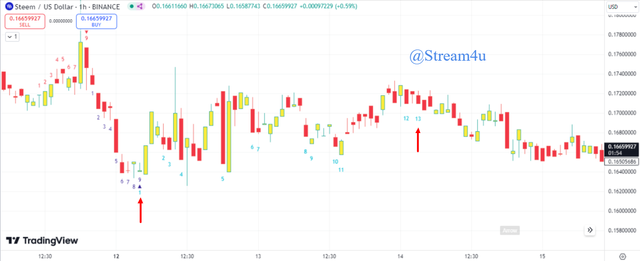
The above image represent the 1 hour price chart of STEEM/USDT. Starting from left shown by red arrow, the bullish TD Setup ends and the same candle draw number 1 for as start of TD Countdown. At this time due to number 1 appeared, traders hold their buy trades after completion of TD setup and waiting to complete the 13 candles for completion of TD Countdown to confirm the signal for up trend.
The next red arrow is the 13 candle level where TD Countdown is completed. Here, it can influenced traders to execute buy trades due to completion of TD Countdown after TD Setup which is indicate the up trend.
However, further we can see the up trend did not form instead the price of STEEM/USDT went down. This is example that not all indicator provides 100 % in their trade signals.
Question 5: TD Sequential-Based Trading Strategies with Steem.
Theory: Describe a trading strategy that uses the TD Sequential Indicator to trade the STEEM/USDT pair. How could this strategy be optimized to maximize profits and minimize risks?
➜ TD Sequential Indicator trading strategy to trade STEEM/USDT pair, first look at the 4 hour chart for STEEM/USDT to see if there is a TD setup form on a chart. Bullish TD Setup is defined by 9 continue price candles with each candle closing lower than the previous four candles, indicating probable selling weakness.
➜ Similarly, also look for bearish TD Setup which defined by 9 continue price candles with each candle closing higher than the previous four candles, indicating probable buying weakness.
➜ When TD Setup find, now watch for the TD Countdown to indicate a possible reversal. In a bullish, search for 13 continuous price candles with a close that is less than or equal to the closing two previous candles. In a bearish , watch for 13 continuous price candles with a close greater than or equal to the closing two previous candles.
➜ Once the TD countdown pattern finished place buy order if pattern was for bullish trend and if pattern was for bearish trend then place short trades.
➜ To limit potential losses if the expected reversal does not occur, set stop-loss orders just below the lowest point in the bullish TD Setup for buy trades and just above the highest point in the bearish TD Setup for short trades.
➜ To book profit after buy order executed. Look for completion of opposite pattern means if you buy after bullish TD Setup or TD Countdown, exit from the trade after completion of barish TD Setup or TD Countdown. Similarly, if you executed short order after bearish TD Setup or TD Countdown, exit from the trade after completion of bullish TD Setup or TD Countdown.
Practice: Implement this strategy on a demo account or trading simulator using recent historical data for STEEM. Present your results, including the number of winning/losing trades, and analyze the reasons for the strategy's performance.
In above we have STEEM/USDT 1 Hour Price Chart on which we have applied the luxalgo sequencer which has smilar concept of TD sequencer.
Start from left, we can see bearish TD Countdown is completed which indicate price will fall, however, the price did not fall but later on barish TD Setup again form. When TD Set up formed 9th candle and after completion that candle, it idicate possible next price will be down, so we can place short sell order. Further, we can see the price was fall.
Next, we can see the bullish TD Setup formed, after completing its 9th candle its indicated that the price will rise, so after 9th candle completed, we can exit from short sell trade and book the profilt. Now we can place buy order as bullish TD Setup formed nut here on the nith candle the TD countdown formed, so now we have to wait till 13th candle to confirm the trend reversal.
After bullish TD countdown 13th candle completed which confirmed trend reversal level and possible for price may gp up, so we can place here buy order. However, the trend did not revered instead price fall more. Here, our stop loss order hit that we set just below previous bullish TD Setup to avoid losses if trend did not reversed.
In this duration our winning trade was 1 and losing trade is also 1. However, we have set stop loss so overall in these both trade we are in profit.
Disclaimer: The information provided in this blog is for educational and informational purposes only. It should not be construed as investment advice or a recommendation to buy or sell any securities mentioned. Investing in the stock and crypto market involves risks, including the potential loss of principal. Readers are encouraged to conduct their own research and consult with a qualified financial advisor before making any investment decisions. The author of this blog is not liable for any losses or damages arising from the use of the information provided herein.
Author,
@steam4u
If you like this blog, you can join me in the comment section of this blog.
On Twitter X - Trading Steem with TD Sequential.
Upvoted. Thank You for sending some of your rewards to @null. It will make Steem stronger.
Your post has been upvoted in the steemexclusive tag. Subscribe our community for any post related to lifestyle.
Take part in the contests going on this week in our community. The competition links are mentioned below.
Thank you.
Hello @stream4u I hope you will be well and good. Nice to see a detailed post from you about the TD sequential indicator.
You are right that monitoring TD setup is critical and the traders must monitor and identify it Inna correct way.
For example if we are identifying the TD Countdown then we should keep in mind that it is only valid if there is a valid teld setup before this.
On the whole I will say that TD sequential indicator is a good approach to spot the reversal and exhaustion of the market.
Please friend, do you have an idea on a spreadsheet, can we form a teaching team for season 20 of the engagement challenge?
Sorry buddy, I really dont have much knowledge on spreadsheet regarding formulas and other features.
Okay.
Do you intend to apply to become a curator?
Yes I am thinking about it.
If you need a team member, contact me sir...
Okay lets build a team then. Any suggestion on Team name or not require?
Will drop our entry soon.
Lets talk it at the discord
Here my discord liasteem#7660
request sent.
I have sent you my message