Crypto Trading With Rate Of Change (ROC) Indicator - Crypto Academy /S4W8-Homework Post for @kouba01

Rate of Change (ROC) Indicator is a momentum based technical indicator that calculates the percentage difference between the current Asset price and its price a certain number of periods ago like what was the close price before 7 days or 20 days depending on what length you have set.
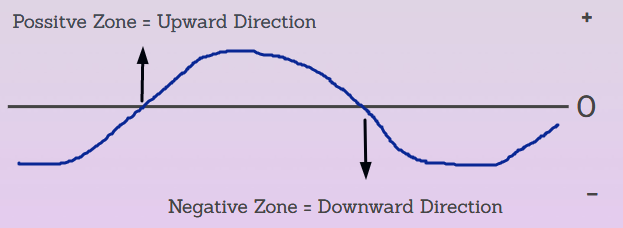
The concept or the understanding of the Rate of Change (ROC) Indicator is very simple, the ROC indicator is arranged against zero. When the value of the ROC indicator moves above the zero line at the positive zone means the asset price changes to the upward direction which means a positive side.
When the value of the ROC indicator moves below the zero line at the negative zone means the asset price changes to the downward direction which means a negative side.
The Momentum indicators are normally used in technical analysis to find the rate at which the upward or downward is moving hence the ROC indicator is one of the useful and simple indicators which helps for detecting divergences, as well as overbought and oversold zones.
The Rate of Change (ROC) Indicator is calculated by subtracting by the latest close price and the close price of a certain number of periods ago.
Based on the above result further, the result will divide with the close price of a certain number of periods ago, then to give % finally it will be multiplied by 100. The complete formula will look like below.
Latest Close Price - Previous Close Price / Previous Close Price X 100
Depending on the type of trader they can select what length they want, here I will use the same default value given by the charting platform which is 9 days, so according to today, we calculate the close price from yesterday's candle to the previous 9 days, see below example.
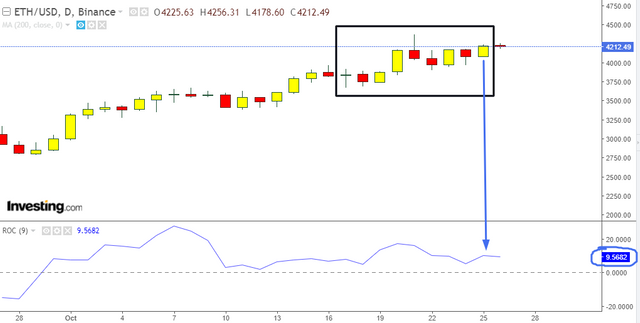
Latest Close Price: 4220.35
Close price last 9 days ago: 3844.63
4220.35 - 3844.63 / 3844.63 x 100 = 9.77%
Comment: According to the result, we can see on the chart that the current the value of Rate of Change (ROC) Indicator is close to our result, it is a positive side and also close to 0. This value can be different according to the length you can select as per the type of trader like short term, long term, day traders.

The Rate Of Change (ROC) Indicator is almost available on all charting platforms, here to show how to add Rate Of Change (ROC) Indicator on a chart, I will be using www.investing.com.
Below steps can be followed to add the Rate Of Change (ROC) Indicator on a chart.
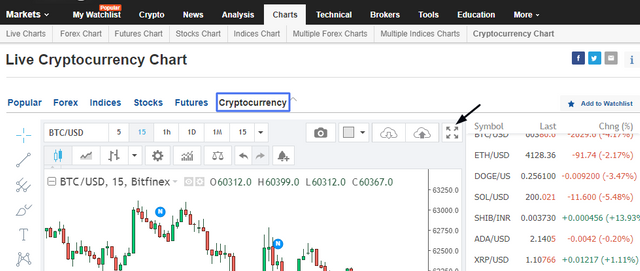
- Go to www.investing.com, click to Charts tab and then click to Cryptocurrency chart.

- The Cryptocurrency chart will get open, click to Fullscreen mode shown by the arrow.
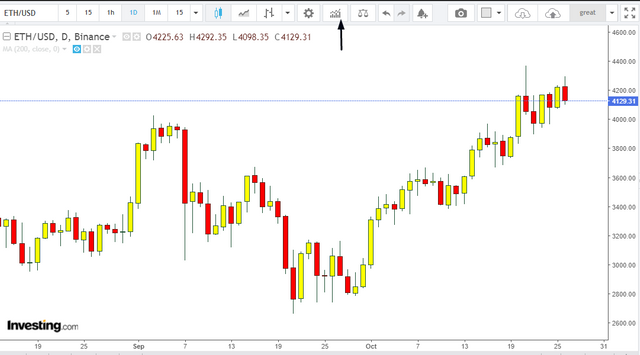
- The Cryptocurrency fullscreen chart will get open, click to the indicator option shown by the arrow.
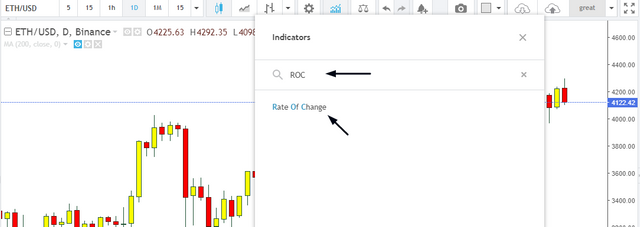
- Into the search box type ROC and it will show you the indicator, click on it to add Rate Of Change (ROC) Indicator to the chart.
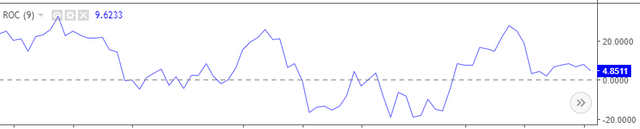
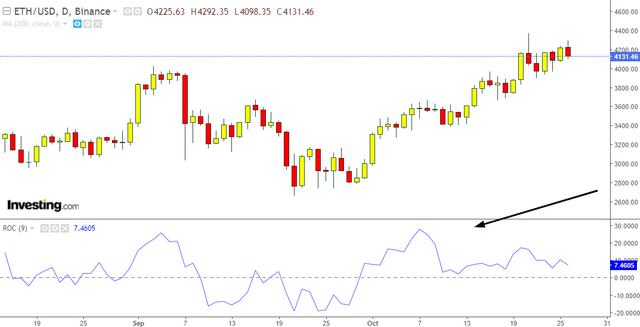
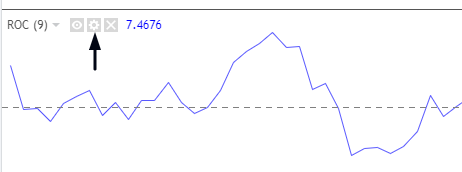
- Once you added, the Rate Of Change (ROC) Indicator will look like below on a chart.
- Click to the setting icon which calls as Format.
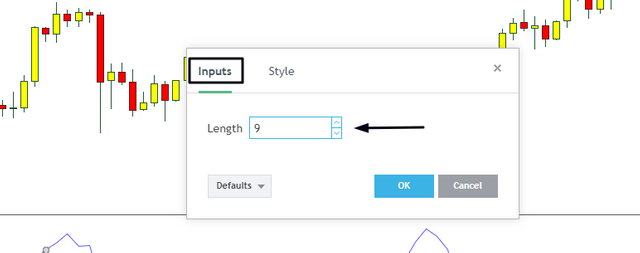
- The settings prompt will appear, under Input you can define the length of the period in days. Here you can change/modify the length of the period later on as per the success rate.
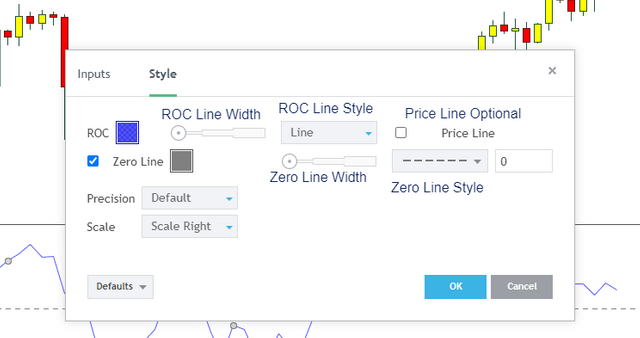
- Under Style, you can design how you want the indicator to look like, here you can set the width for zero line and ROC line, if you want zero line then a check box is given, also you can select a style for zero line and ROC line, a price line is an option if you want then you can add it. I have labeled each one below that can help you to configure the indicator.
On a couple of platforms that are TradingView, Investing.com the 9 days is the default length of the period. However, 12 days are also suggested by many articles for the length of the periods.
Depending on the success rate you can go for a respective either 9 or 12 days. Depending on the type of traders like Intraday traders, day traders the length of the periods may differ.
Until you find the best length of the period according to the success rate, I will suggest keeping a default as given by the charting platform.
The value of the Rate Of Change (ROC) Indicator moves towards the 0 levels. The trend can be confirmed by the Rate Of Change (ROC) Indicator when its value crosses zero level either down side or upside.
When the value of the Rate Of Change (ROC) Indicator started to move up from below which is the sign of reversal trend and bullish trend, but this bullish trend will be confirmed when the value of the Rate Of Change (ROC) Indicator crosses 0 levels from below and start moving above 0.
When the value of the Rate Of Change (ROC) Indicator started to down from up which is the sign of reversal trend and bearish trend, but this bearish trend will be confirmed when the value of the Rate Of Change (ROC) Indicator crosses 0 levels from above and start moving below 0.
- When the value of the Rate Of Change (ROC) Indicator crosses 0 to upside it considers a BUY decesion. However, as a trader, we should not immediately place buy as sometimes when the value of the Rate Of Change (ROC) Indicator crosses 0 to upside it quickly turns back hence we also have to look at the asset price if the value of the Rate Of Change (ROC) Indicator crosses 0 to upside and asset price is also moving up then it is a good time to go with BUY decision.
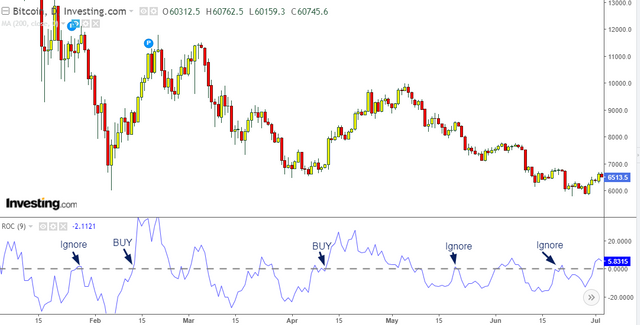
- When the value of the Rate Of Change (ROC) Indicator crosses 0 to the downside it considers a SELL decision. However, as a trader, we should not immediately place a Short sell or square off position as sometimes when the value of the Rate Of Change (ROC) Indicator crosses 0 to the downside it quickly turns back hence we also have to look at the asset price if the value of the Rate Of Change (ROC) Indicator crosses 0 to downside and asset price is also moving down then it is a good time to go with SELL decision.
According to the length of the period which is configured into a Rate Of Change (ROC) Indicator, if you look closely then you may see some common level from where the value of Rate Of Change (ROC) Indicator is bouncing back, like into the below image I have shown those level with Red line and Blue line.
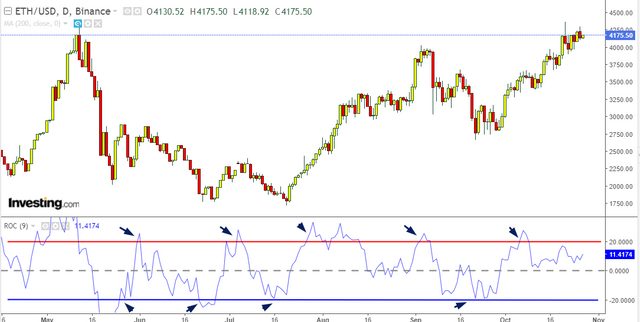
This ratio could be 10% or where around it, in the above example I have found the level of around +20 and -20 so Red line is at +20 and the Blue line is at -20.
According to the above image and explanation, when the value of the Rate Of Change (ROC) Indicator is touched or cross Red line, it will be identified signals for overbought, the short seller can take a position, and the trader who brought can think for a square of the position considering that the asset price will may go down.
Similarly, when the value of the Rate Of Change (ROC) Indicator is touched or cross the Blue line, it will be identified signals for Oversold, the short seller can think to the square of position, and the Buy trader can take a new position considering that the asset price will may go up.
While the current market trend is in Bullish or in Bearish movement, Rate Of Change (ROC) Indicator can help to signal for the current trend is about to end and possible for reverse trend.
The opposite movement between the value of the Rate Of Change (ROC) Indicator and the asset price can signal us prior about the current trend is about to end and possible for the reverse trend.
Bullish Divergence.
Bullish Divergence is when the asset price keeps moving downside like in a lower low pattern while at the same time the value of Rate Of Change (ROC) Indicator started to move upside, when such pattern is detected on a chart then this is indicating that the downtrend is about to end and possible for the uptrend.
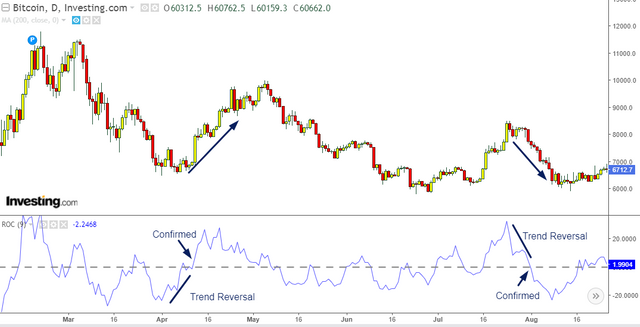
As per the above statement, we can see in the below chart that how the asset price is moving down while at the same time the value of the Rate Of Change (ROC) Indicator started to move upside, as this is an indication of end bearish trend, further we can see how the asset price moved upside which is reversal.
Bearish Divergence.
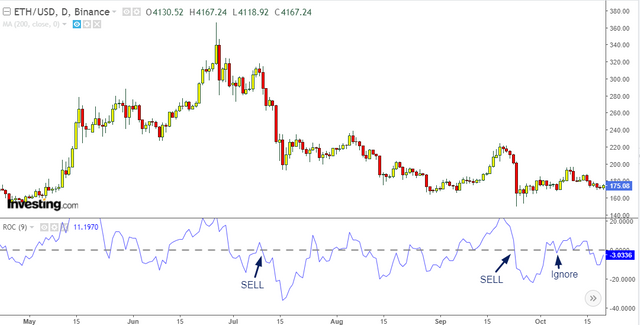
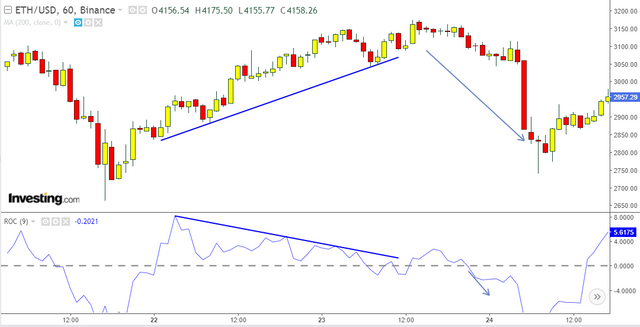
Opposite to Bullish Divergence, the Bearish Divergence is when the asset price keeps moving upside like in a higher high pattern while at the same time the value of Rate Of Change (ROC) Indicator moves downside, when such pattern is detected on a chart then this is indicating that the uptrend is about to end and possible for the downtrend.
As per the above statement, we can see in the below chart that how the asset price is moving up while at the same time the value of Rate Of Change (ROC) Indicator moves downside, as this is an indication of end bullish trend, further we can see how the asset price moved downside which is reversal.
Does Divergence Trading Strategy Produce False Signals?
Technical indicators are not 100% accurate every time, It is possible that the divergence trading strategy can produce false signals because we are identifying the next trend at the early stage, also the market sometimes play a sentimental role in which trader may lose their patience.
Depending on the last close price there might not much difference with the recent close price in such a scenario the Rate Of Change (ROC) Indicator may show trend reversal but from the level of 0, it may bounce back, just like the below scenario.
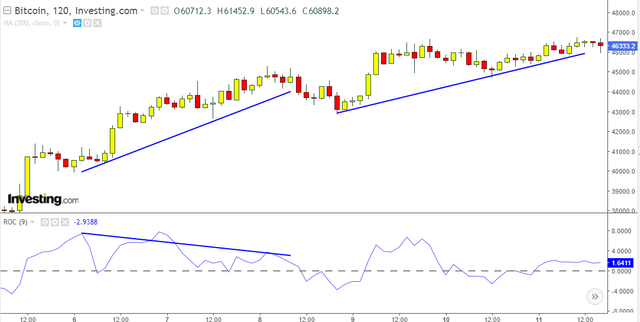
In the above scenario, the Rate Of Change (ROC) Indicator is indicating about the end of the uptrend by Divergence but further, we can see the uptrend has continued. The traders can be trapped in such a scenario.
For the trade safe side at such a scenario, we can use another indicator like Moving Average in pair with Rate Of Change (ROC) Indicator to confirm the signal about trend change.
As we know whether there is a huge volume appearing in the market then the price of the market move straight away at the one direction either down or up according to at which side the volume is available.
Using the Rate Of Change (ROC) Indicator we can find breakout level with a quite simple understanding.
When the value of Rate Of Change (ROC) Indicator swings close to 0 levels which mean the trend is constant mean no trend detected, here we can mark the top and bottom level from where the value of Rate Of Change (ROC) Indicator bounces back, accordingly will wait to see at which direction the value of Rate Of Change (ROC) Indicator can crosses, let's take below examples.
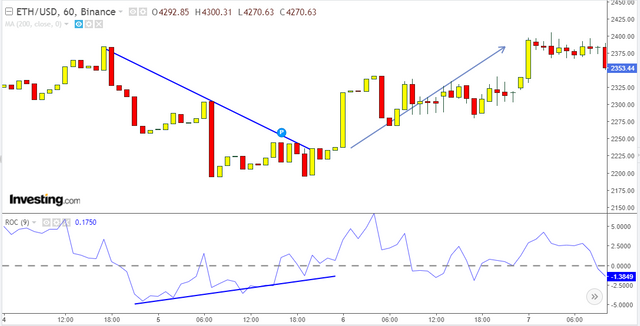
Bullish Breakout.
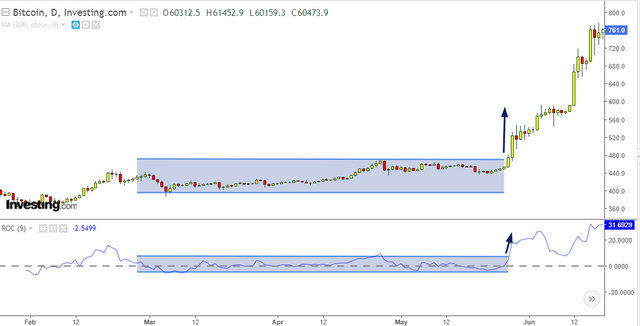
As per the above image, I have drawn a parrel level for top and bottom level in which the price is moving, till it is moving within this range the trend is not confirmed. Next, we see the value of Rate Of Change (ROC) Indicator has crossed upper side which is breakout given to the resistance, once it breaks and closes above that confirmed the breakout and bullish trend detected.
Bearish Breakout.
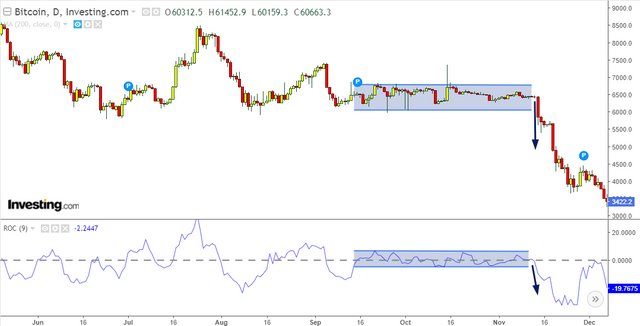
Similar to above, here also I have drawn a parrel level for top and bottom level in which the price is moving, till it is moving within this range the trend is not confirmed. Next, we see the value of Rate Of Change (ROC) Indicator has crossed below side which is breakout given to the bottom, once it breaks and closes below that confirmed the breakout and Bearish trend detected.
For current chart reading and defining various signals given by the Rate Of Change (ROC) Indicator, I will be reading the chart for MATIC/USD.
Below is the one-day chart of MATIC pair with USD, representing the chart from almost the start of July 2021 to today 27th October 2021. The chart is much crystal clear and I have already labeled all its given signals so it will help you to see what I find, now let's read it.
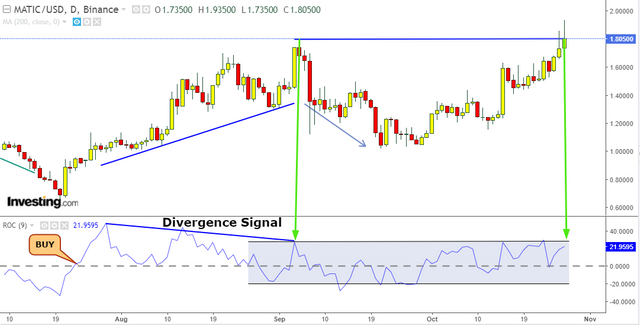
- From the left mid of July 2021, we can see the value of the Rate Of Change (ROC) Indicator has crossed 0 levels from below to up and started moving above 0 levels, here the Rate Of Change (ROC) Indicator has given BUY signals.
At this level, the short trader can think for square off the position and fresh traders go for a buy trade.
- Before the start of August to till September 1st week there was a Divergence Signals found as we can see the value of the Rate Of Change (ROC) Indicator is moving slowly down but the asset price is moving up like higher high pattern.
This is indicating us about the end of a bullish trend and possible for trend reversal which bearish trend. Next, we can see the asset price was dropped as per the Divergence indication.
- From around the same duration means around September 2021 1st week to today we can see the value of the Rate Of Change (ROC) Indicator is moving around 0 and within a range, this means the trend is yet to confirm, better to wait till breakout either downside or upside.
However, there are some small signals we can see within this range like Buy and sell but it may confuse whether hold or not, so better let's wait till the value of the Rate Of Change (ROC) Indicator gives breakout.
- Vertical big arrow on the left side around September 2021 1st week shows that its a level from where the price dropped and if we can see today the price was around the same level and the value of the Rate Of Change (ROC) Indicator is also close to giving breakout at the upper side, shown by big vertical arrow right side.
If the value of the Rate Of Change (ROC) Indicator gives breakout upside so it will be confirmed bullish, also resistance seen on asset price. But somehow it does not get breakout then the value of the Rate Of Change (ROC) will move back in the swing trend.
In the future, if it gives breakout at the downside then bearish will be confirmed.
Like all technical indicators, the Rate Of Change (ROC) Indicator also should be used in combination with another technical analysis indicator to get a majority and strong indications that can help for the trend confirmation.
The Rate Of Change (ROC) Indicator analyzes the frequency at which direction the prices are changing. This can help traders to look for bullish and bearish divergences.
Some patterns in the Rate Of Change (ROC) Indicator might be unreliable at times when sudden movements in the value of the Rate Of Change (ROC) Indicator, traders have to be very careful in such a situation.
Furthermore, according to the asset price the Rate Of Change (ROC) Indicator value approaches zero levels. During such instances, one must exercise caution since several false signals may occur.
#kouba-s4week8
#cryptoacademy
#india
Cc: @kouba01
Thank You.
@stream4u
Hello @stream4u,
Thank you for participating in the 7th Week Crypto Course in its 4th season and for your efforts to complete the suggested tasks, you deserve a Total|9.5/10 rating, according to the following scale:
My review :
Excellent content in which you were able to answer all questions related to the ROC indicator with a clear methodology and depth of analysis which is a testament to the outstanding research work you have done.
Thanks again for your effort, and we look forward to reading your next work.
Sincerely,@kouba01
Thank you @kouba01
Congratulations! Your post has been selected as a daily Steemit truffle! It is listed on rank 19 of all contributions awarded today. You can find the TOP DAILY TRUFFLE PICKS HERE.
I upvoted your contribution because to my mind your post is at least 10 SBD worth and should receive 26 votes. It's now up to the lovely Steemit community to make this come true.
I am
TrufflePig, an Artificial Intelligence Bot that helps minnows and content curators using Machine Learning. If you are curious how I select content, you can find an explanation here!Have a nice day and sincerely yours,

TrufflePig#club5050 😀
#club5050 😀