Understanding Trends - Crypto Academy / S5W1- Homework Post for @reminiscence01
Hello everybody.
Welcome to the Season 5 of Steemit Crypto Academy and especially welcome to this post. Hopefully, all of you will be good and happy and enjoying your good health with the grace and blessings of Almighty Allah. This post is actually the homework post for dear professor @reminiscence01 in Week 1 of the Season 5 of Steemit Crypto Academy. The lecture's post was explained nicely and I have understood all the concepts in the lecture. So, without any wastage of time, turn to today's task.

There are some questions that are asked by the dear professor as the assignment of this week and I will explain all of them in the given order.
Question : 01
(a)
What do you understand by a Trending market?
As we all know that the prices of cryptocurrencies are so volatile that we cannot expect the next move of the market. The crypto markets are of two types. The market could be ranging or trending. Ranging Market is that market that remains in a particular range and this range bounces off between the support and the resistance levels. So, now I will explain the trending market in detail.
A Trending Market, as referred to by the name, is a market that follows a specific trend. As we know that in our daily life, a trending thing is that which is becoming popular. The trend of this thing could be positive or negative. So, the same is the case with the trending market. It is a market that follows a particular trend. This trend could be in a positive (upward) direction or in a negative (downward) direction.
A trending market is a market that continuously moves in a particular direction. This movement of the price is called a trend. This trend could be in an upward direction or in a downward direction. Yes, the trend could also be in a downward direction. The trend of the market is based on the forces of demand and supply created by the buyers and sellers of the market.
If the trend of the market is in the upward direction then it will be called as Uptrend and if the trend of the market is in the downward direction then it will be called as Downtrend. If the buyers are in a strong position, the demand for assets will be high and this will be an uptrend and if the sellers are in a strong position then the supply of the asset will be high and this will be a downtrend.
Before trading in a particular asset, it is very important for all traders to understand the trend of the market. If a trader enters the market according to the trend then this will be in the favor of the trader but if the trader enters a market by opposing the trend of the market then this thing can harm the trading strategy of the trader.

(b)
What is a bullish and a bearish trend? (screenshot required)
As we have discussed before that the trending market is that which follows a specific trend. The flow of the price of the asset is in a particular direction (according to the force of supply and demand). The trending market could be of two types. The details of these both are as follows.
- Bullish Trend
- Bearish Trend
Let's discuss both types in detail. So, have a look on.
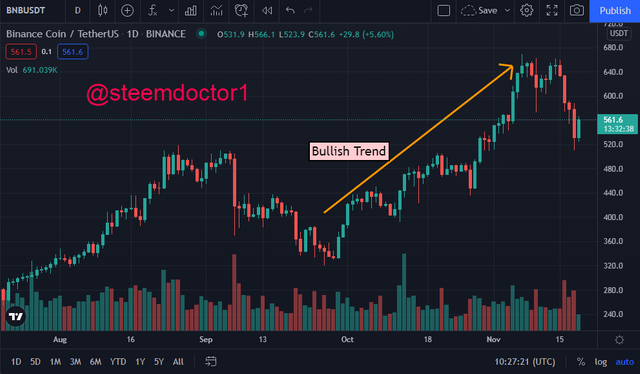
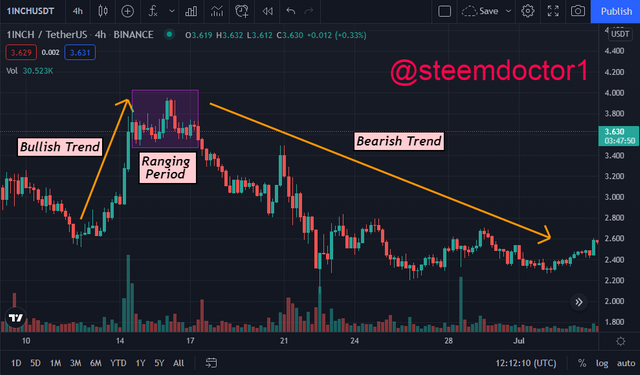
The continuous upward movement of the price of assets is called as Bullish trend. A Bullish trend forms higher-high and higher-low points. This simply means that the closing point of the first bullish candle is lower than the closing point of the second bullish candle. The upward trend of the market shows that the buyers are in a strong position in the market. The whales are entering the market and they are responsible for pushing the price higher and higher.
When the price action of a market follows a Bullish trend, this period is also called Bull Season. The demand for the asset in the market increases as buyers are entering the market and the volume of that asset is mostly increased gradually.
Following is an example of a Bullish Trend.
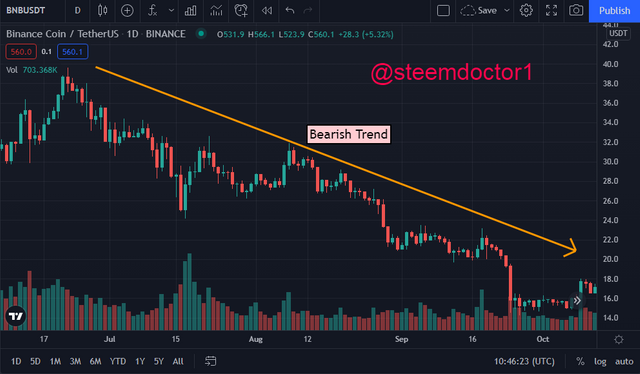
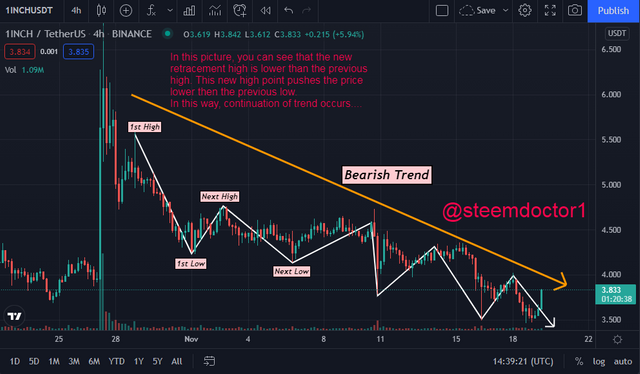
The continuous downward movement of the price of assets is called as Bearish trend. A Bearish trend forms lower-high and lower-low points. This simply means that the closing point of every bearish candle is lower than the closing point of the previous bearish candle. The downward trend of the market shows that the sellers are in a strong position in the market. The whales leave the market by extracting their profits and they are responsible for pushing the price lower and lower.
When the price action of a market follows a Bearish trend, this period is also called Bear Season. The supply for the asset in the market increases as sellers are more than buyers in the market.
Following is an example of a Bearish Trend.
(02)
Explain the following trend identification and give an example of each of them. (Original screenshot needed from your chart). Do this for a bullish and a bearish trend.
Market structure is the basic thing in the technical analysis of the charts of different cryptocurrencies. By understanding the market structures, one can easily predict that whether the market is in an uptrend (Bullish), a downtrend (Bearish), or range. The market structure provides us with basic information about the current state or condition of the market. This can easily be understood by the price charts. These market structures could be:
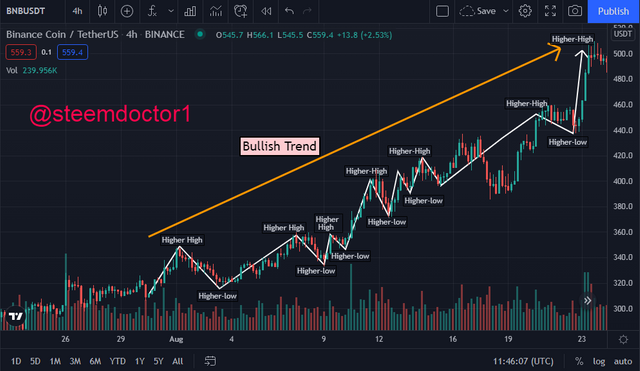
- Bullish Trend:-
During the Bullish trend, the price action in the chart shows a higher-high and higher-low formation. This simply means that the closing point of the next candle is higher than the closing point of the previous one. And this also means that the price of the asset does not trade below the previous low point and also closed above the previous high. This thing shows that the price of the asset is increasing gradually.
A trader can make a good entry in a Bullish Trend by understanding the market structures of the Bullish Trend. He can enter the market at falling candle and can take profit a the rising candle. An example is shown in the below screenshot.
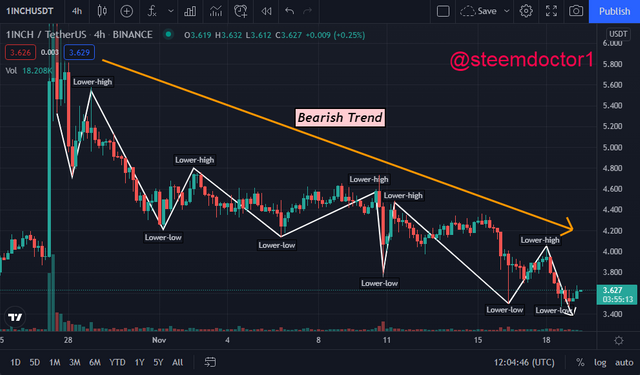
- Bearish Trend:-
During the Bearish trend, the price action in the chart shows a lower-high and lower-low formation. This simply means that the closing point of the next bearish candle is lower than the closing point of the previous one. And this also means that the price of the asset does not trade above the previous high point and also closed below the previous low. This thing shows that the price of the asset is decreasing gradually.
A trader can make a good entry in a Bearish Trend by understanding the market structures of the Bearish Trend. He can enter the market at falling candle and can take profit a the rising candle. An example is shown in the below screenshot.
- Ranging Market:-
Sometimes, the market does not follow a particular trend (Downward or Upward) but remains between some limits or boundaries. This type of market is called a ranging market. The falls and rises are identical by support and resistance levels. An example is as below.
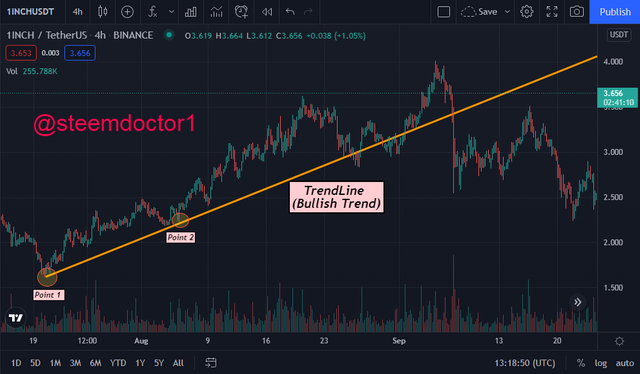
The trendline is also a technical analysis tool that is used for the identification of the trend, which the market is currently following. It is a very useful tool to identify the direction of the market. A trendline can be simply drawn by joining two low points for an uptrend and two high points for a downtrend. The intersection of the trendline shows that the current trend has been stopped.
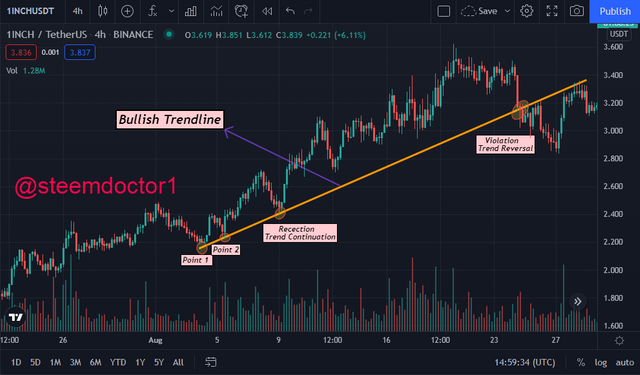
Bullish Trend:-
In the bullish trend, the trendline is drawn by joining two low points. The price action can be seen above the trendline in the uptrend. When the low points touch the trendline, it becomes the support and the price goes up again. But when the high point touches the trendline, the trend is going to be broken. So, the traders can easily spot their entry points at the support level and can make good trading decisions. An example is as follows.
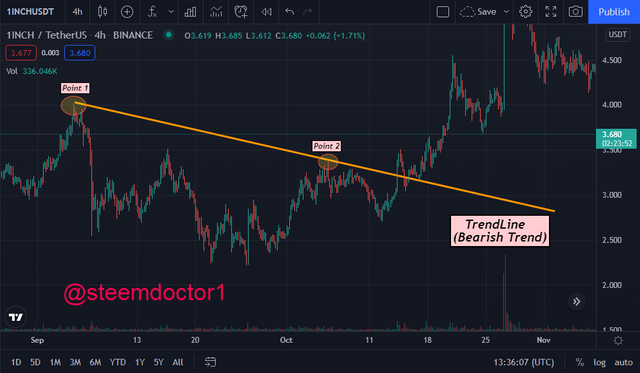
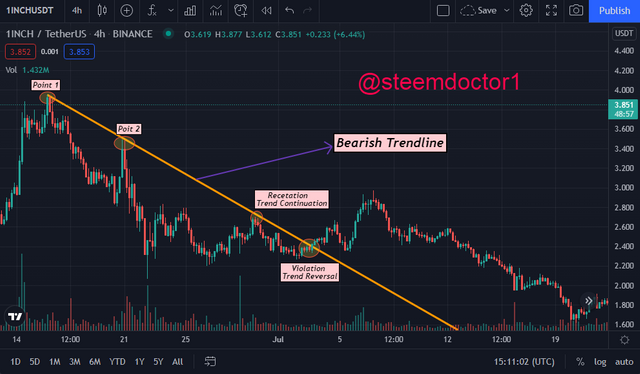
- Bearish Trend:-
In the bearish trend, the trendline is drawn by joining two high points. The price action can be seen below the trendline in the downtrend. When the high points touch the trendline, it becomes the resistance and the price goes down again. But when the low point touches the trendline, the trend is going to be broken. So, the traders can make good trading decisions by understanding the trend. An example is as follows.
(03)
Explain trend continuation and how to spot them using market structure and trendlines. (Screenshot needed). Do this for both bullish and bearish trends.
A trending market does not show a straight upward or downward line but the price action forms an irregular (zig-zag) pattern. The price action fluctuates and this way up and down repetition occurs in the price action. When the uptrend proceeds, the investors start taking profit and start exiting the market and the price goes a bit down. And when a downward trend proceeds, the buyers start entering the market and in this way, the price goes a bit high. In this way, the continuation of the trend becomes possible. These fluctuations could be profitable for the traders. To determine whether a trend is to be continued or broken, trend continuation can be spotted by both, Market structure and Trendline. So, have a look at them briefly.
We can use the market structures to mark the trend continuation points as follows.
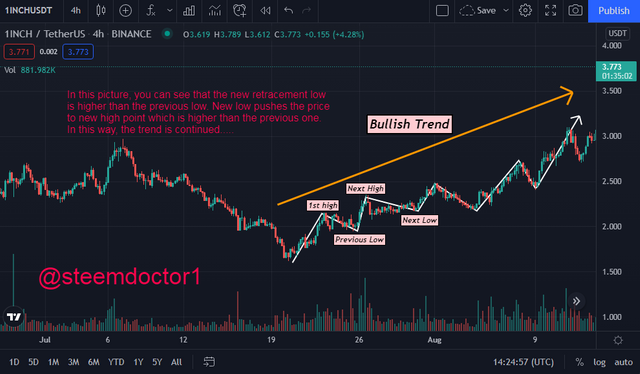
- In Bullish Trend:-
Two points must be kept in view before deciding whether the trend is going to be continued or broken. These points are as follows.
=> The next high point must be higher than the previous high.
=> The next low point must be higher than the previous low point.
In a bullish trend, after a strong bull, the retracement occurs. This means that sellers tried to take control of the price and the price goes a bit low but the buyers do not allow them to do this. They enter the market strongly to ensure the continuation of the uptrend. An example is as below.
In Bearish Trend:-
Two points must be kept in view before deciding whether the trend is going to be continued or broken. These points are as follows.
=> The next high point must be lower than the previous high.
=> The next low point must be lower than the previous low point.
In a bearish trend, after a strong bear, the retracement occurs. This means that buyers tried to take control of the price and the price goes a bit high but the sellers do not allow them to do this. They exit the market strongly to ensure the continuation of the uptrend. An example is as below.
Spotting the Trend Continuation is only possible unless the price action does not break the trendline. If the trendline is intersected by the price action, the trend reversal could be possible.
For Bullish Trend:-
For Bull, the trend is continued if the low point touches the trendline but when the price action cuts the trendline, the bullish trend is broken and a trend reversal is possible. It can be seen in the below screenshot.
- For Bearish Trend:-
For Bull, the trend is continued if the high point touches the trendline but when the price action cuts the trendline, the bearish trend is broken and a trend reversal is possible. It can be seen in the below screenshot.
(04)
Pick up any crypto-asset chart and answer the following questions.
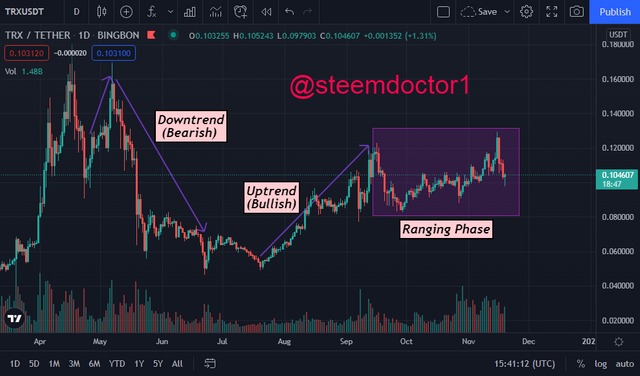
For the accomplishment of this task, I am going to select the TRX/USDT pair. I set the chart to the 1D timeframe. The TRX market is not trending at this time. The price action shown by the chart is not following any particular direction. However, it remains in a particular limit and it is better to say that it is a ranging phase.
As I have discussed before that the market of TRX/USDT is not trending at this time. It was in an uptrend in the previous month but now it is a ranging market. At the start of this month, the price makes a high trend but could not manage to continue the trend anymore. It could be said that this is a low position and the uptrend is going to happen. But no one can predict the future accurately due to the high volatility of the markets. So, the technical analysis could be done along with other technical analysis tools like indicators, etc.
Conclusions
As we all know that the market of cryptocurrencies is much volatile. A market could be trending or ranging. A trending market is that in which the price action in that chart follows a particular trend. The continuous upward trend is called Bullish while the continuous downward trend is called the Bearish trend. A ranging market is that in which the price of the asset remains in a particular range forming the support and resistance levels.
The trend of the market can be determined by the market structure and the trendline. Market structure and trendlines are the technical analysis tools that are used with other tools for making better trading decisions and ensuring profitable trading.
So, that's all about the task for this week. Hopefully, all of you will like this post.
Writer: @steemdoctor1 (Crypto Student)

Hello @steemdoctor1 , I’m glad you participated in the 1st week Season 5 of the Beginner’s class at the Steemit Crypto Academy. Your grades in this task are as follows:
Recommendation / Feedback:
Thank you for participating in this homework task.
Thanks a lot dear professor.