TRX/USDT - Steemit Crypto Academy | S6W1 | Team Trading Competition Post for fredquantum-kouba01 Traders Team
Hello everybody.
Welcome to this post. Hopefully, all of you will be good and happy and enjoying good health with the grace and blessings of Almighty Allah. As we know that there is a new initiative in the Crypto Academy Season 6 that is Crypto Trading Competitions. Thanks to the Steemit Team for providing us with such an amazing opportunity to utilize the knowledge that we gained from the academy so far in the real trades. So, let's move towards our task without any delay.

This is my 3rd trade this week and I am going to open a buy trade in the TRX/USDT pair. Let's discuss the reason for selecting this pair and the trade-in details.

Coin and Exchange Name
For this trade, I have selected the TRX/USDT pair. I will open a buy position in this pair after doing the technical analysis of the price chart and thus I will try my best to execute a profitable trade.
In my opinion, the TRX/USDT pair is a very strong pair for short-term traders. I personally like this pair as I used to make trades in this pair and I got valuable profits. TRX is one of the strongest coins at this time and it is also standing in the top 30 cryptocurrencies at this time. Although the price of this coin is low its use cases and market capitalization is likely to be so amazing that every trader is attracted by this token.
I have selected the Binance exchange because I personally like it very much. It is quite simple to use and also it is a very safe and secure exchange for trading cryptocurrencies. I have also used a number of other exchanges like Poloniex, Huobi Global, etc. But I liked the features of the Binance exchange very much and I am familiar with most of the features of the Binance exchange.
Binance Exchange is the most popular centralized exchange of the time. Its popularity is due to its number of unique and useful features. It allows the users to trade almost all of the good crypto pairs. The P2P trading and the Margin trading of this exchange are also impressive. It allows the users to set the leverage of the futures trades up to 125x which is really impressive. There are also many other unique features of this exchange that made this exchange listed on top in my book of trading.
Fundamental Analysis of Tron (TRX)
- Introduction and History:
TRX is actually the native currency of the TRON blockchain. TRX is one of the most popular coins at this time. TRON blockchain is actually a decentralized digital platform that allows users to enjoy the cost-effective sharing of digital content internationally.

TRON blockchain was developed in 2017 by a crypto enthusiast named Sir. Justin Sun, the current CEO of Tron and also involved in the development of Bit-Torrent and Ripple. Thanks to him for providing such an amazing decentralized platform where the users can organize their own Decentralized Applications (DApps), sell their content to the consumers directly, make free transactions, as well.

TRX is used by the users of the Tron blockchain to access the Decentralized Applications that are developed by their creators. The content creators on the Tron blockchain are also at a great advantage in that they do not have to pay the transaction fees. The main moto behind the development of this blockchain was to overcome the Scalability problem of the popular cryptocurrencies, Bitcoin and Ethereum.
The transactions per second (TPS) of the Tron blockchain is proclaimed by the developers that it can manage up to 2000 transactions per second without any fee. While the TPS of Bitcoin is only 6 and that of Ethereum is only 25. This is one of the most amazing features of the Tron blockchain. So, we can clearly say that the future of the Tron Blockchain is very bright.
- CoinMarketCap of TRX:
We can also get the basic information about any cryptocurrency by exploring the CoinMarketCap. So, I also get some fundamental details about the TRX coin from this platform. Let's have a look at the below screenshot.
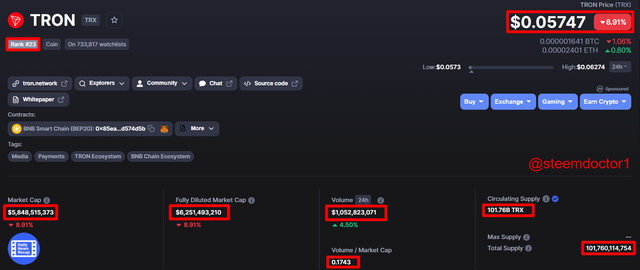
The information that is obtained from the above screenshot can also be presented in the form of a table, as follow.
| Coin Name | TRX (Tron) |
|---|---|
| Nick Name | TRX |
| Rank | 23 |
| Current Price | $0.05747 |
| Market Cap | $5,848,515,373 |
| Fully Diluted Market Cap | $6,251,493,210 |
| Market Volume | $1,052,823,071 |
| Volume / Market Cap | 0.1743 |
| Circulating Supply | 101.76B TRX |
| Total Supply | 101,760,114,754 |
- Historical Price Data:
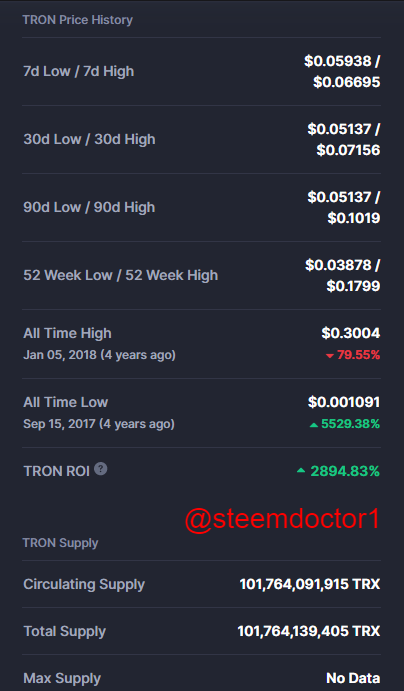
From the above screenshot, we can observe that the All-time High price of TRX is $0.3004 (05, January 2018) and the All-Time Low price of TRX is $0.001091 (15, September 2017).
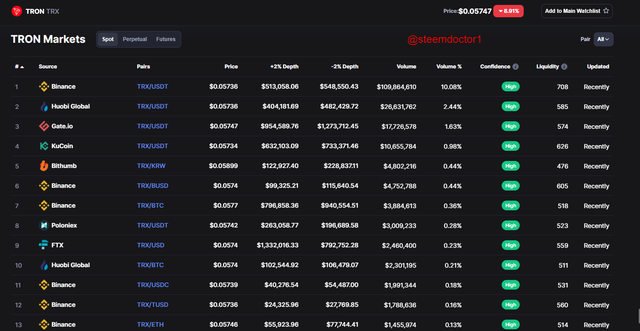
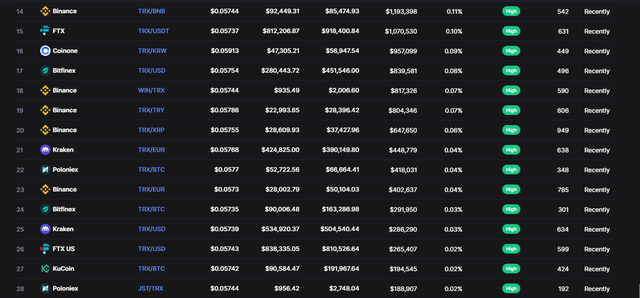
- Available Markets:
As I have discussed that TRX is one of the most popular cryptocurrencies so far. So, it is available for trading and exchanging in almost all of the popular exchanges. Some of them are shown in the below screenshot.
Technical Analysis of TRX/USDT pair
As we all know that the market of cryptocurrencies is so volatile that it is very risky to make any trade in the market. SO, it is advisable to analyze the market properly before making any trade in the market. There are actually three types of analysis, Fundamental Analysis, Sentimental Analysis, and Technical Analysis. But I am actually a technical analyst as it is very effective and profitable.
To analyze the market of the TRX/USDT pair, I used three different types of indicators that are Relative Strength Index (RSI), Parabolic SAR, and Moving Averages (MA). Each of them is discussed below.
- Parabolic SAR:
Parabolic SAR or simply known as SAR is one of the most commonly used technical indicators in crypto trading. It actually consists of a dotted line that either moves above or below the price action. It is very useful in the determination of market trends. When the dots of the Parabolic SAR are moving above the price action, it is a signal of the Bearish trend and when the dots of the Parabolic SAR are moving below the price action then it is a signal of Bullish trend.
- Relative Strength Index (RSI):
RSI is also one of the most popular technical analysis tools that are used to determine Oversold and Overbought regions in the market. It actually ranges from 1 to 100 in RSI. When the RSI line is above the 70 range, it is the Overbought region and a Bearish trend is to be expected. On the other hand, when the RSI line is below the 30 range, it is the Oversold region and a Bullish trend is to be expected.
- Moving Average (MA):
I have also used Moving Average (MA) indicator in my technical analysis. It consists of a line that is moving either above or below the price action. When the MA line is moving below the price action, it is a Bullish trend signal and when the MA line is moving above the price action then it is a Bearish signal. Users can use this indicator for determining the trend reversals.
I applied all the above indicators on the TRX/USDT chart to get a better entry position. Have a look at the below image.
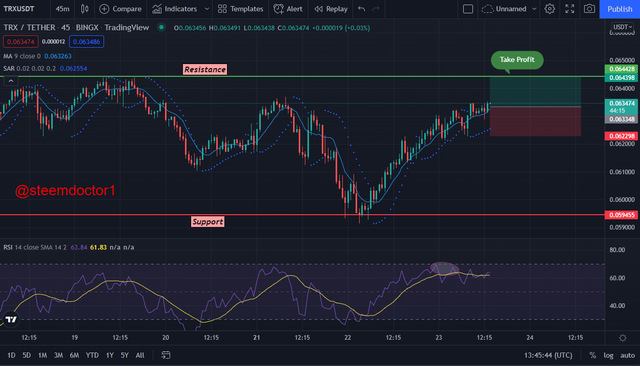
You can see in the above image that I have applied three different indicators on the TRX/USDT chart. I adopted the below steps to get this chart.
First of all, I opened the chart of TRX/USDT and set the timeframe to 45 minutes. Then, I drew the Support and Resistance levels on the chart, as you can see in the above screenshot. I applied the RSI, MA, and SAR indicators on the chart and observed that a Bullish trend is coming soon. I made this decision by keeping the following points in my view.
The line of the MA indicator was moving below the price action line as it was a bullish trend. The movement of the MA line below the price action is a signal of the bullish trend.
Second, the dotted line of the Parabolic SAR indicator is also moving below the price action because it was a bullish trend. The movement of the SAR line below the price action is also a signal of the bullish trend.
Third, the line of the RSI indicator had just made an Oversold region, and then it was just moving upward and near the mid-line. This condition is also an indication of an upcoming bullish trend.
By keeping these points in my view, I decided to make an entry into the market in order to make a profit when the price goes up. You can see in the above screenshot that I have mentioned my entry point in the market.
It is always advisable to manage the risk before making any entry into the volatile market of cryptocurrencies. So, I set the Take profit Level just above the previous resistance and also the Stop Loss point in 1:1.
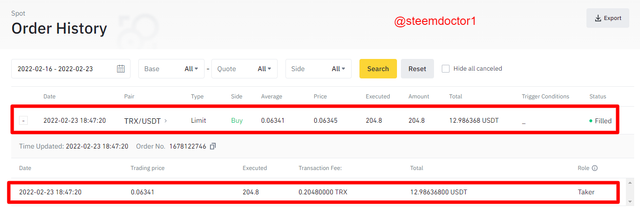
By keeping in view the following facts, I made a buy Spot Trade on the Binance Exchange. I made an entry in the market at 0.0634. The proof of the transaction can be seen in the following screenshot that is taken from the Trade History of my account on Binance.
My Plans For Keeping or Selling it and Recommendations for others
As I have discussed above that the TRX/USDT is in a buy position and I have also made an entry into the market. The market was already in a bullish trend and during this upward trend, it made a retracement and I decided to took advantage of this retracement. So, I made an Intraday trade. I am not going to hold TRX for a long time as the market was already in a Bullish trend.
So, I will not keep this trade for the long term and close my position when I found an appropriate level. I will sell the assets when the price touches my Take Profit Level and thus I could be able to make a reasonable profit. Then I, being a scalp trader, consider another pair for scalping and get profit.
- Recommendations for Others:
In my opinion, I will not recommend any other trader to enter the market for long-term investment. However, I will advise others to make an entry at this position and then wait for a while and if they are found a bit profit, sell the assets are move on towards another pair.
So, my recommendation for others is that they can take risks and make an entry into the market at this time and then close their position when the market moves a bit above. This is a way of safe trading. Actually, I think that TRX is not appropriate for long-term investment but it can be profitable for scalping.
The above discussed are only my suggestions or recommendation but the traders could not totally rely on me as I am not an investment advisor. One must have to make their own analysis before entering the market. People must have to manage the risks before entering the crypto market due to the volatile nature of the market.
Additional Information about Tron (TRX)
We can also find the social media accounts of the Tron Blockchain. We can follow these social media accounts to be active as well as to get updated about any news of the Tron Blockchain or TRX.
- Twitter:

- YouTube:
- Instagram:

- Reddit:

Discord of TRON DAO : https://discord.gg/hqKvyAM
Telegram of TRON DAO: https://t.me/tronnetworkEN
Mentioned above are the social media accounts of the Tron blockchain DAO. We can follow these accounts and stay tuned to get updated about the important and new information or news about the Tron blockchain.
- Whitepaper of TRON: https://developers.tron.network/docs
Conclusions
In this post, I have made a buy trade by doing the technical analysis of the TRX/USDT chart. I used three different technical analysis tools that are Relative Strength Index (RSI), Moving Averages (MA), and Parabolic SAR. By analyzing the market, I opened a buy trade and set the Take Profit and Stop Loss points in the ratio of 1:1.
Thanks to dear professors @kouba01 and @fredquantum for such an amazing opportunity by leading an amazing team.
Writer: @steemdoctor1 (Crypto Student)

Hello @steemdoctor1,
Thank you for choosing our team to participate in the 1st week of Season 6 of this trading competition, hoping that you will make gains during this period, you deserve a Total|9.5/ 10 rating, according to the following scale:
My opinion on your choice of pair:
The Tron crypto is a value that, beyond the Tron Dollar price, has real utility and great potential. It gives its owner the right to vote on the governance of one of the most adopted blockchains in the world. The value of Tron (TRX) has not seen a dramatic rise since the beginning of the bull cycle, which leads us to believe that the upside potential remains very high in the months to come.
My opinion on your trading style:
You have analyzed the TRX/USDT pair course well by combining several indicators (Parabolic Sar, RSI, MA), and choosing a good moment to enter. Also I liked the way to change your trading style according to your analyzes by going from scalping to intraday.
We thank you again for your effort and we look forward to reading your next article.
Sincerely, @kouba01