Recognizing Simple Patterns in Trading - Crypto Academy / S5W2 - Homework Post for @sachin08
Hello everybody.
Welcome to this post. Hopefully, all of you will be good and happy and enjoying your health with the grace and blessings of Almighty Allah. Today, I am here to present the homework post for dear professor @sachin08 in Week 2 of Season 5 of Steemit Crypto Academy. The lecture was greatly explained by my dear professor and I have understood all the concepts that were explained in the lecture. And now, I am going to make homework for it. So, let's turn towards our task without any wastage of time.

There are some questions that are asked by the professor as the assignment for this week and I will explain all of them in the given order.

(01)
What is your understanding about Triangles in Trading. Explain all forms of triangles in your own words. (Screenshot required)
As we all know that the market of cryptocurrencies is so volatile that the newcomers cannot understand the movement of the price in the chart. However, there are some technical analysis tools that are proved to be helpful for the traders to predict the next movement of the market. In this way, the new traders can make their trading decisions by believing in a particular indicator (according to the trading strategy).
There is another way to predict the behavior of the market and make good decisions in the market. This way is known as Recognization of Patterns in Trading. In this type of analysis, the traders can predict the movements of the market by recognizing different patterns that are formed by the price action in the chart of a particular asset. There are many patterns that are formed in the charts. Let's have a look at them separately.
The first pattern that is formed by the price action in the chart of an asset is the Triangle. This pattern is very simple as we all know that a closed figure with three corners is called a Triangle. This pattern is very useful for the new traders to understand the flow of the market and make better trading decisions that reward them with good profit.
In the markets that are forming the triangular patterns, the triangle is formed between the lines of support and resistance levels. At the end of triangles, the price action shows a breakdown that decides whether the trend(bullish or bearish) will be continued or a trend reversal is going to happen. This way, the new traders get the benefit from this pattern. There are further three types of triangle patterns that are as follows.
- Symmetrical Triangles:-
It is a type of triangular pattern in which both (Support and Resistance) lines move towards each other forming slides. The resistance line moves downward to support and the support line moves upwards to resistance. At last, both of these lines meet with each other at a point and this point is known as the breakout point. The price can move either upward by forming a bull trend or downward by forming a bear trend.
There could be two possibilities, the trend line or price action could intersect the resistance line(upper line) or intersect the support line. If the trend line cuts the upper (resistance) line, there will be an upward trend and if the trend line cuts the lower (support) line then there will be a downtrend. The chances of a breakout are 50 50 in both directions in this type of pattern. Let's have a look at a symmetrical triangle formed by the price action.
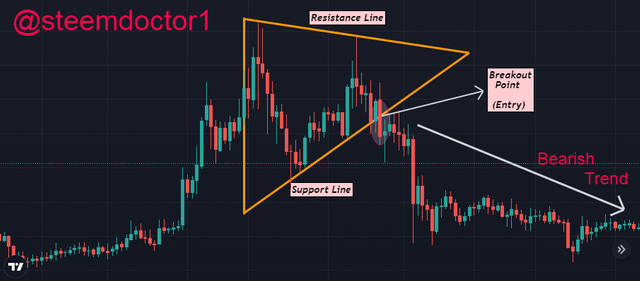
You can see in the above screenshot that the resistance line moves downward while the support line moves upward forming a triangle. The trend line cuts the lower line at the breakout point so the Bullish Trend started.
- Ascending Triangles:-
The triangular pattern which is formed by the combination of a straight resistance line and an upward rising support line is called as ascending triangle. In this type of triangle, the straight line is taken as a resistance line and a rising support line intersect the upper line.
The price action line cuts the upper straight resistance line and the price of asset bounces off after the breakout point. The traders can enter the market at breakout price and set the stop loss just below the straight line so that he could not be in danger if the market goes unexpected. Let's have a look at the example of an ascending triangle.
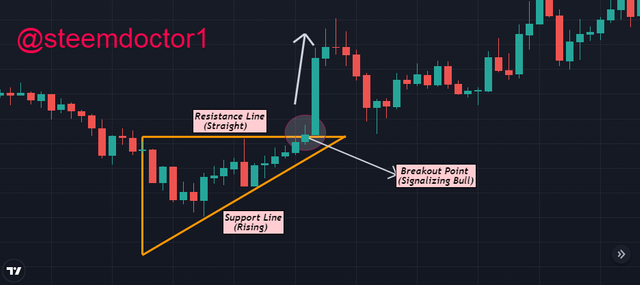
In the above screenshot, we can see that the price of asset shows a bull movement when the price action line cuts the upper straight resistance line of the triangle. This is known as Ascending Triangle.
- Descending Triangle:-
The descending triangle is just the mirror image of the ascending triangle. The triangular pattern which is formed by the combination of a straight support line and a downward falling resistence line is called as descending triangle. In this type of triangle, the straight line is taken as a support line and a falling resistence line intersects the lower line.
The price action line cuts the lower straight support line and the price of asset falls off after the breakout point. Let's have a look at the example of an ascending triangle.
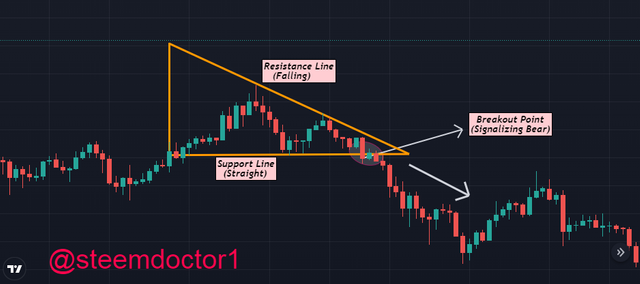
In the above screenshot, we can see that the price of asset shows a bear movement when the price action line cuts the lower straight support line of the triangle. This is known as Descending Triangle.
(02)
Can we also use some Indicators along with it Triangle Patterns? Explain with Screenshots.
As we all know that the there is no such technical analysis tool that gives perfect and accurate prediction of the chart. So, the same is the case with the patterns study. We can not completely depend upon the entry or exit signals that are given by the breakout points in this technical analysis. We can use other technical analysis tools like the indicators along with triangle patterns to confirm the signals.
I often use the RSI indicator to indicate the oversold and overbought levels, as well as, to predict the trend of the market. So, by using this indiator I make my enteries in the markets. Now, I am going to apply the RSI indicator on the chart of an asset that is forming a bull triangle. So, have a look.
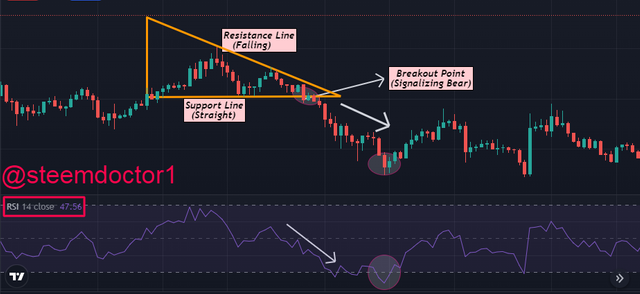
In the above screenshot, we can see that the descending triangle and the RSI indicator indicates the bull movement at the same time and after a few time both of them also shows an oversold region. So, now we will confirm the signals along with another indicator known as Bollinger Bands. So, have a look.
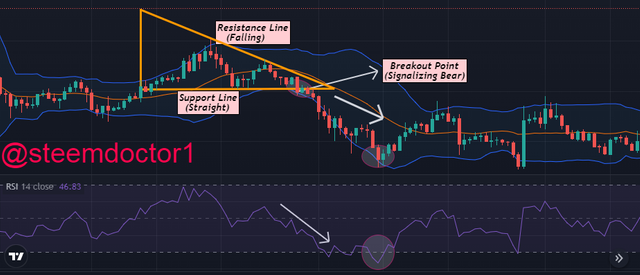
In the above screenshot, we can see that all of the technical analysis tools (Descending Triangle, RSI and Bollinger Bands) show the same behavior of the market and show the oversold and change of trend at the same time. So, it is cleared that the indicators can be used with triangle patterns to confirm the signals.
(03)
Explain Flags in Trading in your own words and provide screenshots of both Bull Flag and Bear Flag.
Another impressive pattern that is followed by the price action line in the market of an asset is the Flags pattern. We can say that the flag pattern is the modified and even more impressive form of the triangle pattern. A flag pattern is formed in a market when the price of that asset followed a strong trend (either Bullish or Bearish) and after that strong trend the breakout occurs and the price goes to a ranging phase for a time.
The strong bull or bear trend acts as the pole of the flag and the ranging phase in which the market moves in a particular boundary for a while, is called the body of the flag. When the price of an asset forms a flag pattern in the chart then there is the need for a breakout point that decides whether the market will continue its trend or a trend reversal is going to happen. Traders should wait for that breakout point and make short or long entry decisions according to the signal given by that breakout point.
There are two types of flag patterns that are as follows.
- Bull Flag:-
A Bull flag is formed by the price when the price enters a ranging or consolation phase after a strong bullish trend. The flag that is formed in this type points towards the downside. Now, if the price action line cuts the resistance line of the flag body, we could expect a bull trend and an entry position for a long trade. And if the trendline cuts the support line, a trend reversal could be possible. Have a look at a Bull flag in the below screenshot.
- Bear Flag:-
A Bear flag is formed by the price when the price enters a ranging or consolation phase after a strong bearish trend. The flag that is formed in this type, points towards the upside. Now, if the price action line cuts the support line of the flag body, we could expect a bear trend and an entry position for a short trade. And if the trendline cuts the resistance line, a trend reversal could be possible. Have a look at a Bear flag in the below screenshot.
(04)
Show a full trade setup using these Patterns on any Cryptocurrency chart. (Ascending Triangle, Symmetrical Triangle, Bear Flag)
Have a look at the trade setup using the Ascending Triangle.
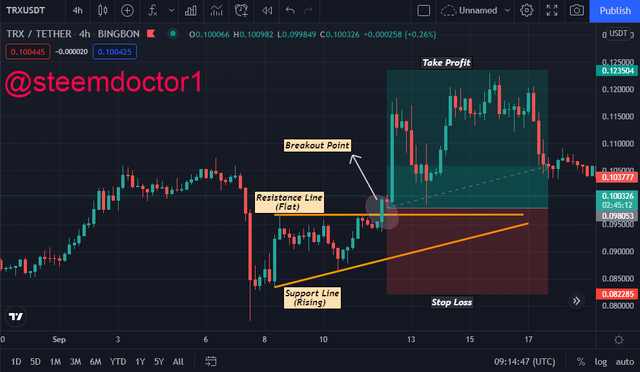
In the above picture, you can see that the price formed an ascending triangle pattern. The resistance line is flat and the support line is moving towards the resistance line. At last, the price action line cuts the resistance line and a breakdown happened that signals the trend continuation. So, I make an entry at that point and set the take profit point above the resistance price so that I can get a better profit. While on the other hand, I adjusted the stop loss point just below the support line so that I could not get much loss if the price goes against me.
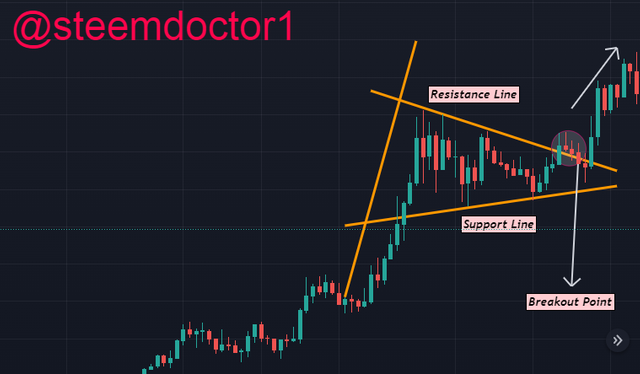
So now, have a look at the trade setup for a symmetrical triangle pattern.
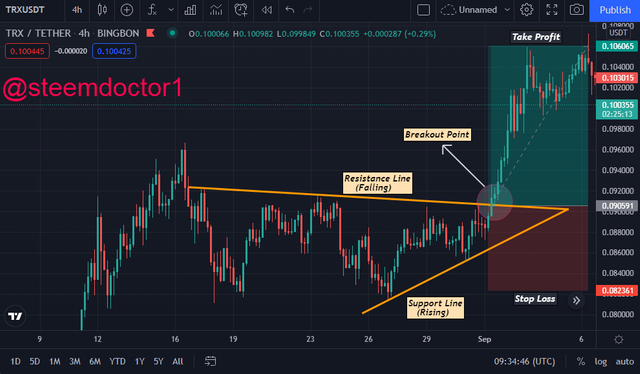
As you can see in the above screenshot that the price formed a symmetrical triangle pattern as the resistance line is falling down and the support line is rising up. Both of these lines are moving towards each other. At the end of the pattern, there is a breakout point that cuts the resistance line that is signalizing a bullish trend. So, I entered the market and set the take profit point above the resistance line to earn better profit. And the stop loss point is adjusted below the support line so that I could not be harmed by the opposite movement of the market. That's how I was able to set up a trade for a symmetrical triangle.
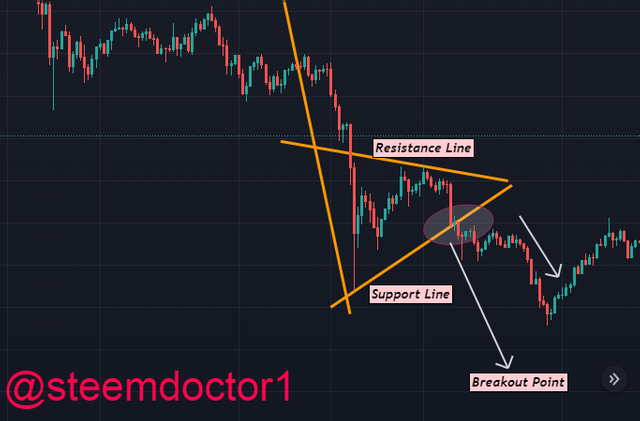
Now, have a look at the trade setup for a Bear Flag pattern.
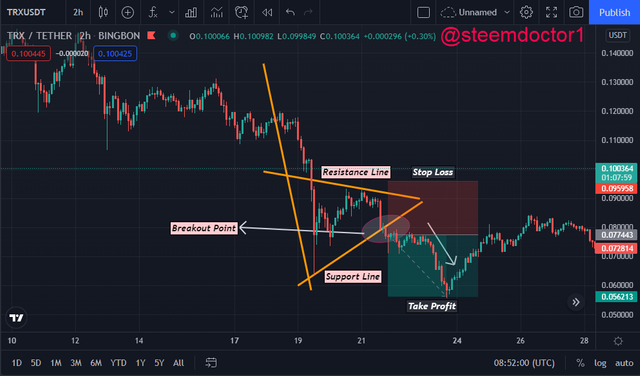
As you can see in the above picture that the market formed a bear flag after a strong bearish trend. At the end of the flag body, the price line cuts the support line and this is the signal of trend continuation. So, I entered the market by a short trade and set the take profit point below the support line to take a good profit. While on the other hand, I set the stop loss point just above the resistance line so that I could not get much loss if the market goes against me. So, in this way, I managed to set up trade by using the bear flag pattern.
Conclusions
The market of cryptocurrencies is very much difficult to understand by the new traders. However, there are some technical analysis tools that help the traders to understand the market. Patterns are also one of them. The market can form triangle patterns or flag patterns. Both of them are used to mention the entry points.
The breakout point in the patterns decides that whether the trend will be continued or the trend reversal is going to happen. So, by understanding these patterns the traders can make good trading decisions and make better profits.
So, that's all about the homework for this week. I enjoyed the lecture very much and I wish to learn more from the upcoming lectures of @sachin08. Hopefully, all of you will like this post.
Credits: @steemdoctor1 (Crypto Student)

