Reading Special Bar Combinations - Crypto Academy / S5W8 - Homework Post for @sachin08
Hello everybody.
Welcome to this post. Hopefully, all of you will be good and happy and enjoying your good health. Today, I am here to present the homework post for dear sir @sachin08 in the last week of Season 5 of Steemit Crypto Academy. The lecture was nicely explained by the professor and I will make homework for it. So, let's start our task without any wastage of time.

There are some questions that are asked by the professor as the assignment for this week and I will explain all of them in the given order.

(01)
Explain Price Bars in your own words. How to add these price bars on Chart with proper screenshots?
As we all know that the market of cryptocurrencies is so volatile that is very difficult to predict the next move of the market. But there are some technical analysis tools and strategies that are helpful in predicting the market trend and assuming the next move of the market. Price Bars are also one of these technical analysis tools that are helpful in predicting the trend of the market and forecasting the future price movement.
Mostly when we open the price charts of the crypto assets, we see the candlestick patterns on the charts that show the price movement of the respective asset in the given time period. But Price Bars are the older patterns that are used to predict market behavior. These Price Bars can also be considered as the points or dots that are showing the complete information and details of the transactions that are proceeding out in the market.
The Price Bars of an asset in the price chart represent the details of the transactions that are taking place in the market. These Price Bars also represent the supply and demand of the assets in the given period of time. These Price Bars express the behavior of the market or the move of the market when a transaction is processed in the market in a particular period.
The Price Bars pattern is very useful in determining the current trend of the market and future move of the market. When a change occurs in the trend of the market, it is usually represented by the change in the Price Bars. Now, have a look at a price bar and discuss the components of a Price Bar. So, have a look at the below picture.

There are actually four components of the Price Bar that are mentioned in the above screenshot. Now, I will discuss these four components as below.
- High Price:
The peak or top of the vertical line of the price bar is called High. This indicates the highest price that the asset reached in a particular time period.
- Closing Price:
The little horizontal line on the right side of the Price Bar that is present just below the high is called Close Point. This line indicates the closing price of the asset in the given period of time.
- Low Price:
The base or bottom of the vertical line of the price bar is called Low. This indicates the lowest price that the asset touched in a particular time period.
- Opening Price:
The little horizontal line on the left side of the Price Bar that is present just above the low is called Open Point. This line indicates the opening price of the asset in the given period of time.
Adding Price Bars on a Chart
Now, we will discuss the method to add the Price Bars on the chart of a crypto asset. So, we have to follow these steps.
- First of all, open the price chart of any crypto pair as I have opened the chart of TRX/USDT pair and then click on the Candle Icon present in the top bar of the chart. This is shown in the below screenshot.

- Now, a pop-down menu will open with a number of options. You have to click the Bars option.

- The Price Bars pattern will be added to the chart as you can see in the below screenshot.

(02)
How to identify trends using Price Bars. Explain for both trend. (Screenshots required)
As I have discussed before that the Price Bars are used to predict/identify the trend of the market. This trend could be an Uptrend (Bullish) or a Downtrend (Bearish). So, now we will discuss that how will the traders be able to predict/identify these trends. Before discussing the identification of trend, I want to discuss four terms with all of you that are as follow.
- Higher High:
This term is used when the High point of a price bar is higher than the High point of the previous price bar of a particular time period.
- Lower High:
This term is used when the High point of a price bar is lower than the High point of the previous price bar of a particular time period.
- Higher Low:
This term is used when the Low point of a price bar is higher than the Low point of the previous price bar in a particular time period.
- Lower Low:
This term is used when the Low point of a price bar is lower than the Low point of the previous price bar in a particular time period.
Now, we will discuss the method to identify both trends with the help of the price bars. So, have a look at these identifications.
Identification of an Uptrend
There are several identifications of an uptrend in the market. The first identification is that the price makes Higher High and Higher Low points. This means that the High and Low points of the next price bar are higher than the High and Low of the previous price bar respectively.
Another identification of an uptrend is that at the beginning of the trend, ensure that the Close Point of the next price bar is higher than the Close Point of the previous price bar. Similarly, the Low point of the next price bar is higher than the Low point of the previous price bar.
It can also be seen that during an Uptrend, the price chart of the asset consists of more Bull price bars (Green-colored) than the Bear price bars (Red-colored) until the change of the trend. But this identification is not stronger enough to rely on it, we have to identify other things also.
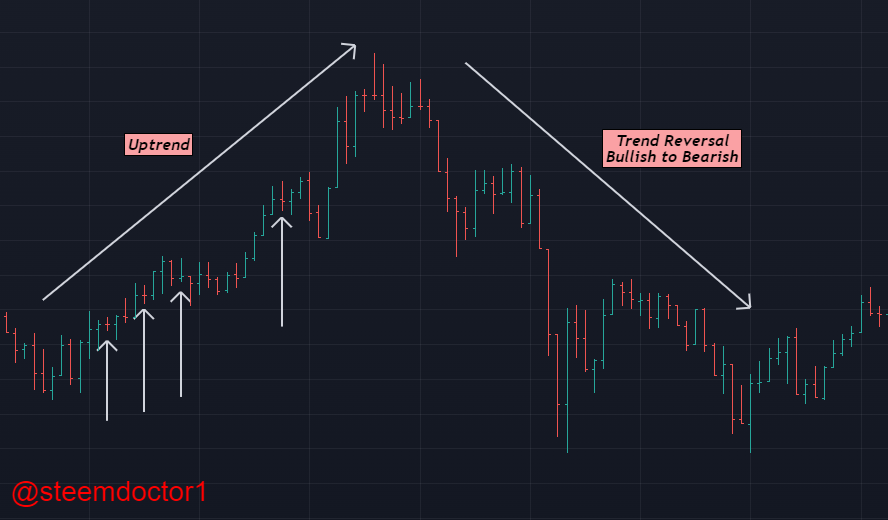
Now, have a look at an uptrend (Bullish) identified by the price bars combination. So, have a look at the below image.

You can see an uptrend in the above image. At the start of the trend, the High, Low, and the Close Point of the next price bar are higher than the respective points of the previous price bar. We can also notice that number of Green Bars (Bull Bars) is higher than the number of Red Bars (Bear Bars). It can also be noticed that the price is able to form fresh High points within a period. One thing that is more noticed is that sometimes the Close point of the new bar is higher than the Open price of the previous bar. So, these identifications show that this is the time of an Uptrend.
During an Uptrend, the buyers got an advantage as they can enter the market when the price is making higher highs, and in this way, they can make a better profit.
Identification of a Downtrend
There are several identifications of a downtrend in the market. The first identification is that the price makes Lower High and Lower Low points. This means that the High and Low points of the next price bar are lower than the High and Low of the previous price bar respectively.
Another identification of a downtrend is that at the beginning of the trend, ensure that the Close Point of the next price bar is lower than the Close Point of the previous price bar. Similarly, the Low point of the next price bar is lower than the Low point of the previous price bar.
It can also be seen that during a Downtrend, the price chart of the asset consists of more Bear price bars (Red-colored) than the Bull price bars (Green-colored) until the change of the trend. But this identification is not stronger enough to rely on it, we have to identify other things also.
Now, have a look at a downtrend (Bearish) identified by the price bars combination. So, have a look at the below image.

You can see a downtrend in the above image. At the start of the trend, the High, Low, and the Close Point of the next price bar are lower than the respective points of the previous price bar. We can also notice that number of Red Bars (Bear Bars) is higher than the number of Green Bars (Bull Bars). It can also be noticed that the price is able to form fresh Low points within a period. One thing that is more noticed is that sometimes the Close point of the new bar is lower than the Open price of the previous bar. So, these identifications show that this is the time of an Uptrend.
During a Downtrend, the sellers got an advantage as they can sell the assets when the price is making lower highs, and in this way, they avoid loss when the price goes much low.
(03)
Explain the Bar Combinations for Spending the Day inside for both conditions. (Screenshots required)
The Price Bar pattern is a very much useful and interesting pattern of the price as well. There are many special cases in the Bar Pattern that are considered to be very interesting. One of them is the Spending the Day Inside pattern that is also known as Inside Day. Inside Day pattern is formed by the price bars when the buyers and sellers (both) are unable to show their move in the market. Neither of them is impressed to execute a trade in the market. In this way, this combination does not predict the next move of the market.
Due to this behavior of the traders (buyers and sellers), a Bar combination is formed in which the next bar is formed inside the previous bar. This simply means that the next bar formed within the limit created by the High and Low points of the previous bar. This combination is formed by two bars. One of them can be considered a Parent Bar and the second one can be considered a Baby bar. The Baby bar is formed inside the Parent bar.
We can conclude these illustrations in the following two key points.
The High point of the next bar (Baby bar) should be lower than the High point of the previous bar (Parent Bar).
The Low point of the next bar (Baby bar) should be higher than the Low point of the previous bar (Parent Bar).
This Bar combination can happen in both types of market trends (Bullish or Bearish Trend). Let's have a look at them separately.
Inside Day Bar in an Uptrend

In the above image, you can see that the Inside Day bar combination is formed during an Uptrend. In these combinations, you can see that the second bar is formed inside the boundary created by the High and Low points of the first bar. The High points of the second bar are lower than the High points of the previous bars. Likewise, the Low points of the second bars are higher than the Low points of the previous bars.
These combinations are formed due to the indecisive behavior of both, the buyers and sellers. These combinations can be considered as the Buy Signals for the buyers as the price is following a bullish trend.
Inside Day Bar in a Downtrend

In the above image, you can see that the Inside Day bar combination is formed during a Downtrend. In these combinations, you can see that the second bar is formed inside the boundary created by the High and Low points of the first bar. The High points of the second bar are lower than the High points of the previous bars. Likewise, the Low points of the second bars are higher than the Low points of the previous bars.
These combinations are formed due to the indecisive behavior of both, the buyers and sellers. These combinations can be considered as the Sell Signals for the buyers as the price is following a bearish trend.
(04)
Explain the Bar Combinations for Getting outside for the Day for both conditions. (Screenshots required)
There is another Bar combination that is very interesting to know. Unlike the Inside Day bar combination where the High and Low points of the next bar creates a range inside the Low and and High range of previous bar, sometimes the Low and High range of the next bar is formed outside the Low and High range of the previous bar. This bar combination is known as the Getting Outside for the Day and also knwon as Outside Day bar combination.
These bar combinations can be found in both types of the market trends (Bullish or Bearish Trends). Let's look at both of them separately. The formation of this Bar combination predict the trend continuation or the trend reversal, depending upon the location of Close and Open points of the bar.
Outside Day Bar in Uptrend

In the above image, you can see that the Open point of the bar is at the Low point and similarly, the Close point of the bar is at the High point. This is the identification of the continuation of Bullish trend and the trend reversal of the Bearish trend. When the High point colides with the Close point, this means that the bullish trend is going to be continue or the bearish trend is going to be reverse.
Outside Day Bar in Downtrend

In the above image, you can see that the Open point of the bar is at the High point and similarly, the Close point of the bar is at the Low point. This is the identification of the continuation of Bearish trend and the trend reversal of the Bullish trend. When the High point colides with the Open point, this means that the bearish trend is going to be continue or the bullish trend is going to be reverse.
(05)
Explain the Bar Combinations for Finding the close at the open for both conditions in each trend. (Screenshots required)
There is an other bar combination that is also very interesting to know. This bar combination is known as Finding the Close at the Open or simply the Close at Open bar combination. As the name indiates itself, this is a bar combination in which the Open and the Close points of a bar are very close to each other or at the same place.
This bar combination can also be happen in both trends of the market (Uptrend and Downtrend). This bar combination is also helpful in predicting the trend continuation or the trend reversal depending on the factor that whether the Close and High points combines with each other near the High point or the Low point. Let's discuss them briefly in the following way.
Close at Open for an Uptrend
You can see in the above image that the Close Open points are close to each other and present near the Low points during the Bullish Trend. So, this is the signal of a trend reversal. After some time, the trend reversed to Bearish trend and you can see this in the above image. If the Open Close points are close to each other and present near the High point then it will be the signal of Bullish trend Continuation.
Close at Open for a Downtrend

You can see in the above image that the Close Open points are close to each other and present near the High points during the Bearish Trend. So, this is the signal of a trend reversal. After some time, the trend reversed to Bullish trend and you can see this in the above image. If the Open Close points are close to each other and present near the Low point then it will be the signal of Bearish trend Continuation.
Conclusions
Price Bars are the graphical representation tools of the transactions that are taking place in the market of an asset. These bar represents the demand and supply of the assets and give complete information about the current trend of the market. These bars also predict the future price of the market.
There are four parts of a bar that are High, Close, Open, and Low. There are many bar combinations that may happen in the chart of an asset and shows the current trend of the market, as well as, the trend reversal or trend continuation. By completely understanding these bar combinations, the traders can make profitable decisions in the market.
So, that's all about the homework for this week. Hopefully, all of you will like it. Thanks a lot dear professor @sachin08 for such an amz\ing lecture. I wish to see you in next season also.
Regards: @steemdoctor1 (Crypto Student)

