Trading Using Rectangle Pattern - Crypto Academy / S5W4 - Homework Post for @sachin08
Explain Rectangle Pattern in your own word.
How to identify Rectangles. Explain with Screenshots.
Can we use indicators with this pattern to get accurate results? Explain with Screenshots.
Explain Rectangle Tops and Rectangle Bottoms in your own words with Screenshots of both patterns.
Show full trade setup using this pattern for both trends. ( Entry Point, Take Profit, Stop Loss, Breakout)
Conclusion

Hello Everyone ❤️❤️
It's a pleasure to welcome all Students to the Season 5 (v) week 4 (Iv) steemit crypto academy, Season's greetings to everybody. Reading through the lecture I must commend Professor @sachin08 for a spectacular tutorial/lecture which entails Rectangle Pattern. It didn't take me much time to understand because of its simplicity. Have fun reading as u begin my assignment (homework) task for this wonderful lecture.
Explaining from my understanding or point of view, the term Rectangle Pattern talks about analysis or a type of technical analysis which helps traders ascertain or predict market price. Rectangle Pattern can be formed or composed by placing a horizontal line well placed at the top to serve resistance (resistance point) another bottom placed horizontal line to serve as a point of support. In drawing these horizontal lines we need to identify them on a chart. Prices usually move up and down and where there is no specific trend line may be an upward trend or Downward trend at the juncture we can draw the Rectangle pattern via the placement of both horizontal lines at the top(resistance line) and bottom (support line).
Rectangle Pattern could be formed or created via the market chart in two authentic ways, the Rectangle pattern can be formed from the top of the chart and this is called rectangle top or it could be formed bellow the chart and it is called bottom rectangle (rectangle bottom) this both formations could help all traders or traders using the Rectangle pattern a large amount of probability to predict the kind of trend that may occur, and when we mean trend we talk about who dominates the market buyers or sellers
One thing we should always note or put into consideration is that in a Rectangle pattern certain trends could take place when a break out occurs it could be upward or Downward after there is a movement which could be ranging in market price. A rectangle pattern entails a pause in trend where market prices go sideways between possible parallel support and also resistance zone.
We can still say it's a combination range where prices go about to favor equality in trade (buying and selling).
Discovering rectangles is an easy task. It is adviceable that users regularly practice identification of rectangle on a chart, this activities will increase the ability of users to easily discover a rectangle in a chart.
Step 1:
Identify the trends in a market, whether if the trend is bullish or a bearish trend. The chart should be in motion to easily identify the rectangle.
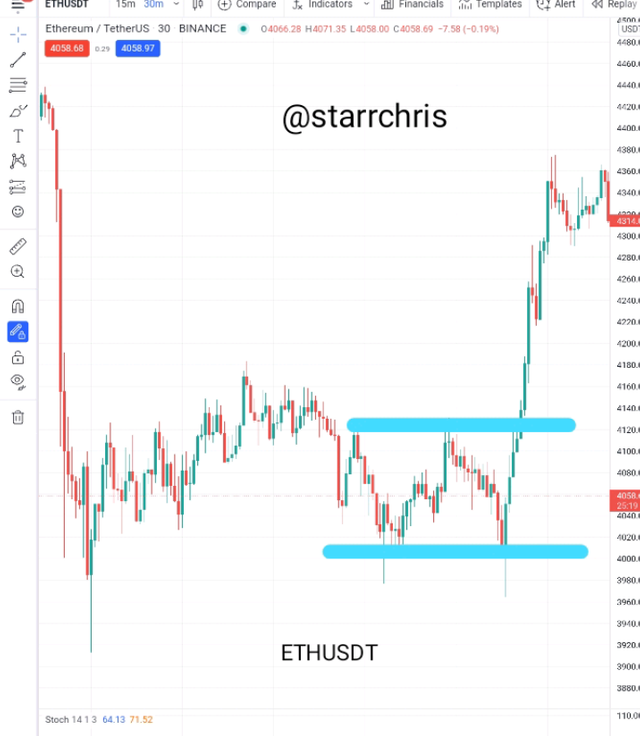
For this case study, ETH/USDT while it is trending downwards would be used.
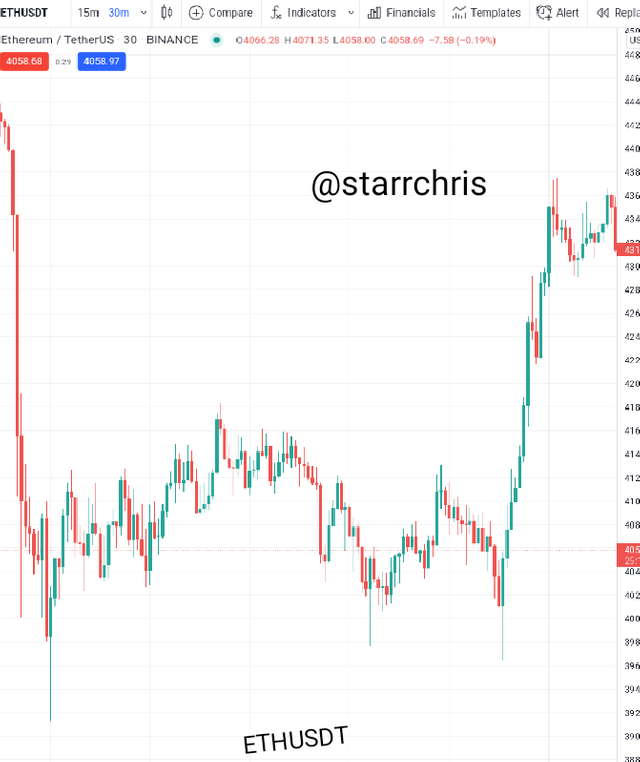
Step 2 :
Search for choppy areas in the chart.
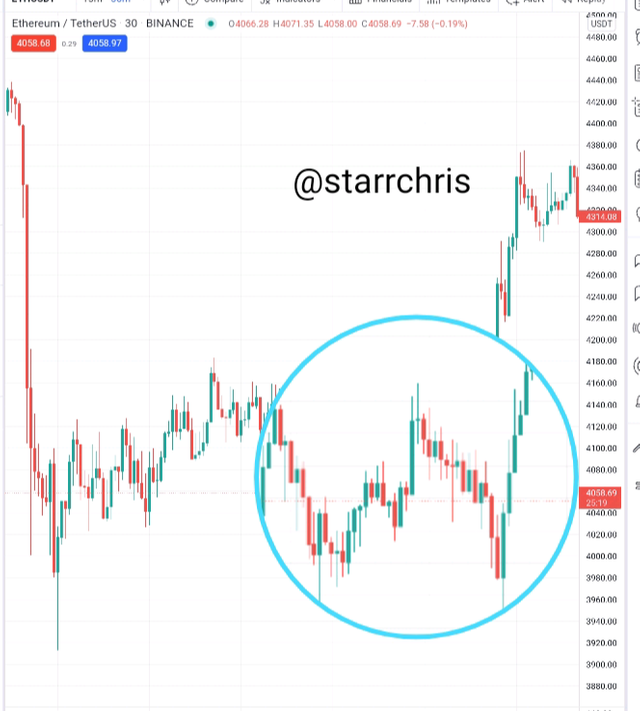
Step 3 :
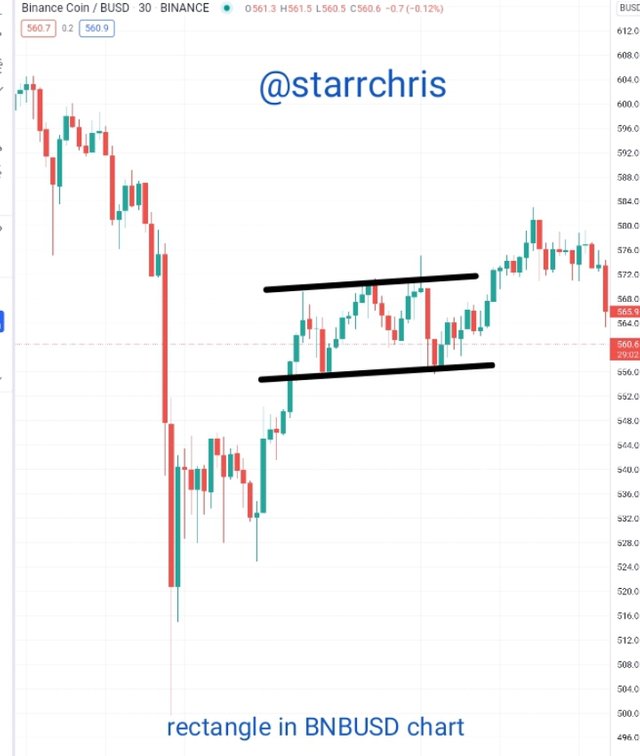
Do Mark the horizontal support and resistance line.
Without any reasonable doubt combinations of indicators when the market has been analyzed or examined with the application of Rectangle pattern, could yield accurate results for traders, it all boils down to which indicator pattern you are making use of (which is very important).
If we sight an instance that Mr. A has carried out an analysis using Rectangle pattern and Mr.A also uses an indicator with it just to achieve an accurate result on the movement of the market or a new trend occurrence of the market with the little screenshot below
As briefly mentioned before we are certainly used to the register 'rectangle top and rectangle bottom' and without much convincing Rectangle, the pattern could be formed at top of the chart or bottom of the chart. Recall both are specific indications. But for clarity purposes, I will like to explain both Registers.
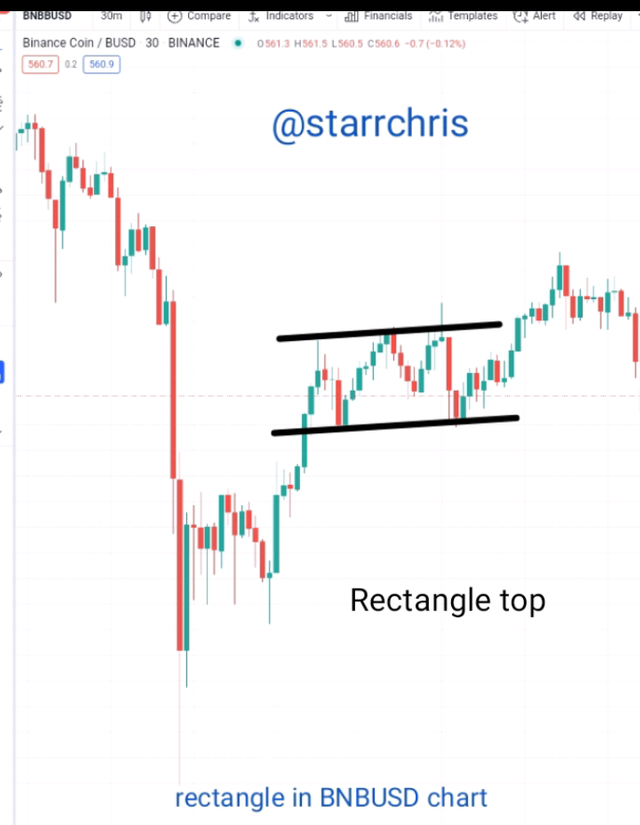
Rectangle Tops:
This simply can be found at a strategic part of the chart which is at the top of the chart. Remember there must be a formation of a ranging market. Where there are both restrictions for buyers and sellers under a particular trend. There is always an indication that the market will be or maybe bearing when this Rectangle pattern is located at top of the chart when the ranging has been formed and breakouts may occur at the support line. We know that when a breakout occurs bearish is inevitable and selling opportunities is favorable.
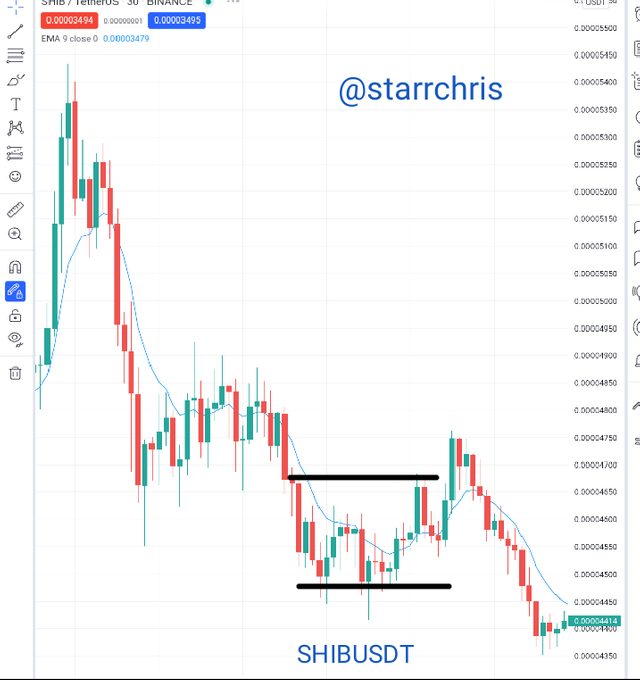
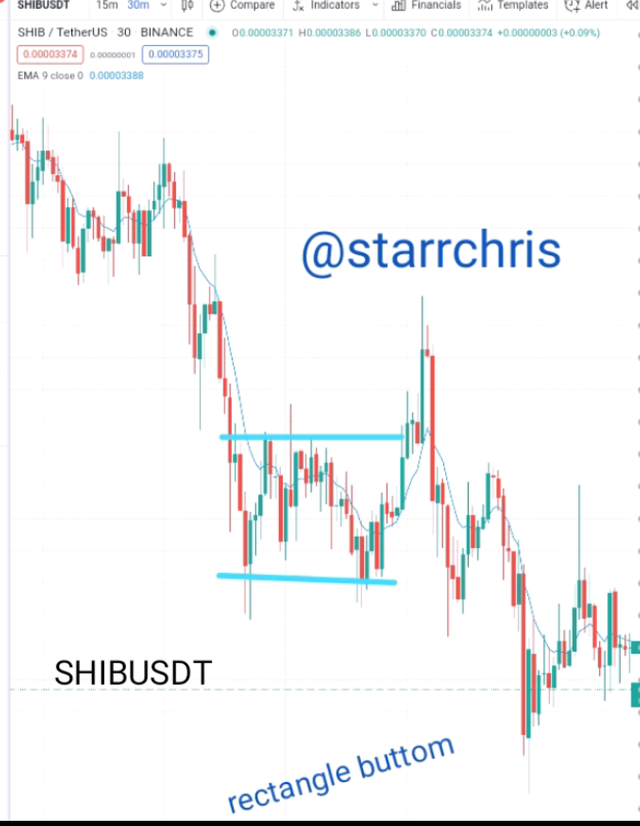
Rectangle Bottom
Just as I did a little clarification on the Rectangle top, I also want to do a clarification on the Rectangle Bottom. This simply can be located or seen at the chart bottom, in a formed ranging market, traders are restricted to a trend and the Rectangle Bottom when it is located after a forming range of market it explains to buyers and sellers (Traders) the market certainly will be bullish. The resistance line is always the breakout point and a bullish trend is experienced.
Sell order
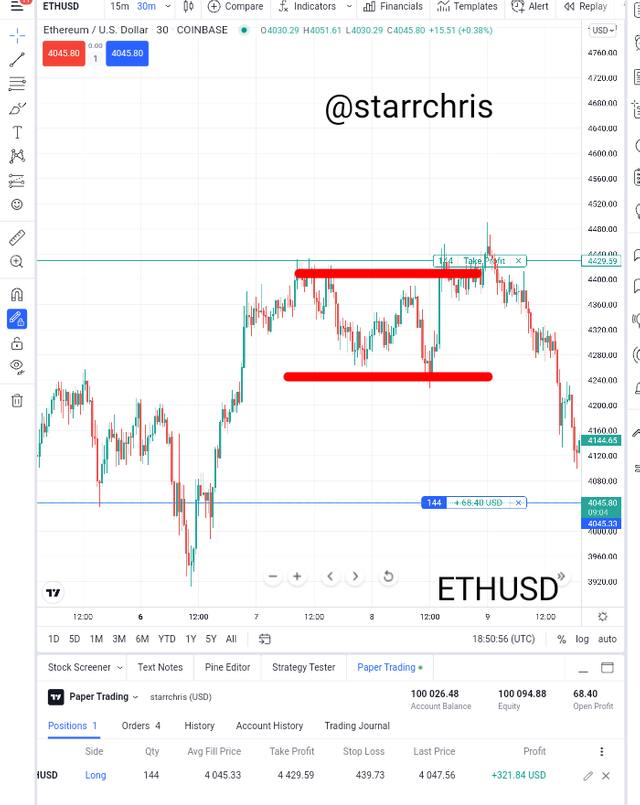
ETHUSD
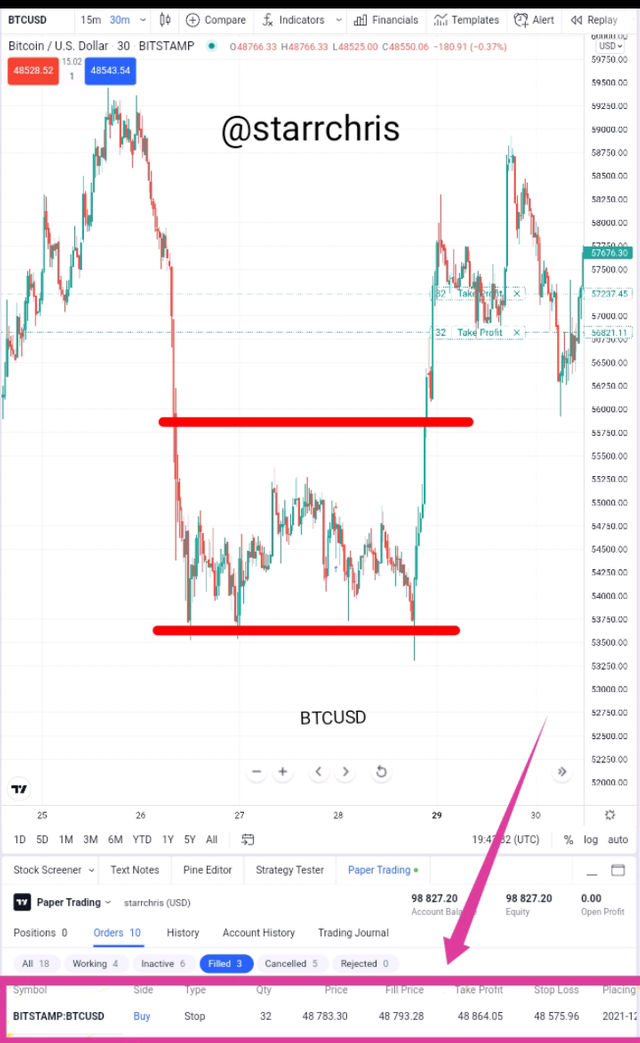
BTCUSD
Rectangle patterns are known as one of most first chart and trusted pattern everything crypto traders is most likely to face in their initial trade in the crypto market. It is one of the most known patterns, that is very easy to understand for Young and experienced traders. This pattern will give any trader an added advantage over some trader, because this pattern help traders make profiting transactions.
