Steemit Crypto Academy Season 4 Week 2 - Beginner's Course | Technical Indicators from @reminiscence
Questions
In your own words, explain Technical indicators and why it is a good technical analysis tool.
b) Are technical indicators good for cryptocurrency analysis? Explain your answer.
c) Illustrate how to add indicators on the chart and also how to configure them. (Screenshot needed).
a) Explain the different categories of Technical indicators and give an example of each category. Also, show the indicators used as an example on your chart. (Screenshot needed).
b) Briefly explain the reason why indicators are not advisable to be used as a standalone tool for technical analysis.
c) Explain how an investor can increase the success rate of a technical indicator signal.

Introduction
Good day all i am happy to be a part of this great community filled with great individuals like our humble prof @reminiscence01 a man of policy. Amazingly he is from my state, i am proud of you sir. Sir you have taught a lot about the Indicators and their uses . Thank you sir for impacting such important knowledge on me.
Questions and Answers

a) In your own words, explain Technical indicators and why it is a good technical analysis tool.
Technical indicators are technical analysis tool that are used to analyse the future price of an assert using technical and mathematical calculation of previous trends and price of the desired assert in the market, it is expected that the price and trend of an assert do repeat it self, in time(whether long time or short time). Indicator are used to help traders improve the probabilities of their prediction of price and trend on an assert in a particular period of time, in other to reduce the probabilities of experiencing lose in a business transaction.
Volume indicators are used to predict the strength of trend of an assert in the market at a particular period of time. Technical indicators are best used with other indicators to increase the probability of success in your predictions
b) Are technical indicators good for cryptocurrency analysis? Explain your answer.
Yes technical indicators are good for cryptocurrency analyst, because indicators like KDJ, Chaikin Money Flow, ADX etc, help traders, who trade crypto currencies, perform more reliable price and trend prediction, before buying or selling crypto currencies, in fact i will say technical indicators are not just good they are best for for crypto traders because it reduce chance of lost and improves the probabilities of profit in every business transaction the perform.
c) Illustrate how to add indicators on the chart and also how to configure them. (Screenshot needed).
Step 1:
I visited Binancewebsite
Step 2:
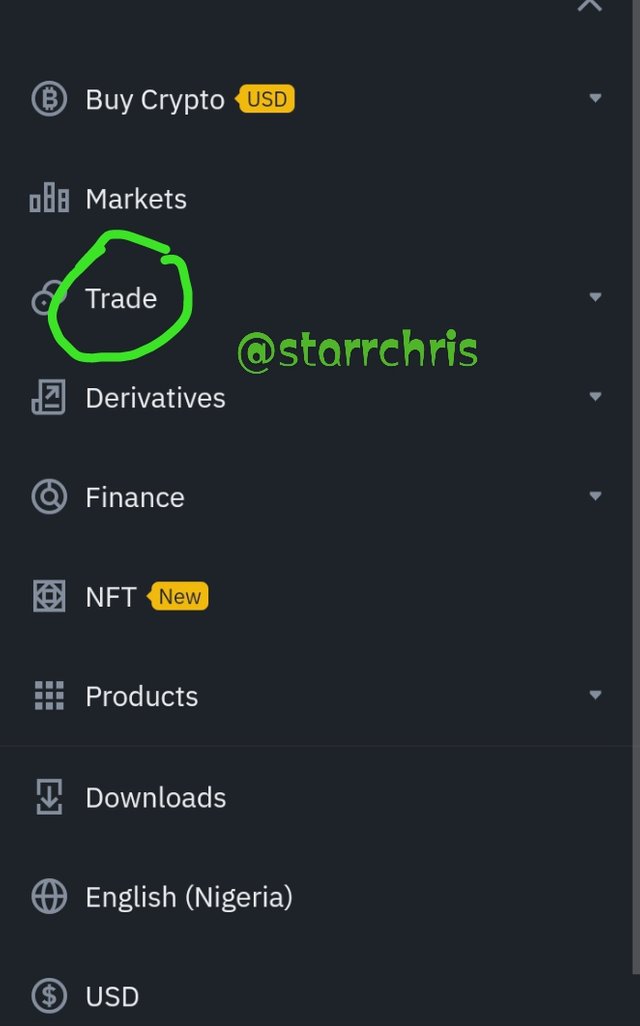
I Logged in/ signed up to the account and I clicked on the Trade tab.
Step 3:
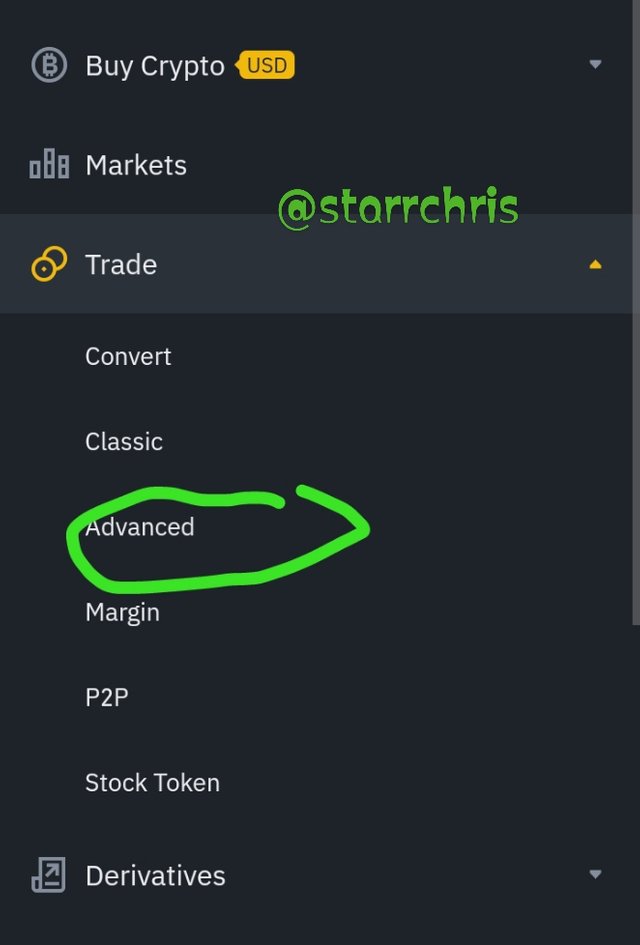
And choosed my desired trading options, which is "Advanced".
Step 4:
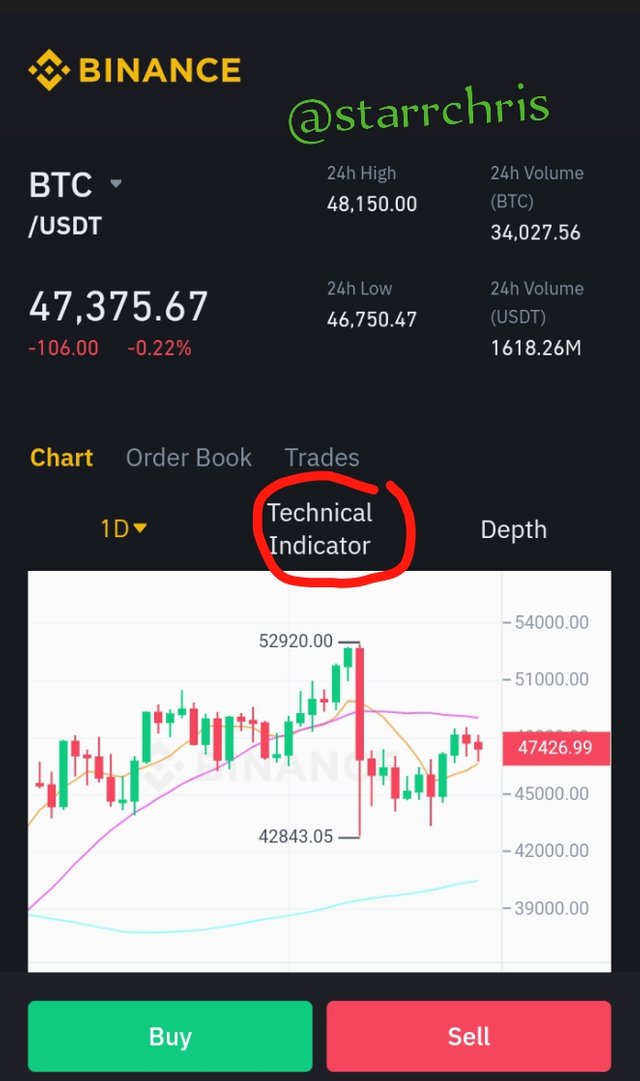
I Clicked on the "technical indicators" to see different indicators
Step 5:
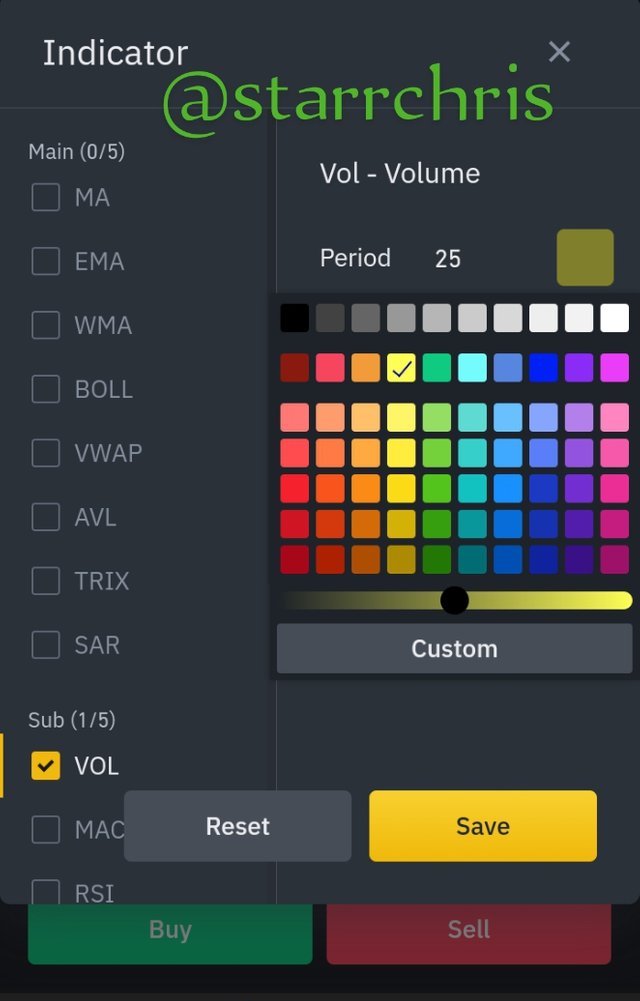
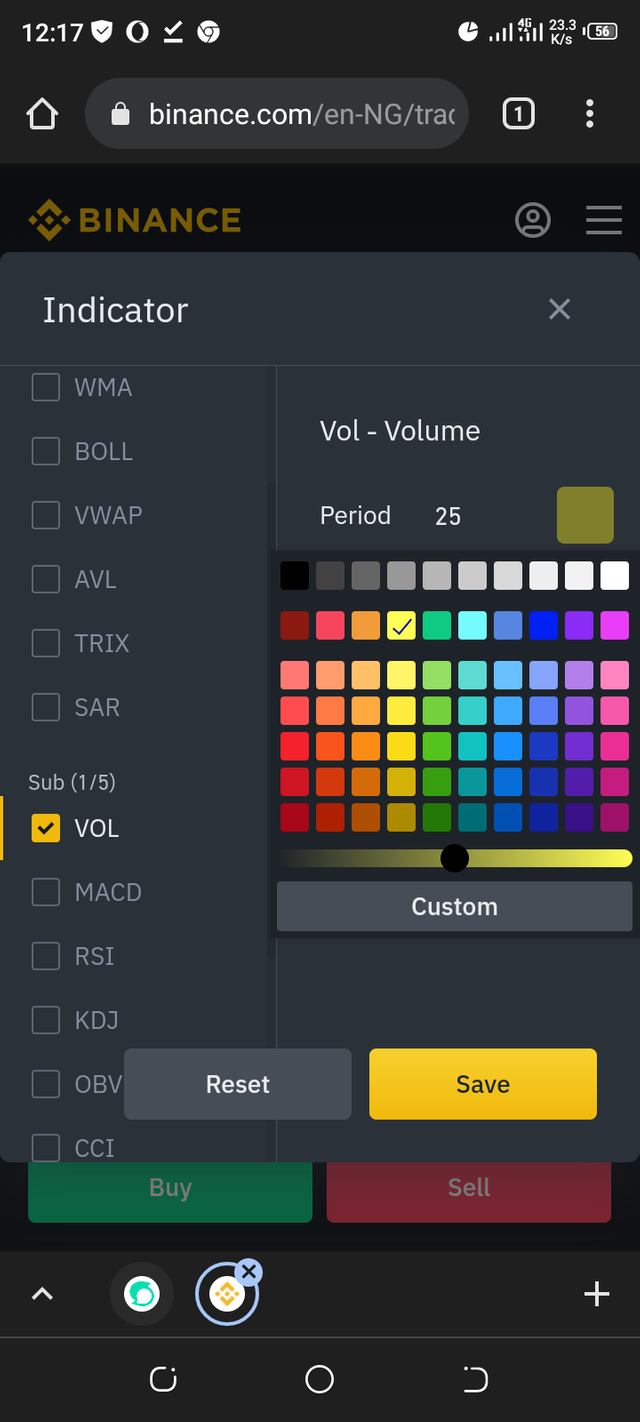
Search for any Indicators for example i choosed "vol"
Step 6 :
mark the check box at it side
Step 7:
you can make other setting like setting your desired period and your desired color
Step 8:
Click on"save" to save your changes
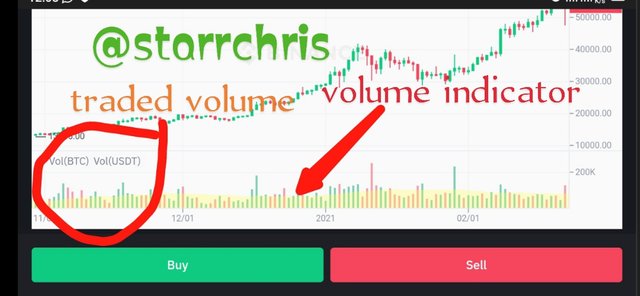
I have successfully added an indicator to the chart
2 a) Explain the different categories of Technical indicators and give an example of each category. Also, show the indicators used as an example on your chart. (Screenshot needed).
They are three main categories of technical indicators , all the three categories all have their specifications and different characteristics which makes them useful for specific predictions. They three categories
Categories of Indicator
- Volatility Based Indicators
- Momentum-Based Indicators
- Trend Based Indicators
Volatility Based Indicators.
As the name implies Volatility Based Indicators are used in a volatile market to know if the Volatility of an assert is high or low. They are indicators used to calculate the probabilities of of fluctuations, swings and unstable market trends and prices of assets in the exchange market. This fluctuations are mostly called either upswings and downswings are analysed by traders using " Volatility Based Indicators" to buy their desired asserts at a swing low and sell their desired asserts at a swing high. This will maximize profits from their business transactions.
For example
Types of Volatility Based Indicators
- Donchian Channels,
- Bollinger Bands,
- Keltner Channels (KC),
- Average True Range (ATR) etc
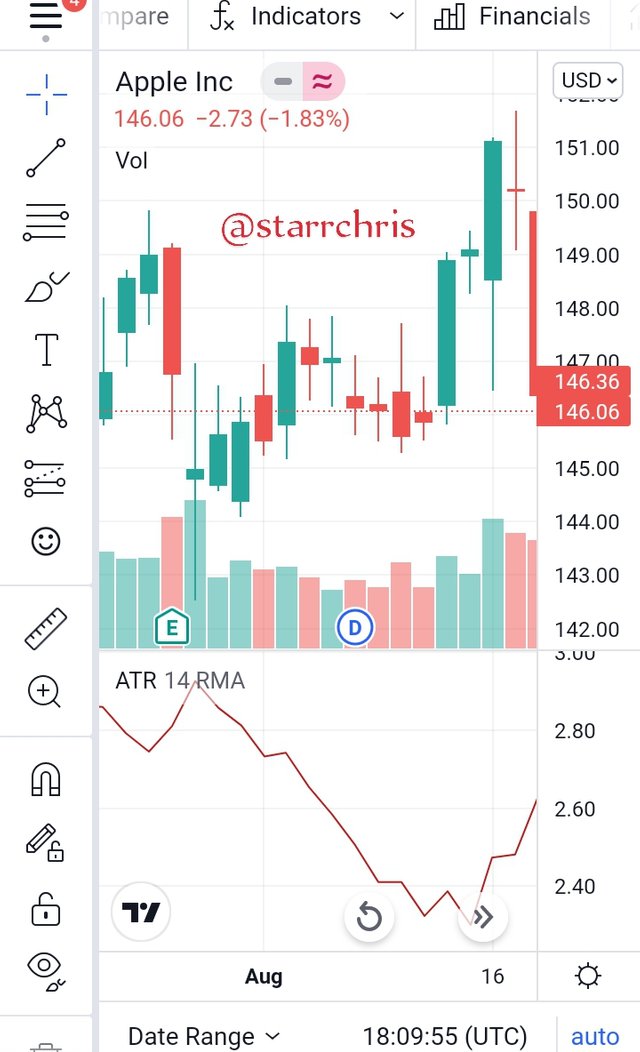
ATR chart
Momentum-Based Indicators
As the name implies the Momentum Based Based Indicators, are indicators that helps traders indicate whether an asset is been overbought or sold. Traders uses this kind of indicators to check and buy asserts when they are oversold and sell their desired asserts when the asserts are over bought.
Type of momentum based indicators.
- Relative Strength Index (RSI),
- Moving Average Convergence Divergence,
(MACD) - Commodity Channel Index (CCI),
- Stochastic etc.
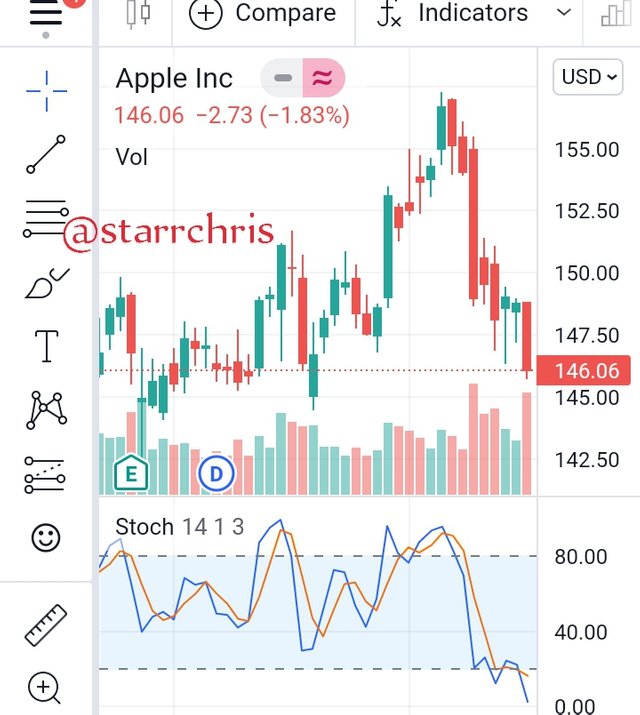
Stochastic indicator
Trend Based Indicators
This are indicators that helps traders make predictions with the use of trend, this indicators are used to check the strength of a trend i.e it is used to check it the buying pressure and selling pressure of asset's, if they selling pressure is high the trader buys their assert at a lower price and the sell their assert at high price if buying pressure is high, traders that perform this end up having very large profit from their business Transactions.
Type of Trend Based Indicators
- Moving Averages
- Average Directional Index ( ADX).
- Ichimoku Kinko Hyo etc.
For example
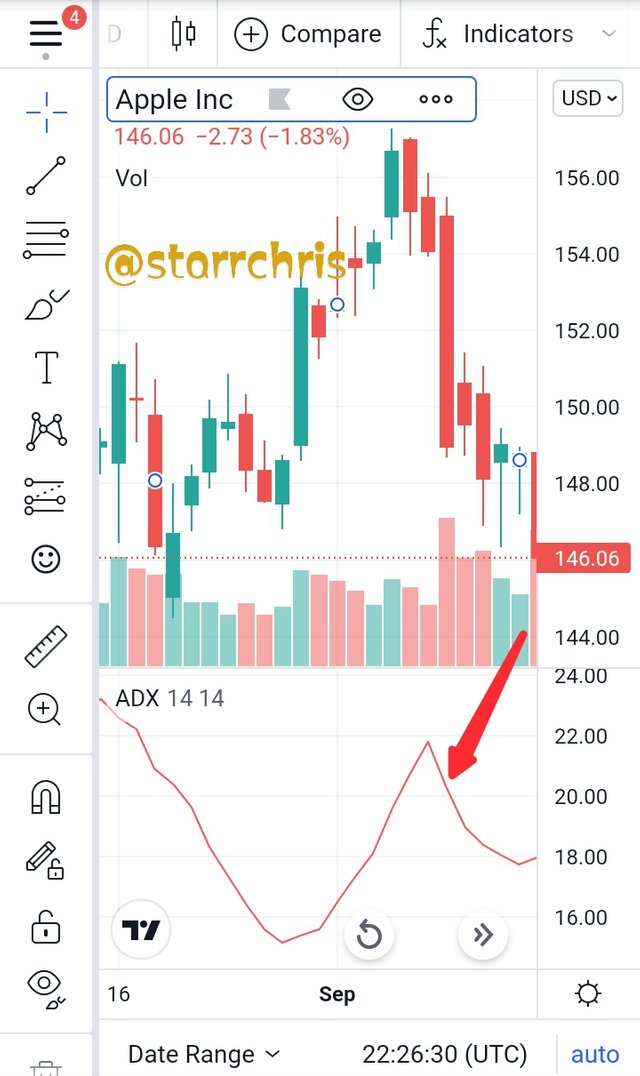
ADX Indicator
b) Briefly explain the reason why indicators are not advisable to be used as a standalone tool for technical analysis.
Indicator are software packages that can't be perfect or 100 accurate so you will need other tools to improve it probability of been accurate. As we have seen earlier they are different Indicators for different trader's and and different Indicators for different trading condition. Indicator we developed to confirm a chart, although too many indicator could also be bad because it could cause confusion and complexity to the the trader, which could result to unwanted and unexpected loss of money or asserts.
c) Explain how an investor can increase the success rate of a technical indicator signal.
For a trader to increase the success rate of his trades with technical indicator signals, the trader should have gained full knowledge about the chart, have full knowledge of the assert, have full knowledge of the indicator and have full knowledge about the major candlesticks. if the trader have the suppose knowledged of the above, the trader is expected to pick any three or two indicators he or she is convenient with to analysis about the entry and exit point and confirm reliability of the trade.
Conclusion
Technical indicator are wonderful analysing tool used to analyse , predict and confirm the trend and price of asserts at a a particular time . I have also learnt that i should not use just one indicator when i am analysing a price and trend of an indicator. I have also learnt how to configure and use an indicator. Thank you prof @reminiscence01 for your lecture, Thank you.
Hello @starrchris, I’m glad you participated in the 2nd week Season 4 of the Beginner’s class at the Steemit Crypto Academy. Your grades in this task are as follows:
Observation
This is correct. Too many indicators on a chart can be confusing, two or three at most is enough to give and confirm signals.
Recommendation/Feedback:
A good performance. Some points were missing and needed better explanations.
Ok prof @reminiscence01 thank you very much