Steemit Crypto Academy Contest / S4W1 - Crypto Market Technical Analysis by @starrchris.
How would you define Technical Analysis in the Crypto ecosystem? Mention its Importance.
Do you have practical knowledge of how to conduct technical analysis? Highlight some of the components of Technical analysis.
What do you understand by technical indicators? Do you consider them effective for trading cryptocurrency? Which one is your favorite and how does it work? (Screenshots required where necessary)
Highlight the advantages and disadvantages of technical analysis. What's your advice to anyone about it?
Good afternoon lovely steemians how are you all doing? I hope you are doing well? I am glad participating in this season of engagement contest, so far this is my third entry this week and I hope I make complete entry to all contest this season, hopefully I will emerge winner of the season. Before I start I want to use this opportunity to thank all the professors and steemit team organizing this contest, I believe it yield positively on Steem Blockchain.
All thanks to steemit and it's professors, I am no longer new to this topic because emergence of crypto academy. The crypto market is so so volatile and unstable to be predicted with mere guessing and mere analysing, so therefore so awesome and smart people came up with so awesome tool, theories, calculation and rules to help improve the prediction of the a price crypto coins, tokens or currencies to aid profitable trading also known as crypto trading.
Mere guessing the price of asset resulted to higher probabilities of losing crypto currencies due to it's high volatility, so therefore so highly technical traders came up with the idea to create technically analysis which is aimed to help sucesssfully predict the price of crypto currencies and help traders make higher profit from crypto trading.

Technical Analysis
In my understanding technical analysis can be easily defined as the using of special techniques, formate or discipline to successfully predict the price of an asset or the trend and movement of a crypto asset at a particular period of time. That's to that technical analysis can be defined as the use of well market chat, candlestick, technical indicators, market trends and volume of asset to predict it next trend or movement whether bullish or bearish.
Professionally I would define technical analysis as a technical form of investment valuation that make use of pattern, candlestick, indicators and previous market movement to successfully predict the movement and price of a crypto asset in a particular period of time. Technical Analysis was derived by so many experienced and smart traders that had use this theory to make millions of dollars daily, although this analysis is not always 100% accurate but it has aided sucesssfully prediction in the past years
By examining statistical trends gleaned from trading activity, such as price movement and volume, technical analysis is a trading discipline used to assess investments and spot trading opportunities. Technical analysts concentrate on price movement patterns, trading signals, and many other analytical charting tools to assess a security's strength or weakness, in contrast to fundamental analysts who attempt to determine a security's underlying value based on financial or economic facts.
Importance of Technical Analysis
There are so many importance of trading analysis, so therefore I will just be listing just few necessary importance of technical analysis.
The implementation of technical analysis into crypto trading assist crypto traders and crypto investors find crypto asset which awesome potential of making profit if invested in, with the help of technical analysis traders would easily detect fake signals also known as fakeouts.
With the help of Technical analysis and it's awesome tools like indicators, candlestick, chart and trends pattern which aid awesome price prediction, crypto analysis or crypto traders can easily detect and read the market sentiments and This helps traders identify the overall market structure and behavior.
- Technical analysis can be really useful in predicting the price of crypto asset at any given time, for example with the help of technical analysis some experience traders has predicted the price of steem in the next 3 years.
- With the help of technical analysis like support lines and resistance line traders can easily know when the trend of the market is about to change to an opposite direction.
Yes, all thanks to steemit teem for hosting crypto academy and all thanks to the awesome professors who wonderfully taught me about crypto trading and technical analysis. Infact now I do frequently practice crypto trading with the help of technical analysis I was taught in crypto academy some months ago and now I enjoy it's benefits by making profit from the comfort of my home.
Components of Technical Analysis
As I have said before there are so many components of technical analysis that makes the flexible to any type or for of trading, this awesome components when used together improve the probability of achieving success in your predictions as a trader who wants to make profits.
Some of the famous components of technical analysis are:
- Chart
- Candlestick
- Technical indicators
Candlestick
A candlestick is a technical analysis component seen in a price chart of a crypto asset in a crypto market that helps traders find open price, closing price, high price and low price if a crypto asset at a particular period in time. A candlestick chart is very useful component of a crypto chart that is to describe trend and structure of a crypto asset, It is looks like the famous bar chart because of it's the structure of each candle.
Technical analysis includes chart patterns, which concentrate on recurring structural patterns in price movement. These patterns are a collection of candlestick formations that provide insight into anticipated price movement. The study of chart patterns through time has shown that they produce a particular result. This aids traders in forecasting a potential result from a certain chart pattern.
Technical indicators
Technical indicators, which are used by traders who follow technical analysis, are heuristic or pattern-based signals generated by the price, volume, and/or open interest of a security or contract. Technical analysts use indicators to forecast future price movements by examining historical data. Typical technical indicator examples include the following:
- Relative Strength Index (RSI),
- Money Flow Index (MFI),
- Moving average and
- Bollinger Bands.
Technical indicators, also referred to as "technicals," are more concerned with historical trading data than business fundamentals like earnings, revenue, or profit margins. These data include price, volume, and open interest. Since technical indicators are made to assess short-term price changes, active traders frequently utilize them, but long-term investors can also use them to determine when to enter and quit a trade.
Chart
Crypto charts are used to assist traders in choosing cryptocurrencies and equities, same like technical charts help traders choose stocks and commodities. Cryptographic representations of past prices, volumes, and time intervals are called charts. The charts, which are intended to identify investment possibilities, create patterns based on the historical price movements of the virtual currency.
.jpeg)
A crypto chart is merely a visual tool that presents pertinent data in a way that makes it easier for you to comprehend fluctuations in bitcoin prices.
The way the data is displayed can help you identify trends as they emerge, spot patterns in market movements, and develop an overall impression of the market's momentum, whether it is bullish (people are buying and the price is rising) or bearish (people are selling and the price is going down). According to theory, you may use this information to predict where the market is headed and what the price will be in the future so you can decide when to purchase, sell, and hold onto your investments.
A mathematical tool that can be used with price and volume data is referred to be a technical indicator. Even another technical indicator can use it.The outcome is a number that can be used to predict price changes in the future. The wavy lines that can be seen above, below, and on top of price information on a chart are called technical indicators.
They are employed by technical analysts who trade the crypto market, the strength and direction of the underlying price action can be examined from a different angle using a technical indicator, technical analysts utilize indicators to forecast future price changes by examining historical data.
The computed probability may or may not be accurate because indicators can only forecast a portion of possible outcomes. To optimize a trade setup and enhance the trading experience, technical indicators are used in conjunction with other technical analysis tools like price movement, etc. Since different mathematical techniques are used to construct some technical indicators and since they have distinct functions on a price chart, there are several types of technical indicators.
Do i consider them effective of trading crypto?
Yes I do, indicators are very essential when crypto trading is considered because it aid and assist traders easily forecast profitable crypto movements. The effectiveness of indicators depends on the way they are used, as I had said before almost every indicator have different purposes and use case, so therefore if you use an indicators for a wrong use case then it won't be effective but if you use it for the right case then it would definitely be effective.
Because indicators are used for different purposes, we are expected to use more than one indicator when analysis to improve chances of getting a successful results. Although I said you should used multiple indicators don't mean you will use too much indicators because it would only confuse you and give you wrong predictions.
Which one is your favorite
My favorite indicator is the KDJ Indicator
The famous technical indicator called the KDJ indicator (random index) is used to evaluate and forecast changes in stock trends and price patterns in a traded asset. It is a very useful technical indicator that is frequently applied to short-term stock market trend analysis. The only distinction between KDJ and the Stochastic Oscillator Indicator is the presence of an additional line known as the J line. %K and %D line values indicate if the asset is overbought (above 80) or oversold (below 20). (below 20). The best times to sell or purchase are when %K crosses %D. The divergence of the %D value from the %K is shown by the %J line. J's value can be greater than [0,100] for the %K and the %D lines.
Using the random index, a technical analysis tool, buyers and sellers can find price fluctuations and determine the optimum times to enter and exit a market. KDJ, one of the most recent technical indicators, an indicator is used to indicate or predict the price for a specific time period.
The KDJ Indicator usually comes in three colors by default which can later be changed to desired colors, these colors are
K = Red color
D= Blue color and
J = Black color
How it works
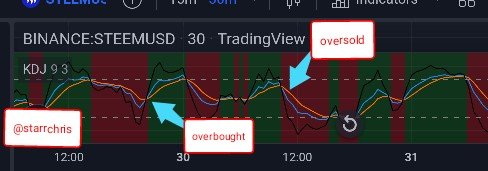
Overbought
If after the three lines (KDJ) meet the Same spot then the J line moves upward above 80 then you should know we are expecting a overbought movement, it can also be said that the crypto asset is been overbought. This the best time to sell your asset and you notice the chart changed from red to green.
Oversold
If after the three lines (KDJ) meet the Same spot then the J line moves download below 20 then you should know we are expecting a oversold movement, it can also be said that the crypto asset is been oversold. This the best time to buy your asset and you notice the chart changed from green to red.
Despite it's numerous uses it has major advantages and disadvantages, there are:
| Advantage of TA | Disadvantage of TA |
|---|---|
| Technical Analysis provides traders with quality trading decisions through professional analysis and calculations. | If the wrong indicator is used then it sure to mislead the trader. |
| Two or three effective indicators can serve a trader well | Too many indicators would just confuse a trader and lead the trader astray. |
| They are actually cheaper to use | The fact that one indicator can't serve in all use case is also a big disadvantage |
| They are very flexible in the sense that the can be used for different types of trades | No mater the amount of indicators used don't give 100% guarantee or trust because it might fail you |
| It make trading easily, faster and more reliable | Traders need special tutorial before handling any technical analysis, that is to say it's requires extra knowledge |
What's your advice to anyone about it?
The best advice I can give is the don't totally trust the technical analysis because I can also fail at anything, so it's best you trade with what you are not scared of losing. As I had said numerous times please use more than one indicator when analysing, 3 or 4 indicators would be okay. Don't use too much indicators because it might give a wrong result.
Wow this really interesting but broad topic which I very important to all crypto traders wherether big or small, technical analysis has made a lot of people to become billionaires and at same time made many poorer. So therefore please trade and analysis wisely.
Thank you very much for going through wishing you success.
I am inviting my friends @chiabertrand @juenco @preye2 @simionigwe @patjewell
Upvoted! Thank you for supporting witness @jswit.

Oh my word! As I was reading your post I could see my husband so clearly. He is forever drawing lines (•ิ‿•ิ)
It is true, you cannot invest in any share if you have not done your analysis.
My hubby's words "You cannot make money if you don't invest time".
Good luck for the contest!
Awwn I am glad 😊 I reminded you of an awesome inspiration quotes from such an awesome person, indeed your husband must be a great and awesome person.
Thank you very much for stopping by
wishing you success.
Thank you for the good wishes!
You have written such a high quality post that every word has been choosen wisely . Here inwould differ slightly by saying indicators are not very important but they are just supportive tools without which trading can be done with fair degree of accuracy. It is my opinion as I don't rely too much on indicators .
That's absolutely true . I do feel same .
Good luck
Wow, I just learnt something new today, you actually right the are just for support and assistance in making prediction.
Thank you very much for stopping by
wishing you success
This is such a wonderful post that teaches greatly.
As I have come to learn of Technical Analysis, It is a means of using passed data and price actions to predict the future. This is the beauty as it is like that of teaching the kids of this day, our history past for them to know what to do in comes tomorrow.
Thank you for this lovely write up and success in the contest.
Yea, it's a nice idea to prepare the future generations for a better tomorrow. Thanks for stopping by
wishing you success.
This shows that you have good understanding about trading. I can see that you have taken time to present all the charts above in an understandable manner.
Yea, you are right but I am not yet a perfect trader I'm still improving.
Just keep trying very soon you will be perfect
A very detailed and educative post you have here, as I got to see many importance of trading with technical analysis. Traders could easily see and tell the sentiment of market participants. I equally love the random index indicator which basically uses 3 lines to detect overbought and oversold situations in the market. Thanks for sharing this article and goodluck in this contest.
Thank you very much sir for your good wishes, you indeed have a good taste in Indicators because the random index indicator helps positively if mastered
Thank you very much for sharing your thoughts
wishing you success.
The post as I read through, I really liked the way you organized it. Contents I mostly agree on and everything. Personally I feel it's one of the best entries I have read till now. Good luck for the contest bro!!
One thing I lost alot of money when I traded with KDJ haha, never able to get good at it.
Thank you very much for your compliment and your good wishes bro,
I am sorry for your lost, hope it was just a minor lost, as I has said previously indicators are not 100% trusted. Hope you don't experience such again.
wishing you success
Congratulations, your post has been supported by @steem4nigeria. This is the official community account of Nigerians on Steemit. You can reach us here on our community account.
We have a new contest running in the community and we look forward to your entries- Steem4Nigeria Weekly Contest - What I Believed Versus the Real Picture.
Discord Facebook Twitter
We have been able to predict the price of assets for the next coming years due the knowledge of technical analysis, this help traders to position their resources for better trading positions.
Crypto charts contains historic data of assets that help traders to predict presence market trend.
Indicators are of different forms and when we use one indicator function for other, we can be sure of obtaining wrong signals. We should know the function of each indicator before using it on an asset chart.
Great write up and good luck.
Thank you very much