Crypto Academy / Season 3 / Week 8 - Homework Post for [@asaj]: Crypto Assets and the Random Index (KDJ) by @starrchris
Questions
1 In your own words define the random index and explain how it is calculated.
2 Is the random index reliable? Explain
3 How is the random index added to a chart and what are the recommended parameters? (Screenshot required)
4 Differences between KDJ, ADX, and ATR
5 Use the signals of the random index to buy and sell any two cryptocurrencies. (Screenshot required)
Questions and Answers
In your own words define the random index and explain how it is calculated.
- KDJ indicator also referred to random index, is a technical analysis tool that helps buyers and sellers to discover changes in price and it also helps buyers and sellers know the best time to entry and exit a market. KDJ which is also known as random index Indicator is one the latest technical indicator which is used to indicate or predict the price for a particular period of time. In the random index there are three lines which are K line, D line and J line. the of K and D lines moves in similar way as to that of stochastic oscillator, all these three lines creates independent curves.
Explain how it is calculated
KDJ indicator is calculated based on the lowest price, closing price and highest price, for a chosen time, the price moves above and below. The indicator lines rangers from 0 to 100 in the price chart. If the price is above 80, it is an overbought condition and if the price moves below 20 it is an oversold condition.
CALCULATIONS
Write down your Highest, lowest, and closing prices for a particular period of time and denote the price as n.
- n= price for a particular period
- Hn= Highest price for a particular period
- Ln= Lowest price for a particular period
- Cn= Closing price for a particular period
Then we need to obtain Reserve value (RSV) of the asset. - Reserve value (RSV)= (Cn-Ln)/ (Hn-Ln) X 100
To calculate for K and D values by using the below formula.
K value of the day= 2/3 X previous day K value+ 1/3 X Reserve Value for a particular period.
D value of the day=2/3 X previous day D value+ 1/ 3 X K value for a particular period
Users should use 50.If there is no previous day K and D values known.J value= 3 X period of time K value- 2 X period of timeD value.

Is the random index reliable? Explain.
- The KDJ is a trend analysis technical indicator. As we discussed in earlier lessons I think there is no indicator or strategy which is 100% perfect and reliable. But to make it reliable users can combine moving averages, ATR, or ADX with the KDJ indicator and determine the price trend. KDJ may also produce false signals. So my advice for investors is before stepping onto investing better use a few more indicators and strategies to verify the real price trends.
How is random index added to a chart and what are the recommended parameters? (Screenshot required)
- To add the indicator to the price chart first log into Tradingview.com

- click on Charts
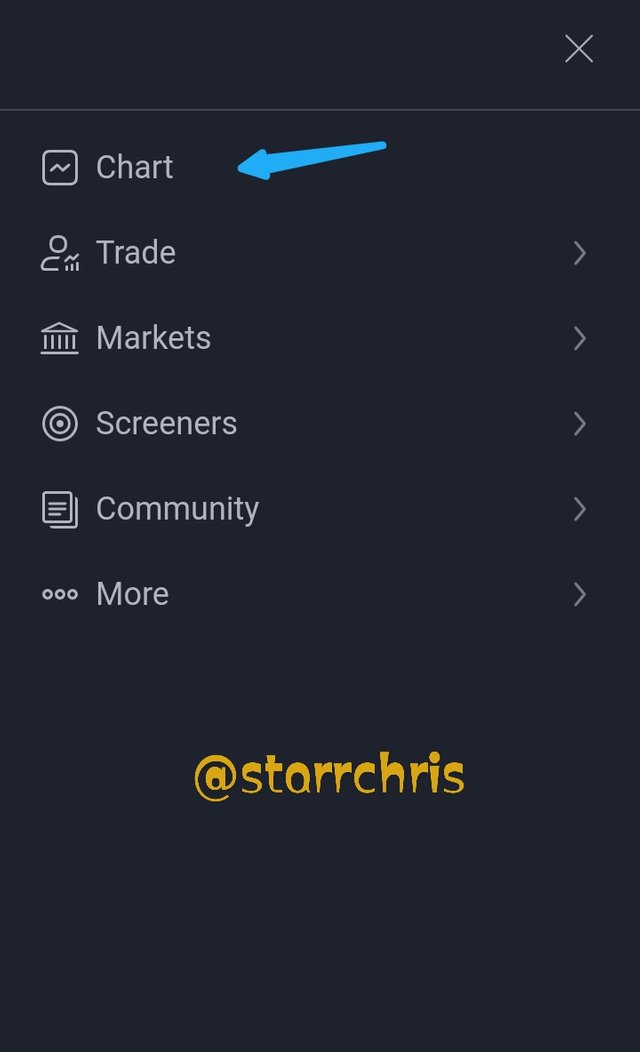
- Then you will be directed to the price charts window. The price chart of the selected cryptocurrency pair will appear on the page
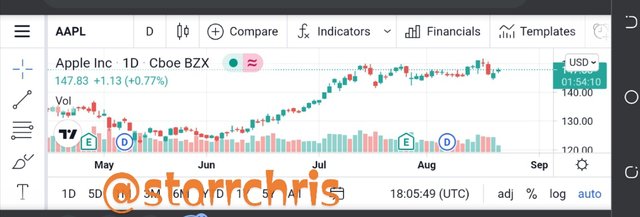
- Then click indicator
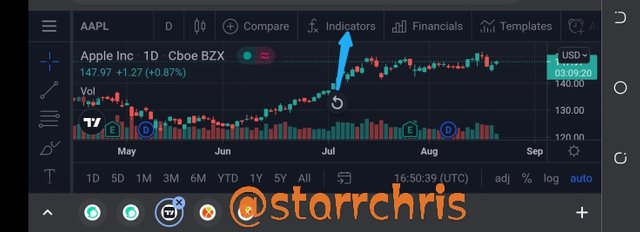
- Then type KDJ and click on the first option
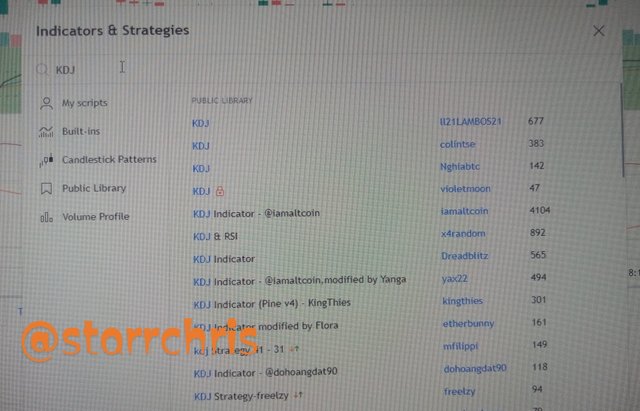
- This is how it should appear.
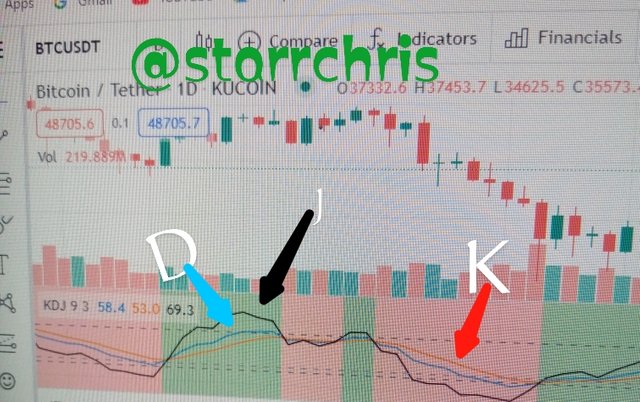
what are the recommended parameters?
Recommended parameter is a numerical
that set the conditions of operation for an assert. Recommended parameter of KDJ are sets measures or numerical conditions of KDJ operations. The default parameters settings of KDJ is %K 9, %D 3 and %J 3 index.
Overbought signal
When the J line moves above 80 on the price chart it is known as an overbought condition. This are best times for sellers and traders to sell the commodities, because this will result to larger profit for sellers in the market.are getting ready to sell the assets that they have.
Oversold signal
When the J line moves below 20 it is known as an oversold signal. This are best times for buyers and traders to buy commodities, because this will result to larger profit for buyers in the market
Differences between KDJ, ADX, and ATR
KDJ
- KDJ is an Indicator invented by "George Lane" technical analysis tool with a default settings of 9,3,3 that tells traders if an asset is overbought or oversold. When the K value of the indicator is greater than 80 then it gives an overbought signal. When the K value is less than 20 then it is given as an oversold signal. It uses K, D, J lines.
ADX
- Average Directional Index is is a technical analysis tool invented by"Welles Wilder" ADX indicator are used to check the strength of an assets. It has just a single line which ranges from 0 to 100. This helps traders to know the strongest price trends of an asset. It uses ADX line, but can also involve DI+ and DI- line. It's default settings are 14, 14, 14.
ATR
- The Average True Range Indicator is an analysis tool invented by"Welles Wilder" . ATR is used to check the market volatility of assets for a particular period of time. ATR is calculated by considering the gaps between price movements. It Uses just a single line. It's default settings is 14.
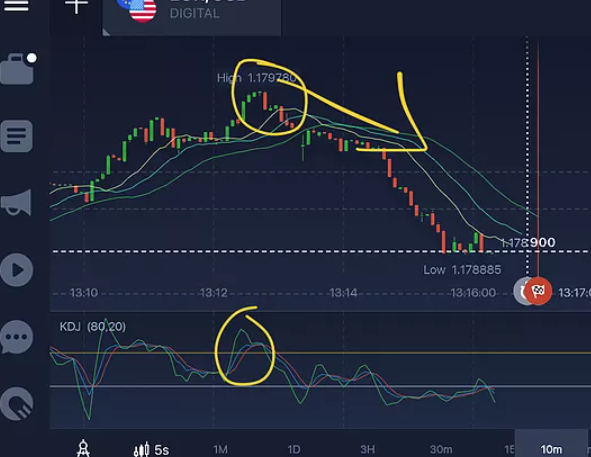
Use the signals of the random index to buy and sell any two cryptocurrencies. (Screenshot required)
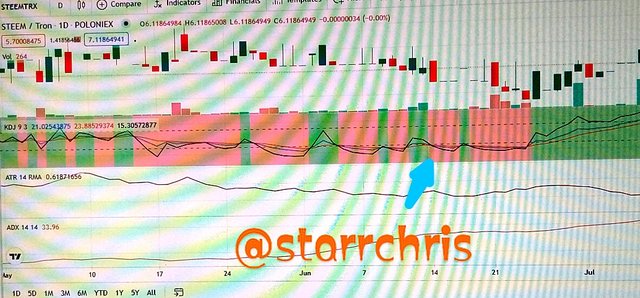
Sell
- Note the background color changes to red there is a sell signals (updated version).
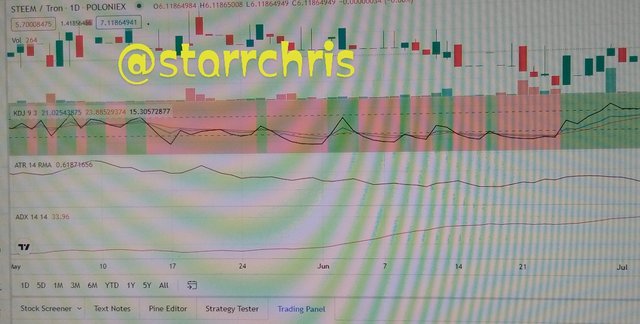
I have selected steem/tron, the KDJ indicator - showed me a sell signal when the J
Signal move downward after all three lines (K,D,J) intersects at a point.Then on June 23 we again get a cross of the J line and the price was $6.1186.
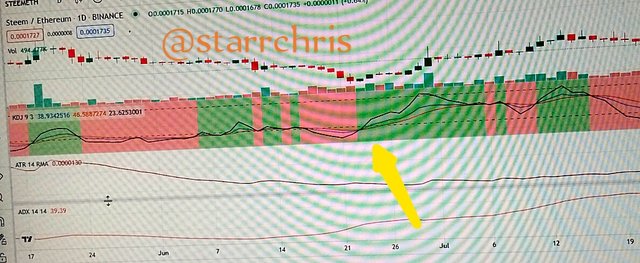
Buy
Note the background color changes to green when it a there is a buy signals (updated version).
I have selected steem/ethereum. The KDJ indicator showed me a sell signal when the J
Signal move upward after all three lines (K,D,J) intersects at a point.
Then on June 23 we again get a cross of the J line but this time the price was 0.0001715.
Conclusion
The KDJ technical indicator is used to analyze the price trend of an asset for a particular period of time, thou no indicator can be 100% perfect but KDJ is close to perfection, so traders can use it with other indicators to make a perfect prediction, traders could reduce the probability of losing their fund. Thank you Professor @asaj for your educative lecture. Thank you for going through my post.

I learnt alot from your post. Would definitely apply it 😁😁
Thanks alot
Hi @starrchris, thanks for performing the above task the eighth week of Steemit Crypto Academy Season 3. The time and effort put into this work is appreciated. Hence, you have scored 4.5 out of 10. Here are the details:
Remarks
You have demonstrated a good understanding of the topic. You have performed the assigned task excellently. However, your answer to task 5 could have been better if you had analysed two coins with clear charts providing the buy and sell signals as well as a screenshot of your demo account summary. Also, you did not provide the level of details we look out for in the academy.
Ok prof @asaj but i tried my best to write the post and it was not stated to screen shot my demo account, and i don't have a system or a good phone to get clearer picture, i had to borrow some one system and paid a little cash to him to be sincere i feel like crying, at least you would have scored me at least 5
Thank you professor @asaj