Crypto Academy Week 14 - Homework Post for [@kouba01]

INTRODUCTION
When trading, traders may face some certain difficulties while reading charts or predicting markets, with the fear of making wrong choice which may lead to a loss or luckily a profit but either ways with a high risk and huge gamble. This where the use of technical indicators come in, they help narrow your options, predict market trends and point out irregularities in market flow.
There are various types of technical indicators for trading, some are easier to use and some are pretty tricky. In our last class we studied about the RSI momentum oscillator and how it worked giving examples to show overbought and oversold markets while determining when to buy or sell.
Today, we’ll be talking about the MACD which is another popular indicator used by traders. I personally haven’t used it till i studied about it recently, i believe its quite impressive and i have alot to talk about it
WHAT IS THE MACD INDICATOR?
MACD is an acronym which stands for moving average convergence divergence. It is a technical indicator that measures the relationship between two moving averages of a market or stock prices.
It was created by Gerald Appel within the late 1970’s. It measures momentum of trends using MACD lines and zero lines. It lets traders aware of the strengths, momentum, duration and direction of trends in market prices.
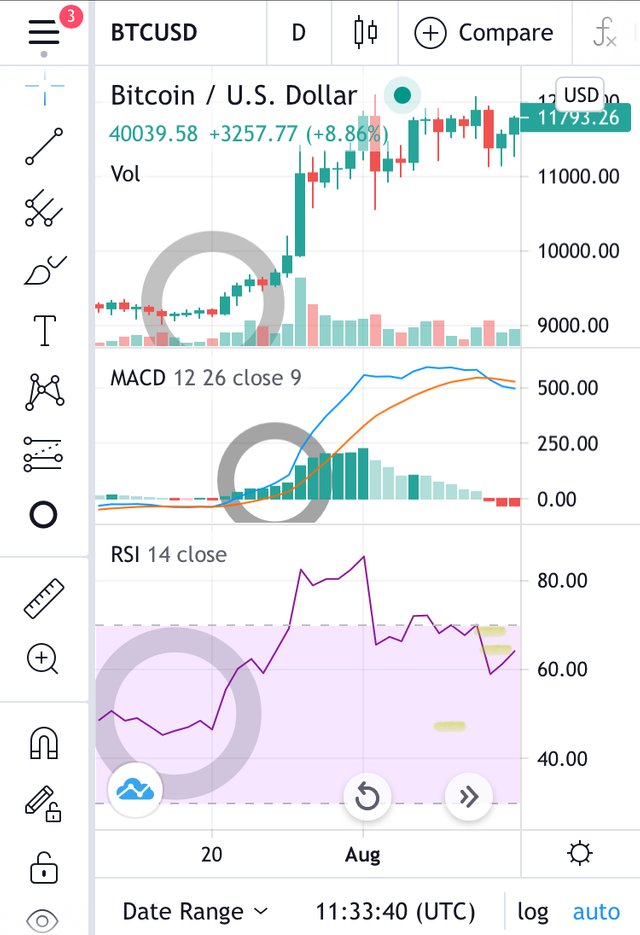
This gives traders a complete advantage over the market. It is usually displayed with a histogram which shows the distance between the MACD Line and signal lines
Whenever the MACD line is above the signal line, the histogram will be above the baseline or zero line.
If the MACD line is below the signal line, the histogram will be below the baseline. Histograms help traders identify when the bullish or bearish momentum is high in a market.
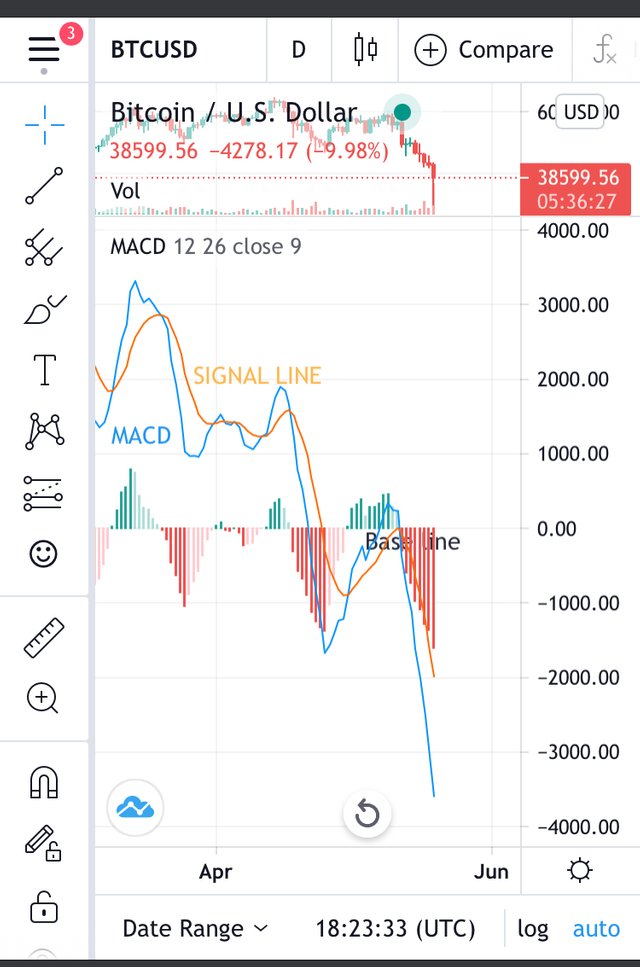
With a clear diagram and the labeled name you can see clearly where the MACD lines and signal lines are
I’ll futher more explain what the MACD lines, signal lines and histograms
MACD LINE
The MACD line is the blue line above which shows the difference between two exponential moving averages(EMA). It is usually set to take the difference of 12 period EMA and 26 period EMA of underlying securities.. it is considered to be the faster moving average.
SIGNAL LINE
The signal line is depicted with the orange colour. It is the moving average of the MACD line. It is considered to be the slower moving average
HISTOGRAM
The red and blue bars seen above are the histograms in this technical analysis. It shows the difference between the MACD line and SIGNAL line. If you look at the charts yiu can notice that whenever the MACD line and SIGNAL lime seperate the bars get bigger. Its also known as MACD divergence, because the faster moving average is moving away from the slower one.
BASELINE / ZERO LINE
Its the base of the histogram. It represents the zero
line on it
IS THE MACD GOOD FOR CRYPTO TRADING?
Frankly speaking, like some other technical indicator, the MACD has been very useful to crypto traders and traders in general for predicting charts and detecting trends using moving averages. At the same time most professional traders dont often stick with one technical analysis.
I feel like the use of the MACD indicator in trading would be much more resourceful if partnered with other indicators such as the RSI. Indicators may have flaws even the MACD oftenly give off false signals.So it sure wouldnt hurt to get different perspectives and know which move to make now is it?
MACD is good for crypto trading but should be backed up with other indicators for a more efficient result.
MACD vs RSI
The RSI stands for relative strength index which is an oscillator that calculates the average losses and gains over a given period of time.
The MACD seeks to measure the relationship between two exponential moving averages whereas RSI indicate price changes which shows when a particular security had been overbought or oversold.
They are often best used together to achieve a more effective trade. That aside this is mostly an objective side of view. Personally I would use the both any day any time but if i was limited to only one choice then i would pick the RSI.
The RSI has its perks and sometimes give wrong signals but there are ways to go about it to avoid mistakes easily plus its the mostly picked one between the both whereas the MACD has some certain limitations which are of some concern to me for example
One of the main problems with divergence is that sometimes it could signal a possible reversal with no actual reversal happening. It indicates many reversals that don't actually occur and less accurate price reversals.
I guess if im to have a go at one then ill choose the RSI.
How to add the MACD indicator to the charts
Ill be using trading view website to illustrate this procedure
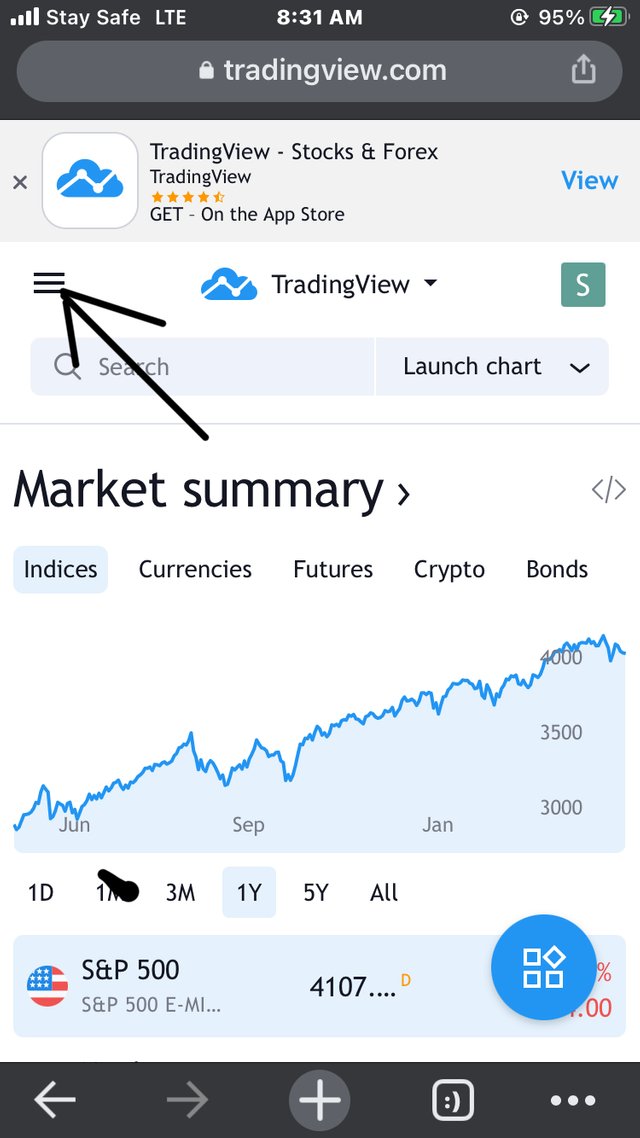
Step 1 - first you open you website(https://www.tradingview.com/)
Step 2- you click on the menu option on the left hand side of the monitor
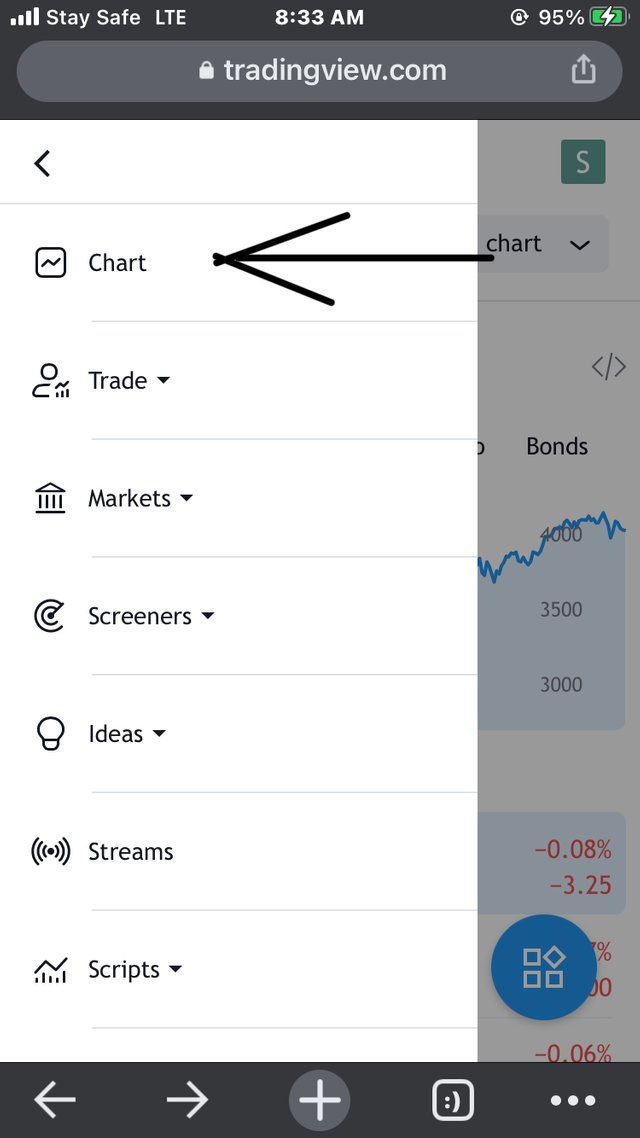
Step3- you click on the “chart” option
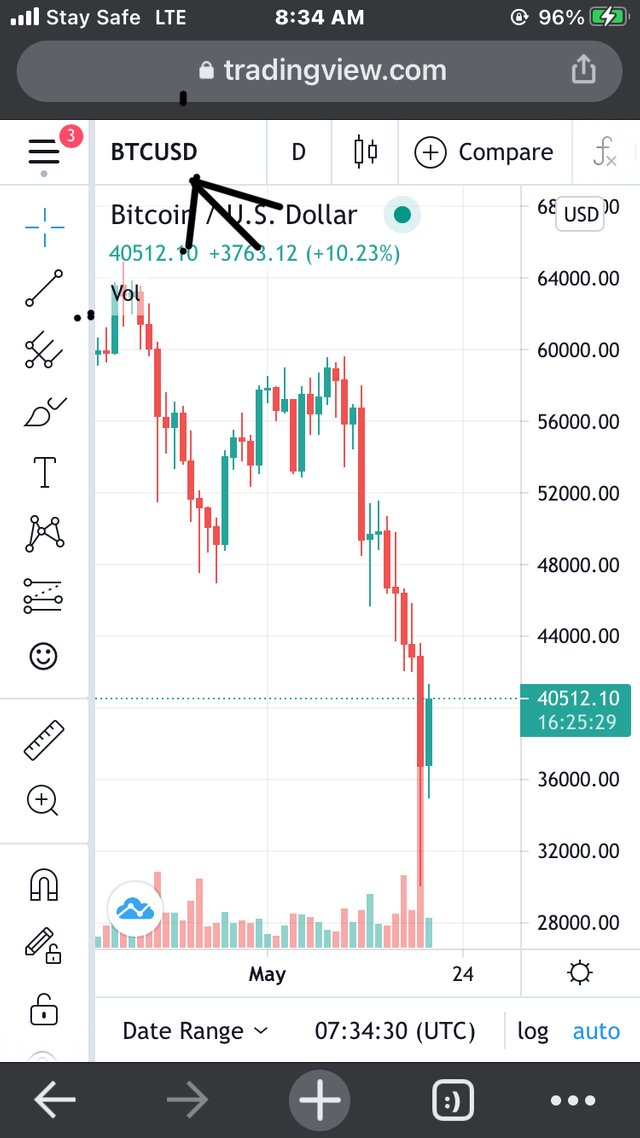
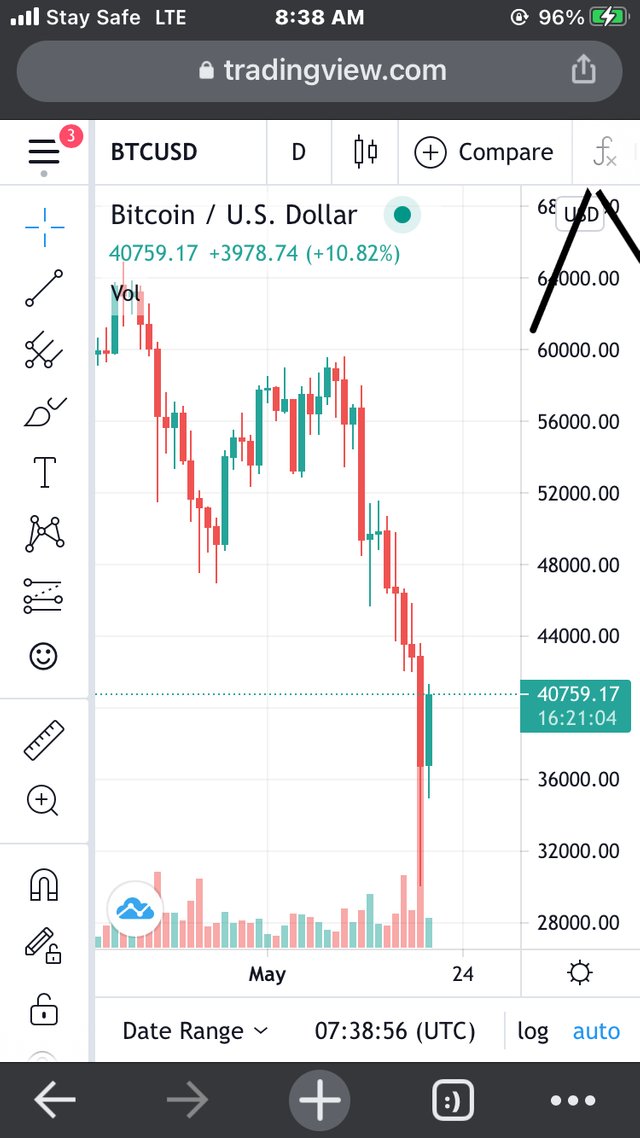
Step4- select a pair currency. (Ill be using the BTC/USD pair)
Step5- click on fx indicator to input your MACD
Step6- search for the MACD indicator and click on it.

Step 7- now it is on the front page you can tap on it and see the pop up options with its configuration settings
SETTINGS
Step8- you click on setting which is in the middle to configure your MACD
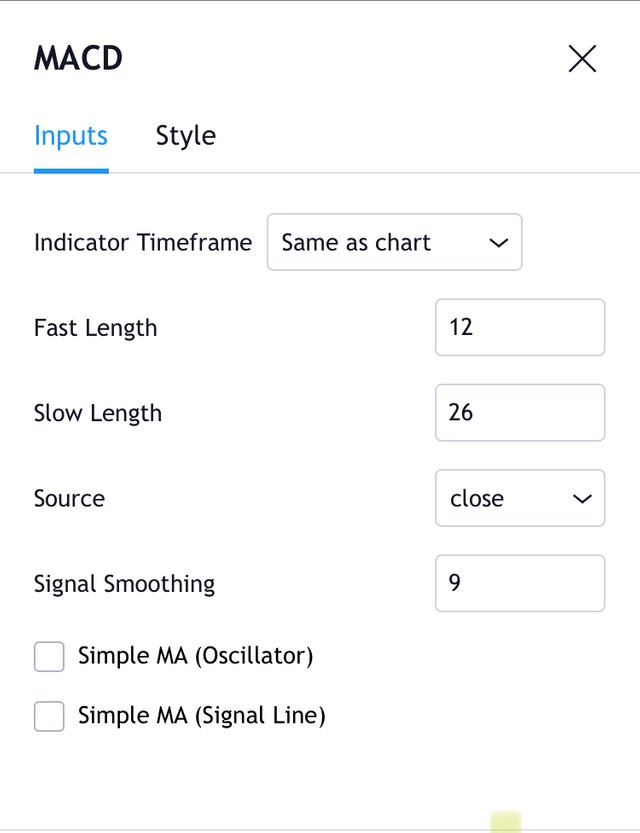
INPUT
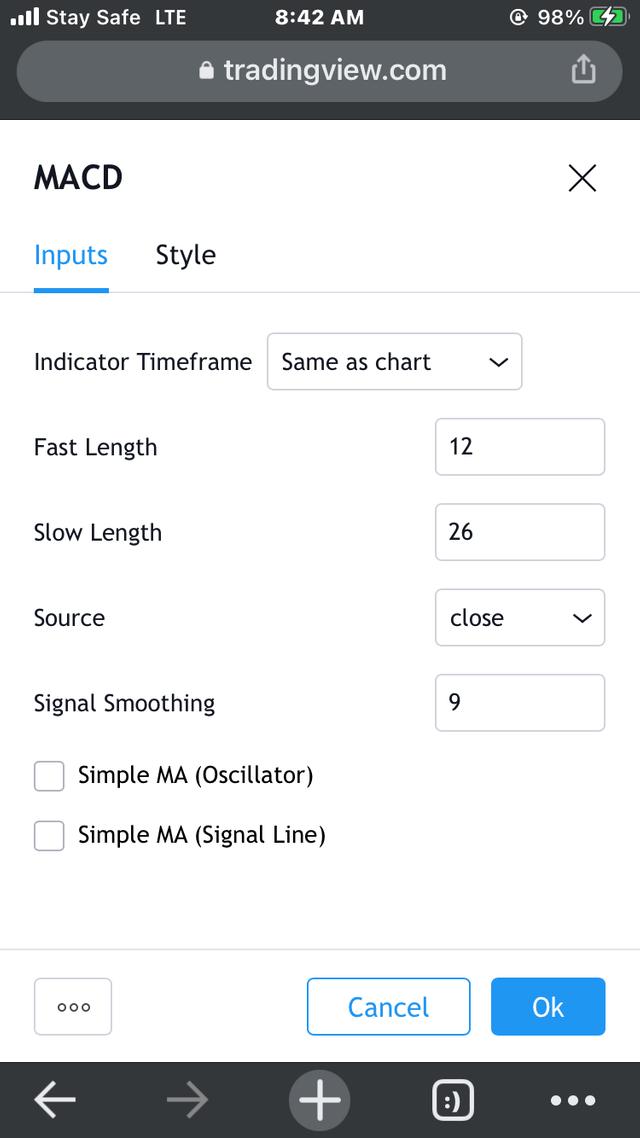
Indicator time frame-
This is the amount of time considered on the indicator with reference to the charts.
The MACD is analyzed in three time frames namely the 4 hours, 1 hour and 15 minutes. The ratio of each time frame to the next is 4:1.
Fast length-
This is the period of the fast exponential moving averages with reference to the MACD line. It’s default is usually at 12. It is alao known as the fast line
Slow length-
By deafult the slow length is 26 which is EMA period. Its value is higher than the fast length. It is also known as the slow line
Concurrently they are both subtracted 26day EMA -12dayEMA which gives a 9day EMA that is used as a signal indicator on the MACD.(signal line)
Source-
this is the fixed price which the indicator works with
Simple MA oscillator-
when selected, dimple moving averages would be used for the MACD Line, if you choose not to use this then the EMA will be used in its place
Simple MA single line-
when selected ,the simple moving average is considered for the signal line
In both cases though exponential moving averages are mostly used because they respond faster to trends than Simple moving averages
STYLE
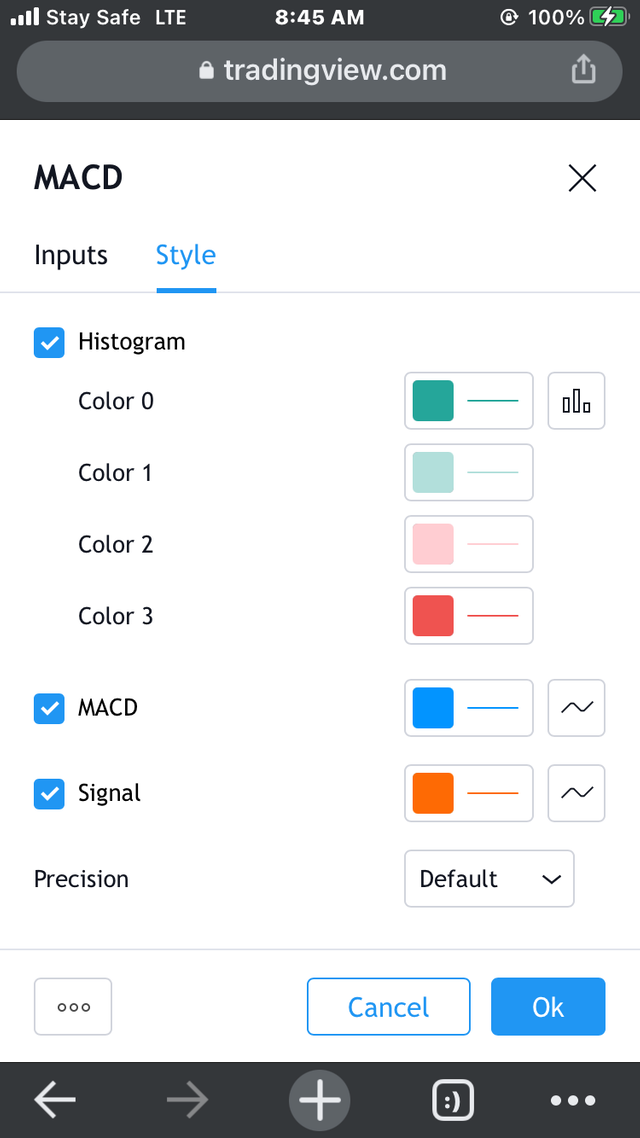
This is basically for editing your charts or styling it.
Using different colours can help identify vharts or bars easily and keep your work arranged
We have the options for
The historgram, MACD and Signal line, traders may use any as they please.
How to use MACD with crossing MACD line and signal line and with the crossing of the zero line
Crossing MACD line and signal line
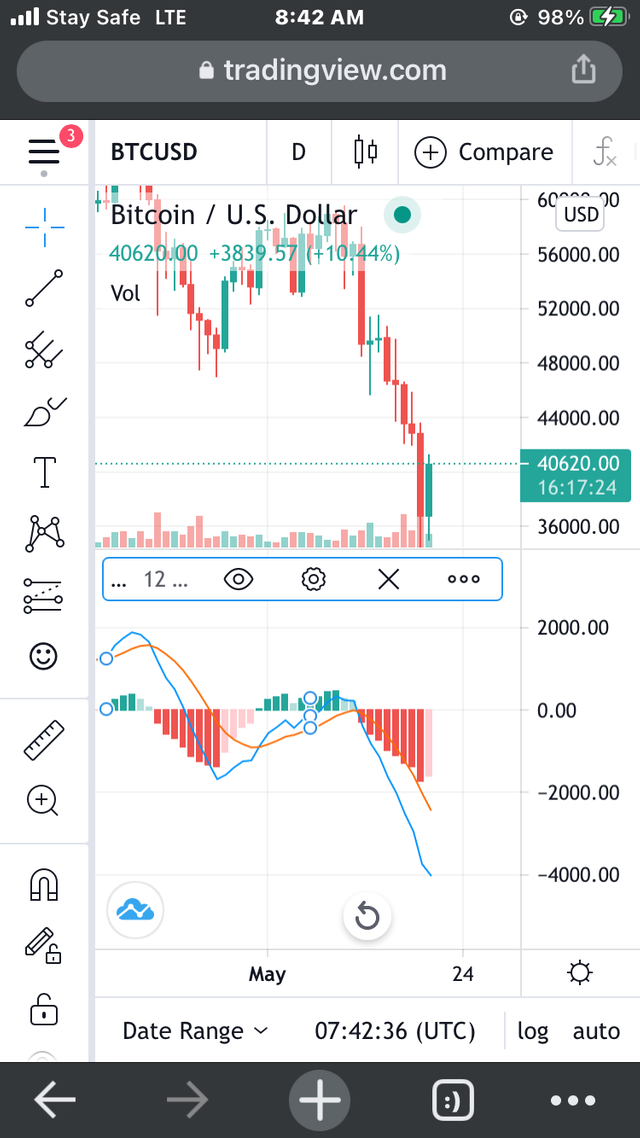
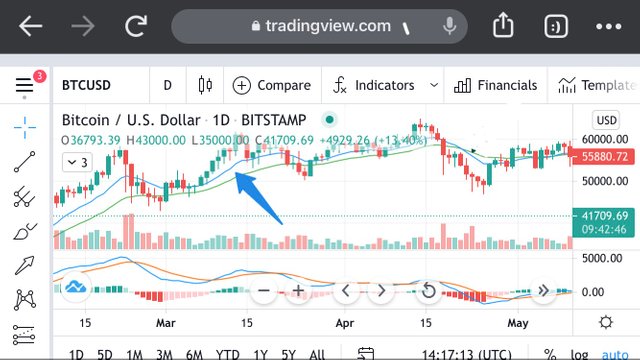
Using the BTC/USD pair you can notice from the indicator that the MACD line crosses the signal line from two sides.
1). When the MACD line crosses the signal line moving below it, it means there would be a possible sell or short signal.
2). Also when the MACD line crosses the signal line moving above it, it means there would be a possible buy or long position.
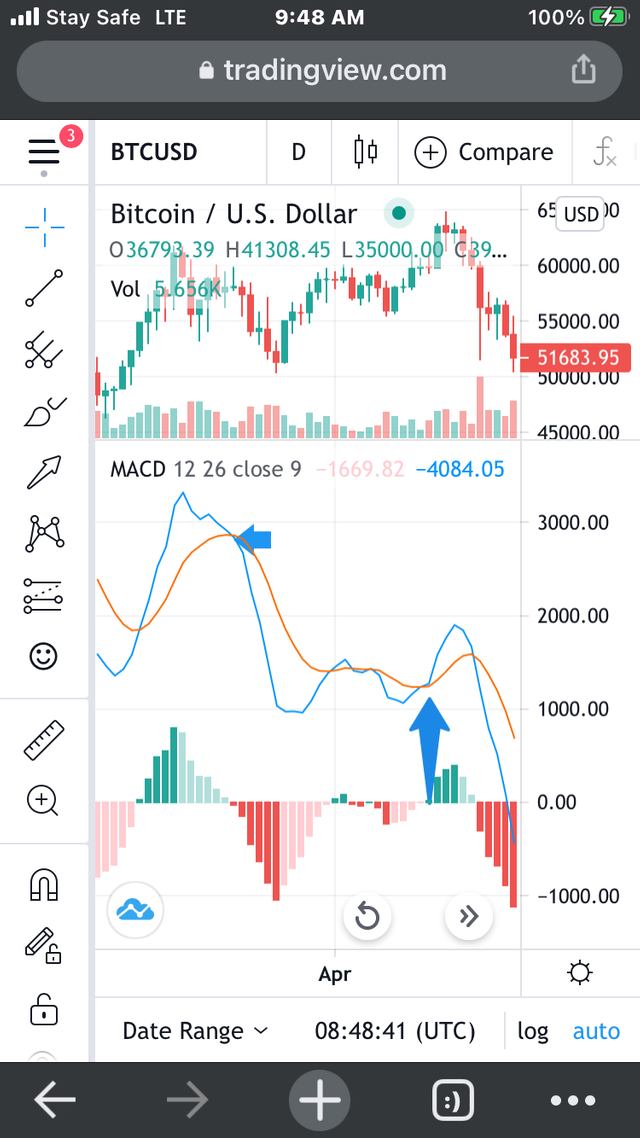
The first arrow depicts the MACD lines movement crossing the signal line below, showing the gradual decrease in price of BTC. The second arrow shows its movement crossing above the line signify an increase in price
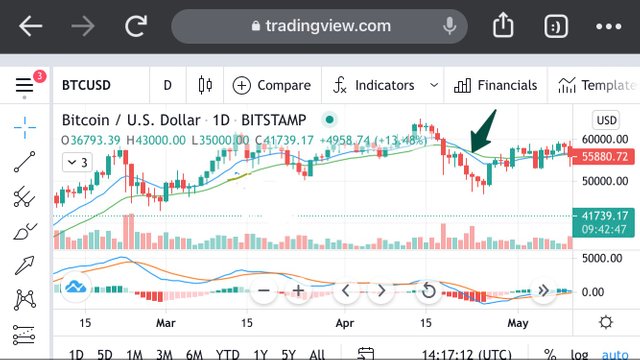
Crossing of the zero line
The MACD line can sometimes cross the zero line to show a possible trend. When the MACD line moves below the zero line, it means its a possible sell or short position and vice versa, when the MACD line goes above the zero line, it means its a possible buy or long position.
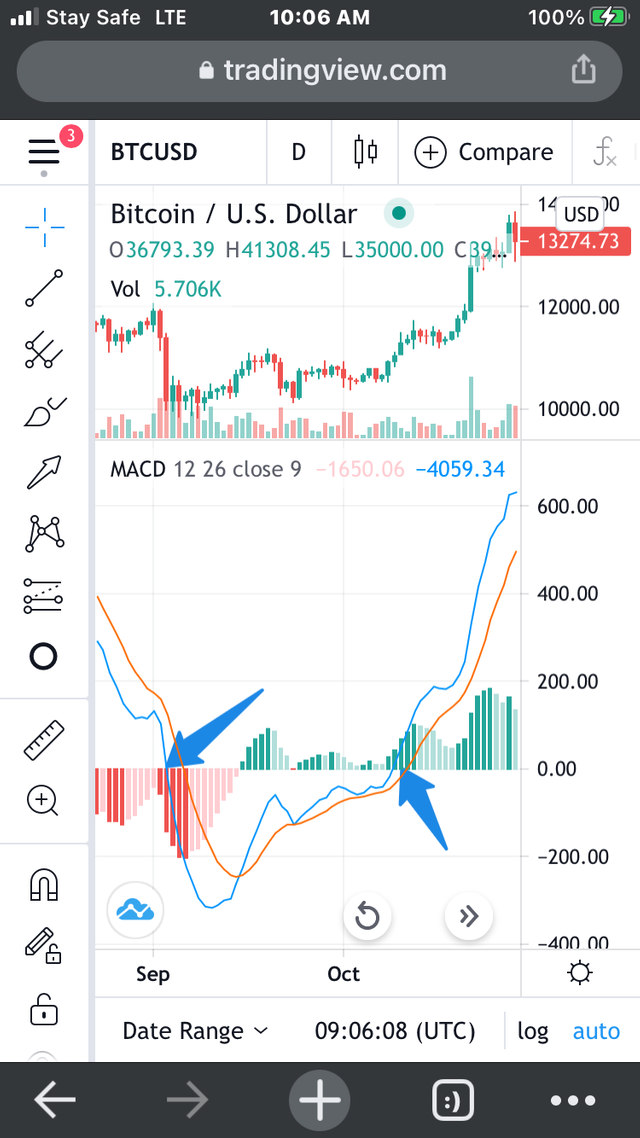
The first arrow on the left showed a downward trend 📉 going below the zero line, this was following by a decrease in price, where as the second arrow on the right showed an up ward increase in price just as it moved across the zero line.
How to detect a trend using the MACD and how to filter out false signals
There are different methods to finding trends in a market with the MACD. Ill list and explain some of them.
MACD and signal line/zero line Crossovers-
There are usually crossovers betweern the MACD, signal line and zero line. Each representing a drease in price or increase. Fro the illustrations given above you can see that they are all trend signals and following those instructions you can be able to detect them.
Histogram Reversal
The histogram on the MACD are represented by those green and red bars on the base line of the MACD indicator. Theses bars show trends by the deepness of their slope and length.
There can be Long bars during a bullish or bearish market , these bars are usually strong trend either spiking hard or dipping hard. At some point when the market begings to correct these irregularities, the bars read them and starts coming back to a normal flow.
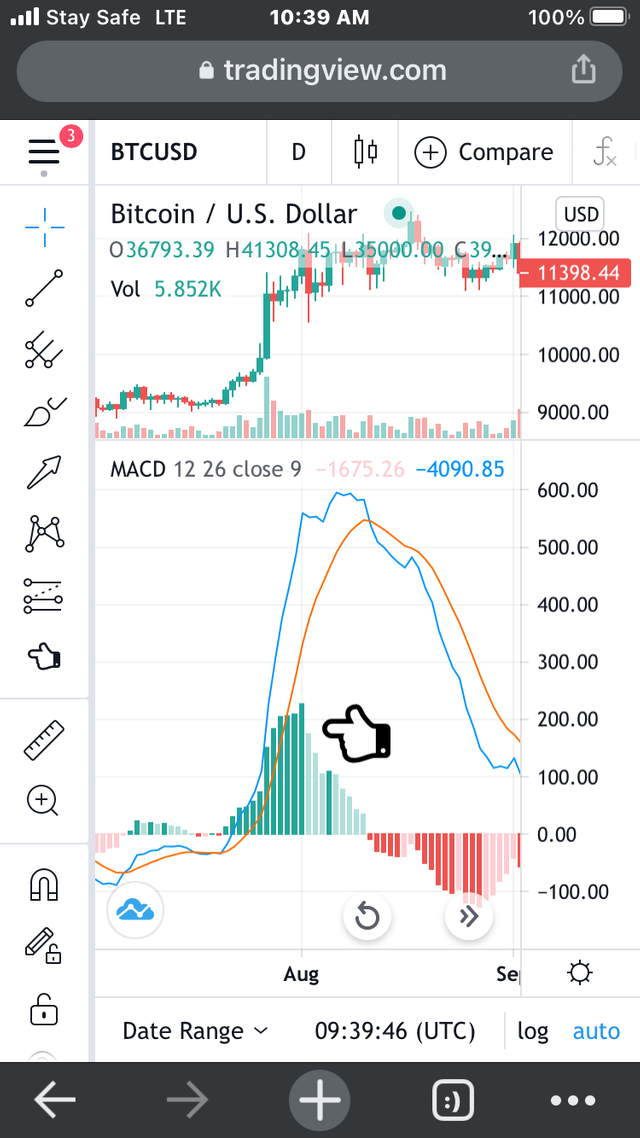
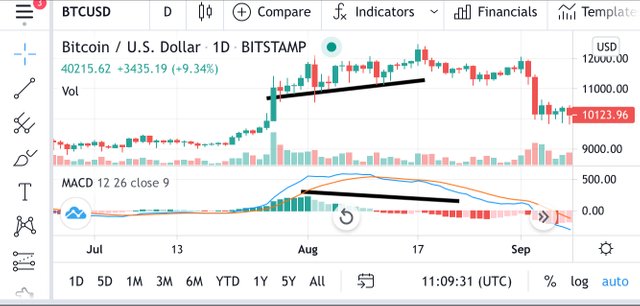
From the charts above you can see that there was a spike in the price of BTC and so the bars went went up, with time it begins to go down back to normal.
Divergences
The MACD can sometimes move different from the the normal chart flow movement this is called a divergence. They can usually lead to trend reversals There are two types of divergences namely.
• THE BULLISH DIVERGENCE
• BEARISH DIVERGENCE
Bullish divergence:
This bullish divergence occurs when the chart pattern moves low but the MACD line moves slightly in an upwards signifying a reversal from the downtrend to an uptrend .
Bearish divergence:
The bearish divergence occurs when the chart flow moves upwards but the MACD moves in a downward . This would likely lead to a reversal from an uptrend to a downtrend.
How to filter out false signals
The MACD might be a great indicator but as such it is not without it flaws, which is why it is up to the trader to figure out which signal is right and wrong to cancel out inevitable risks
• Using multiple indicators :
Most traders like i stated earlier don’t usually stick to one indicator some times they may use two or three to verify a particular signal for trading. This helps them avoid risks and achieve an efficient work , so far so good it has been very effective. The use of MACD with the RSI is one of the most common combo that traders use. These indicators are combined to get better trading signals. Using the RSI it would show price movements while the MACD would confirm it.
During a bullish trend, the RSI would be above 50 while the MACD would confirm it (the MACD line would go above the signal line and the histogram will spike green.
Asides the RSI there are many other indicators that can be used such as the VWAP, SMMA etc
• Changing the settings in volatile markets:
The volatile markets can be sometimes decieving , therefore to ensure a successful trade you can change the settings to shorter periods so the MACD can be more reliable during the market movement.
How can the MACD indicator be used to extract points or support and resistance levels on the chart?
To extract resistance and support from the MACD, you’ll have to bring up the Exponential moving averages that the MACD line is calculated in.
MoVing averages usually form resistance. They track the movements of prices with the EMAs moving faster than the SMA. Ill be illustrating using live examples with defaults on 12 and 26
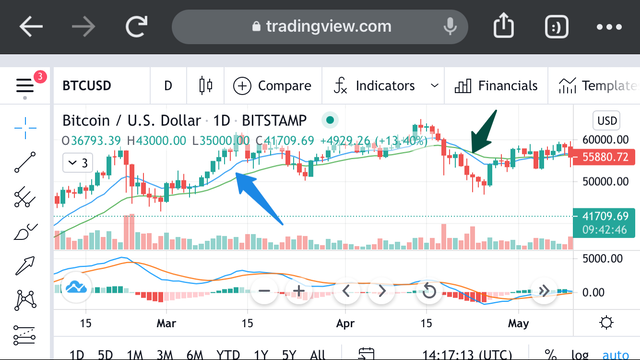
In the picture below you can see that when the charts were going up or having an uptrend, the two EMA lines went under the candle sticks with the 12 period EMA (blue) acting as the support. The price continues flunctuating upwards with no significant increase and then downward .
Whereas in the picture below you can see that after breaking the 12 period EMA, there is a downtrend. The Fast EMA (blue) crosses over to form a resistance above the price while the green EMA follows above it and after this resistance it generally goes up again.
Review charts of any pair and present various MACD signals
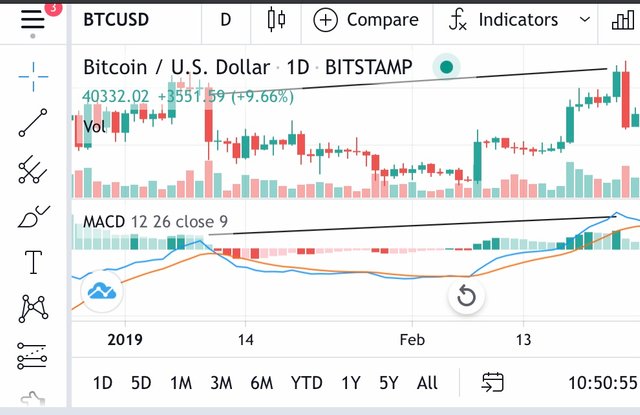
Ill be using the BTC/ USD today which is having a pretty rough review as seen on the news around
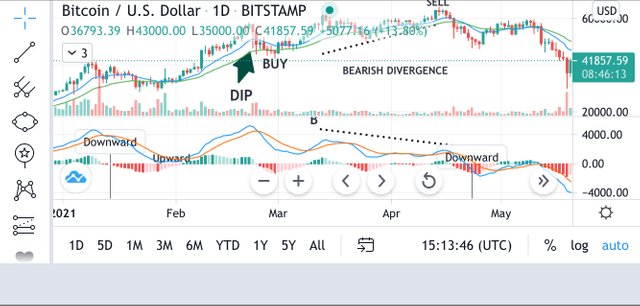
You can notice that the chart shows patterns of highs at one point but the MACD Shows otherwise which is going to lead to a possible down trend as a bearish divergence.
There were a couple of dips but i noted some. With each time the two lines crosses (macd,signal lines)there is a corresponding down trend and up trends. Where a dip was noted as soon as it was over the MACD showed signs of an uptrend which in this case should be bought as written on the charts above.
The prices fluctuate for a while moving towards another dip which in this case a trader would have to sell to avoid the risk of loss
In conculsion
I have come to understand alot while using the MACD and studying it. The MACD like i said is impressive but although like every other indicators isn’t perfect. Itll be really advisable to use more than one indicator while trading to ensure a better outcome. I used the BTC/USD pair which is a common pair to illustrate alot of examples using the MACD. I hope for a more lovely Homework task like this next time and good bye 👋.
Cc.
Hello @spyrex,
Thank you for participating in the 6th Week Crypto Course in its second season and for your efforts to complete the suggested tasks, you deserve a 7/10 rating, according to the following scale:
My review :
Good content, through which you succeeded in answering most of the questions successfully, even though some of them lacked some depth in the analysis.
Thanks again for your effort, and we look forward to reading your next work.
Sincerely,@kouba01
Thank you