Understanding the trend/ Crypto Academy / S5W1- Homework Post for @reminiscence01
Thanks professor it's a well detail course.
Hello professor @reminiscence01 , I didn't earn much reward to power up for the last one month but I make this post 100% power up maybe it would work but I promise to keep powering up for two weeks
All charts I use in this assignment task are from TradingView, I edited it with ImarkUp by me
1 (a) What do you understand by a Trending market?
(b) What is a bullish and a bearish trend? (screenshot required)
Trending Market is situation whereby prices are moving in one direction, the direction could be up or down, but cannot be sideways. There may be different small price whirl, but there's nothing large enough to have impact in the general trend direction. Some trends are able to last for minutes, some could last for hours, some could even last for one weeks and some last for months if it's longer term trends.
The price may not go in line with the trend every now and then, but if you watch the longer time frames, you would notice that they were just retracements. Usually, trends are noted by higher highs and higher lows in an uptrend while it's always lower highs and lower lows in a downtrend.
Bullish Trend
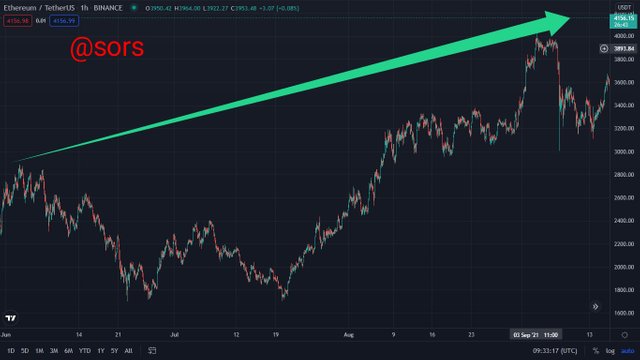
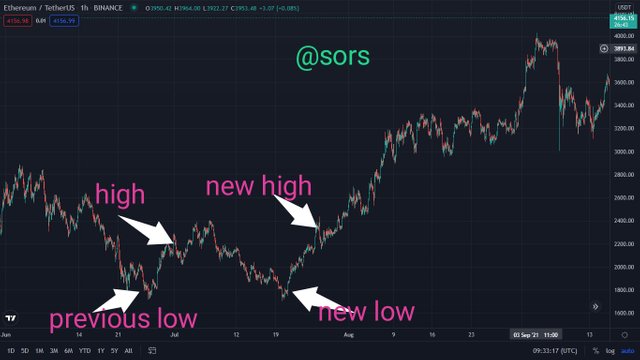
In a market structure, if we notice that market is forming a higher-high and higher-low structure, it simply means that the price didn't trade below the past or previous spatial position and still surpass the previous high point. This trend shows currently, buyers to keeping the price or pushing prices higher and it result to an uptrend.
Bullish trend is an upward price trend in a market or the entire rise in wide market convention, characterized by big investor certainty.
Bearish trend
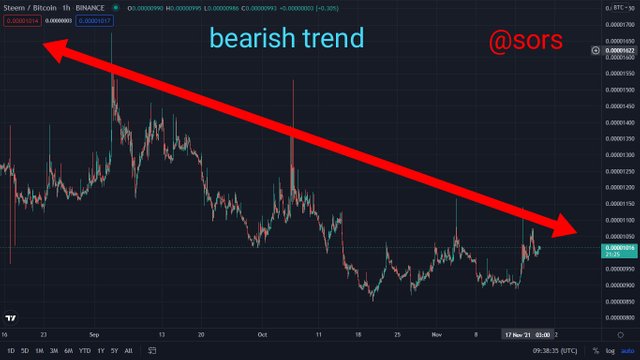
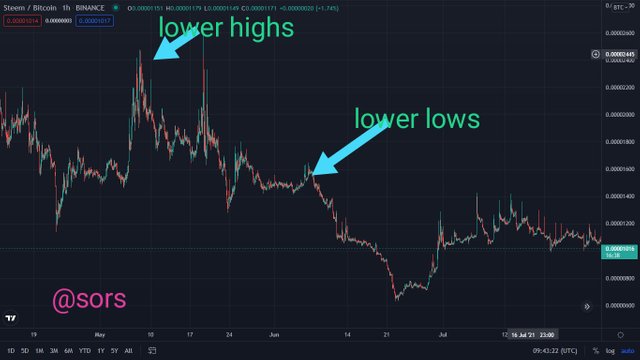
In market structure, if we notice that market is forming lower highs and lower low structure, it means the market price didn't go more than the past spatial position. Same way, price breaks the prior low point that signify strong momentum to the downtime.
Of course Bearish and bullish are opposite to each other. As we understand that Bullish trend is forming higher highs, then Bearish trend is forming lower lows
2. Explain the following trend identification and give an example of each of them. (Original screenshot needed from your chart). Do this for a bullish and a bearish trend.
i) Market Structure.
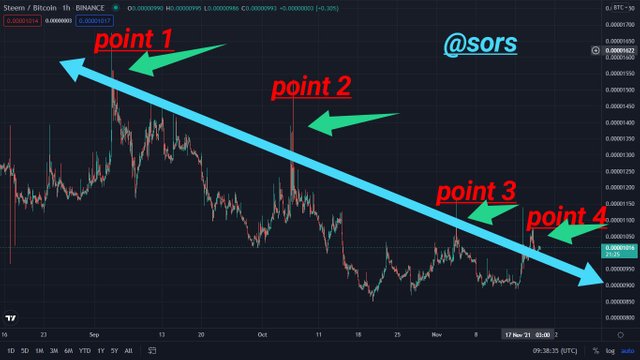
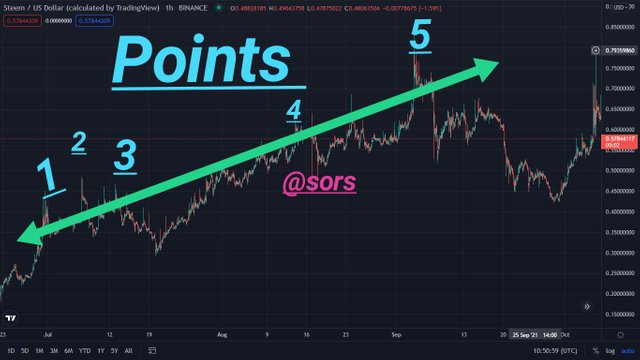
ii) Trendlines
Market structure is a trend tool which traders watch and make use of, based on how a market trends moves. The movement from bullish trend to bearish trend and in between with ranges.
Often, we referred market structure as Price action because that's the way all market moves. Market structure makes traders understand the trend and the expected moves and you would be able to add other trading indicators to make your trade qualify. Indicators like ADX, pivot points, moving averages, etc.
Types of market structure are Bull trend, Bear trend, Sideways trend.
Trendline
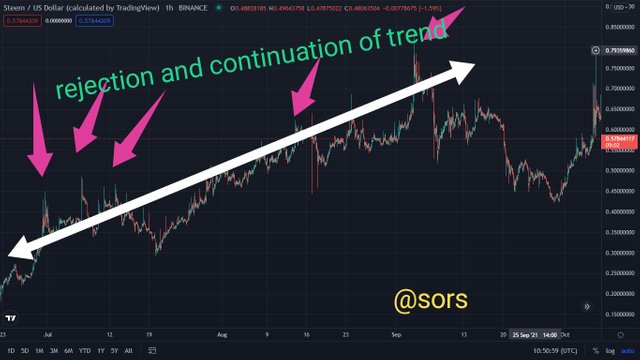
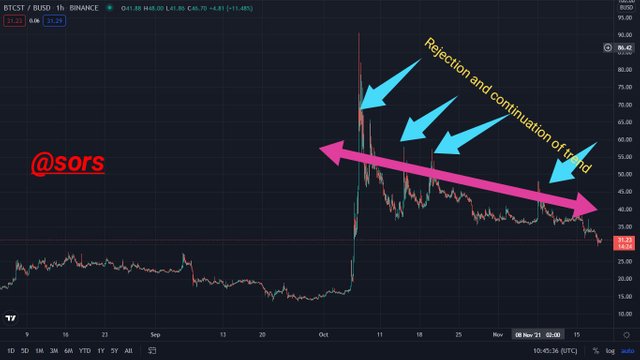
A trend line is a pattern that explains many highs or lows which form a straight line.
Trendlines is a concept of joining two or multiple of price points with a straight line.
The aim of a trend line is to know the concerning price trend movements and to point out support and resistance levels.
In technical analysis term, Trendline is one of the basic part of other chart patterns like wedges, trend channels, flags, and triangles.
Uses of Trendlines: To point out and confirm, to predict support levels and resistance.
Trendlines can be made of highs and lows. Highs is resistance, while lows is support.
Trendlines are of two types which are Ascending and Descending
3. Explain trend continuation and how to spot them using market structure and trendlines. (Screenshot needed). Do this for both bullish and bearish trends.
In a market chart 📈, price does move in a straight line, it is always unstable, it looks Zig Zags, the zig zags are how the price flow ups and downs, how the buy and sell flows. In the zig zags is where buy and sell signal is,
Trend continuation is one that shows a slight inclinations for the trend to move on in the same direction after a continuation pattern as it once did before.
But It's not all propagation patterns that will result in the trend continuation. Many of it result in reversals. While waiting for the breakout, traders will be able to see which one it will be.
How to spot trend continuation
Whenever the market is trending, traders look for hint on the price on how the price would keep moving, whenever trend reestablish either forward or it would reverse.
To spot a trend continuation, patterns like triangle 🔺, rectangles flags and pendants. And these patterns can be identified on any time frame chart.
Triangle
You can know the triangle pattern on a chart 📈 when you draw two lines on the price bar that look like triangle shape. But when the price forms triangle shape, it would move from big trading range to narrow trading range.
Price don't stay in a place for long, so whenever the price form triangle, traders should use it to anticipate price will break out of the triangle once it form.
Rectangle
Whenever the price is forming, and price move in narrow range, rectangle would form when highs and lows is consistence. Price will likely exist the forming direction it entered.
Flag
When price retrace for a short time in a parallel range, flag would form. The forming is called flag because it look like a flag. And flag is useful for showing price period retracement. Whenever price break out of tight forming, it moves higher, and resume to its original trend.
Penant
Penants forms like triangle, we called them small triangle and they work in the same way with triangle. They don't take long time to form so they are called mid-trend.
4. Pick up any crypto-asset chart and answer the following questions -
i) Is the market trending?
ii) What is the current market trend? (Use the chart to back up your answers).
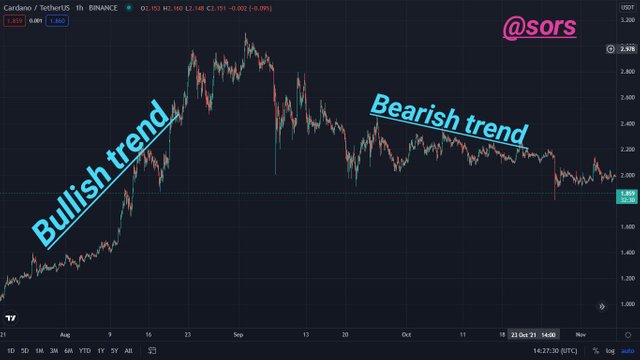
i. The trend can't be in straight line, it always form. Yes the Cardano Tether market is trending, the trendline is in form of zig-zag, so it's showing the ups and downs on how the market is moving and where possible take profit it.
ii. The market has two trends; Bearish and bullish but the Bullish comes first, and the bearish comes next. So, the current market trend is bullish.
Conclusion
With the Trendline and Market structure, we can be able to identify the trend. Trend could be bearish and it could be bullish, what's important is to identify it. Trendline and structure helps in knowing what the next market could be and the next market step.
Hello @sors , I’m glad you participated in the 1st week Season 5 of the Beginner’s class at the Steemit Crypto Academy. Your grades in this task are as follows:
Recommendation / Feedback:
Thank you for submitting your homework task.