STEEMIT CRYPTO ACADEMY SEASON 5 BEGINNER COURSE: Crypto Academy / S5W6- Homework Post for @reminiscence01" by @sonofremi
Made with canva
Merry Christmas! It's such A blessed and wonderful day to be a member of this highly educational and professional community, it's always a privilege to participate in any crypto academy course.
I am Kenechukwu Ogbuishi also known as @sonofremi, and today I will be answering 4 questions based on professor @reminiscence01 course on "confluence trading".
Below are the answers to the questions

Q1 EXPLAIN CONFLUENCE TRADING. EXPLAIN HOW A TRADE SETUP CAN BE ENHANCED USING CONFLUENCE TRADING .
As always trading crypto currency Is a very risky and unclear affair.
The crypto financial market is a highly unpredictable and volatile environment, it is always very difficult to predict the next course of price movements or trend. That is why indicators and technical analysis tools are used to teĺl correct signals for a correct market entry.
The use of these tools and techniques is very determinant when it comes to making a choice in Trading.
We humans are not perfect, and we do not possess divine powers that can help tell the future, if we could there would be no need for technical analysis and the use of special indicators and tools to analyze the market.
The crypto or trading market is definitely a very flexible and volatile sphere, volatile in the sense that future price movements can never be 100% predictable, and this is the main reason and purpose behind the development and application of these technical analysis tools such as indicators.
This trait of volatility and flexibility in the price movements of assets and securities always calls for a trader to analyze for confirmations before making a buy or sell entry in the financial market in order to minimize loss and maximize profits.
A good trader must always be very patient, careful and resilient during his/her technical analysis, he/she must be very sensitive to signs and confirmations of their strategies and these signs of confirmations can come in different ways.
It can reflect on the price chart with a change in the color of a line of indicator e.t.c.
For a person to be classified as good trader he/she must make a strategy that works for them. As I explained above, a trader must always be patient and observant when he applies indicators on the price chart.
The above statement generally means one thing, and that is that crypto traders and analysts must apply or combine two or more trading technical analysis tools. They do this to validate and make sure a signal is valid, making effective market entries and at the same time accumulating maximum amounts of profits.
CONFLUENCE
When you hear the word confluence, what is the first thought or impression that comes to your mind?.
The first thought that comes to mind is "water".
Geologists or nature fanatics would define a confluence as the convergence of two or more different and distinctive water bodies at one particular point e.g a river, this point of interception is known as the "confluence". Here different bodies are intertwined.
From this above illustration one could map out or define confluence trading.
CONFLUENCE TRADING
In trading crypto currency in the financial market, it is always very essential for traders and analysts to master the act of combining two or more trading tools and indicators.
Confluence trading may be defined as the application of two or more technical analysis tools in order to determine the validity of a trader's signal or strategy.
i.e, A trader must combine the knowledge of Indicators to be able to read different trading indicators applied on a price chart.
Confluence trading is the use or application of two or more trading strategies, in order to filter out valid signals to make right decisions for market entry, and to minimize losses and maximize profit.
Therefore one can say confluence trading is applied when the strategy used and the technical analysis tool used always tally, that means they will eventually produce the same signal overtime.
Every crypto trader has a different strategy or way he approaches the financial market. An effective trade setup is always characterized by the use of two or more strategies, technical analysis tools, or indicators. It helps because not all tools or approaches are perfect in the financial market, one approach can fail at any time causing massive losses so one must be careful during analysis, hence confluence trading/strategy steps in.
Like the two rivers converging, there is a mixture of two things.
As I have put maximum emphasis on the application of two or more trading tools, it is very important to never rely on just one approach to the market.
Below is an example of when confluence trading strategy is needed.
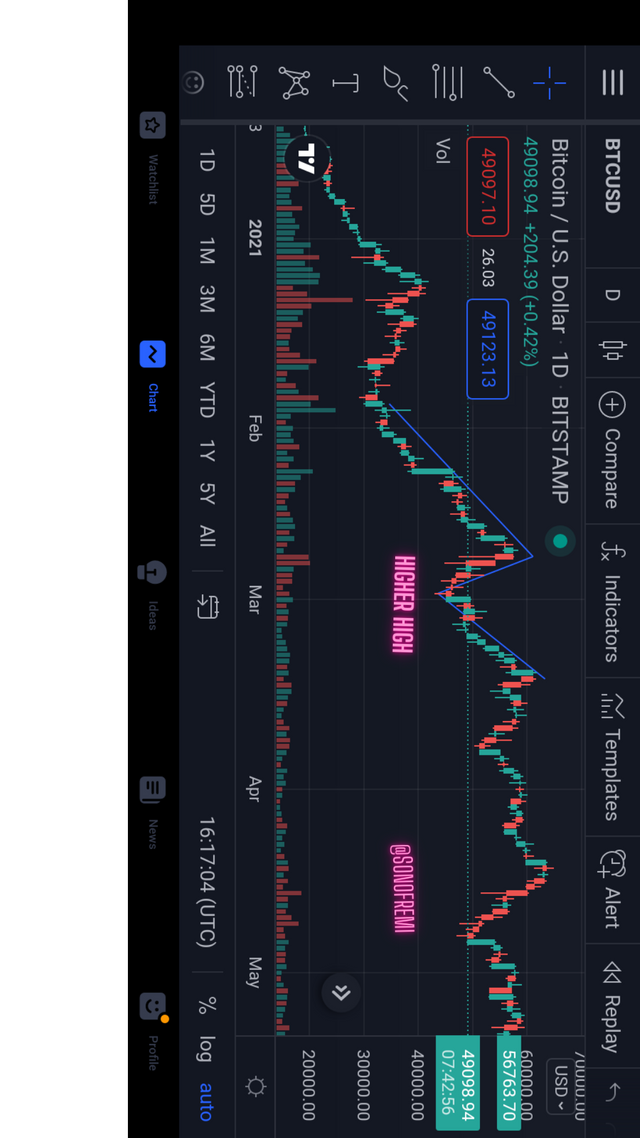
screenshot from trading view app.
In the above price chart, one can easily detect that the indicator used (RSI) is indicating a bullish trend reversal, that means at the end of the bullish run during breakout a bearish trend is expected to occur. But in this chart only one indicator was applied.
Let us apply more than one indicator or strategy and see how it pans out.
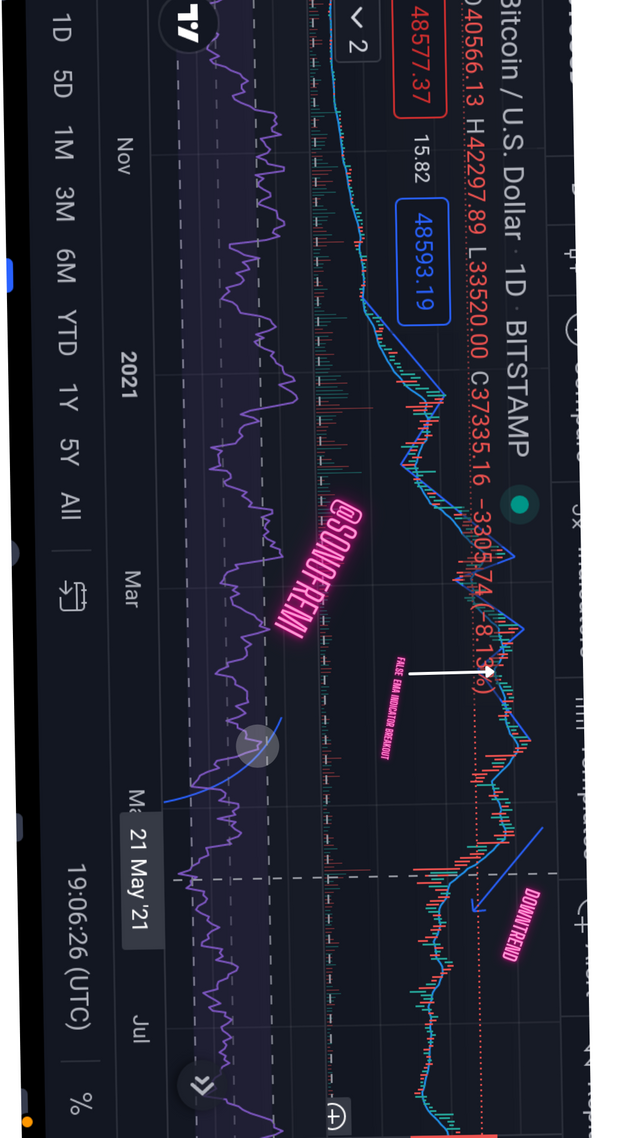
confluence trading
In the price chart above for BTC/USD, we can observe the application of more than one indicator. The RSI and exponential moving average. These indicators help in the confirmation of a strategy or signal.
As also seen above we can see a wrong breakout of the EMA Indicator. The EMA Indicator has failed to confirm the RSI signal. Had it been this was a trade entry the RSI would have produced a wrong signal and This shows the importance of using more than one strategy and technical tool on the price chart.
Q2 EXPLAIN THE IMPORTANCE OF CONFLUENCE TRADING IN THE CRYPTO MARKET ?
As explained above and in the images represented, the application or use of more than one trading strategy or tool is very essential in technical analysis, without this compromise and process one would have to rely on just one approach or confirmation to determine correct signals in the financial market and this can be a very risky affair for traders as one can hit massive loss.
It shows the importance of improvising and application of different methods without confusion.
Using one method to confirm if the latter is correct.
Let's list out some of this importance, they include:
They increase the chances of a trader winning and making profit in the market.
Good risk management.
It is an essential tool for filtering out correct and valid signals.
It enhances the boldness of a trader while stepping into the market.
It enhances trading skills and strategy
Now let's break them down one by one.
Confluence trading enhances or boosts a trader's chances of making profit in the market. It does this through the combination of different technical tools as explained above.
If you take a look at the second picture, you will observe that the moving average indicator made a false breakout, the RSI indicator stepped in to prove or confirm the signal.
Confluence trading gives a trader the upper hand in the market, because it gives him/her the knowledge to identify both efficient and inefficient trade set ups. Stepping into the market the trader will be rest assured that his trade has a high chance of generating high profit.
This shows the importance of applying more than one indicator on the price chart.
This is another vital importance of confluence trading.
Confluence trading provides more assurance in the market, by the use of different indicators on the price chart. This simply means that a trader finds it easier to set his/her take profit and stop loss on the right points on the chart.
Confluence strategy is the use of more than one indicator on the price chart.
These indicators can be used one by one, but it is always safer to apply more than one.
For example if we are using only the moving average indicator on the chart, there could be a breakout in the indicator, indicating either a buy or sell entry, but this signal could always be wrong as no indicator is perfect. That is why it is very important to use more than one.
This helps because if the two indicators on the price chart break out at the same point then it would be a clear indicator that the signal is valid and a buy or sell order can be made.
While trading, a trader always expects to observe a lot of confluence of indicators around any region of interest, this gives him the confidence to step into the market and make profit.
Confluence trading helps a trader develop more innovative skills to manipulate the price chart to his own advantage.
It gives a trader the knowledge to operate and understand multiple indicators on the price chart, and this increases his/her chances of making the right entry into the market to bring more profit and less losses.
It is therefore very advisable to consistently use the confluence set up that suits you in any given market. When used consistently, it increases the chances of making the right predictions everytime one steps into the market.
Q3 Explain 2-level and 3-level confirmation confluence trading using any crypto chart.
This type of confirmation confluence trading is likely seen only when two indicators are utilized on the price chart.
Here a trader makes use of just two indicators, depending on which particular ones suit his understanding, he uses them to confirm and validate signals on the price chart in order to make the right decisions on market entry.
The image below shows us a good example;
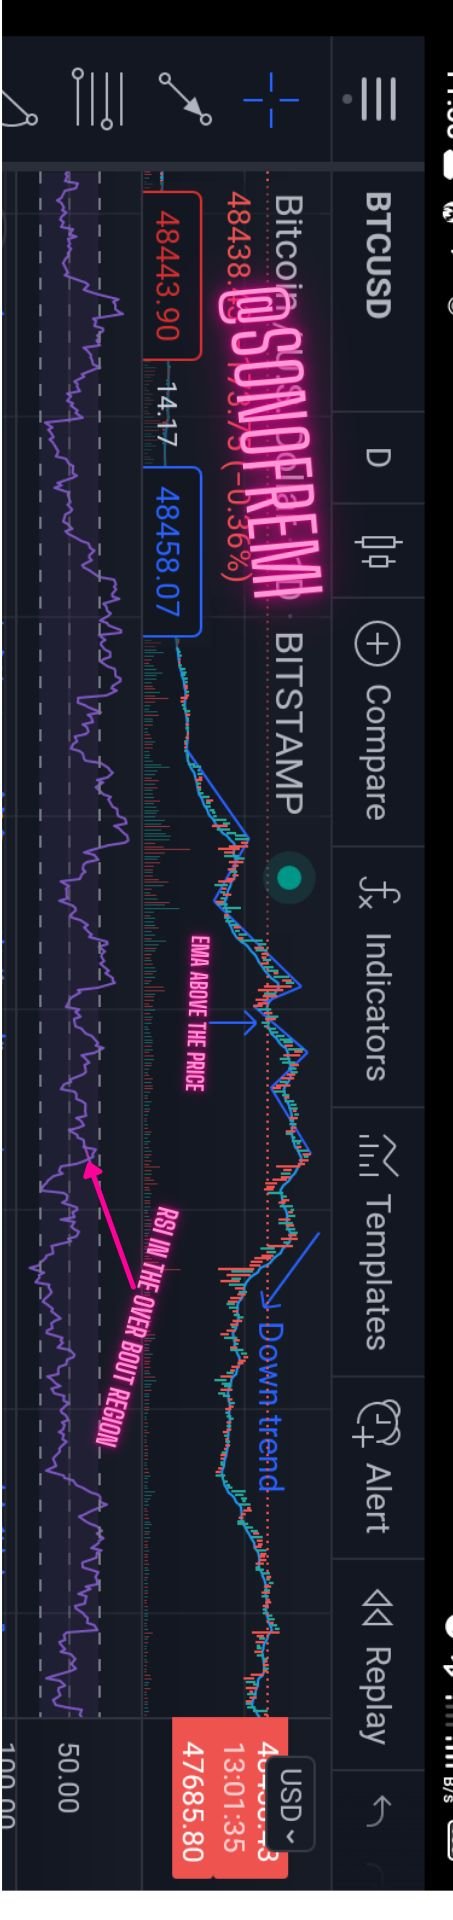
In the chart above, just two indicators were applied, the RSI indicator and exponential moving average.
In the chart one can observe that the RSI indicator entered the overbought region, before the price broke out to a bearish trend.
As it is never advisable to rely on just one trading signal, we then applied another indicator which is the exponential moving average. And when we did we saw the moving average break out above the candle sticks also signaling a bearish trend, and this confirmed that the signal is valid.
This type of confluence trading, as the name implies, involves the use of more than three indicators or strategies to confirm a signal on the price chart.
This is more broad as many indicators are involved, but it is better to use this, it is better than the 2 level confirmation. .
Let us use the image below for an example ;
Screenshot from trading view app
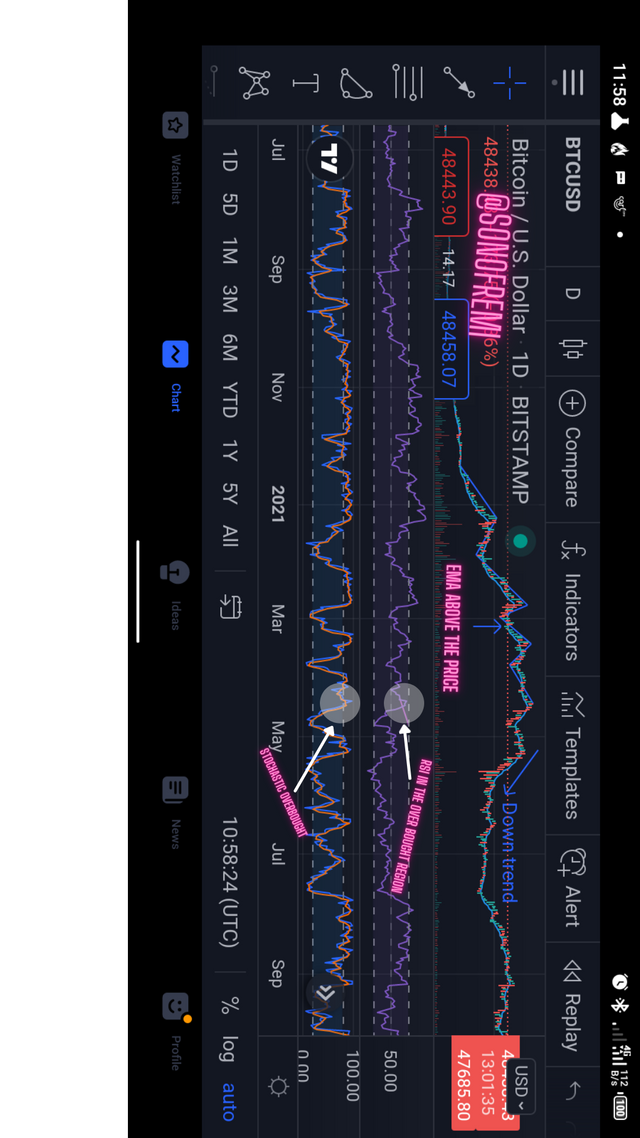
In the chart displayed above, we have three indicators confirming a bearish trend reversal.
First of all we can see that the exponential moving average, we can observe the break of structure of price above the candle sticks, indicating a bearish trend and a sell entry. This is the first confirmation.
The second was made using the RSI indicator, when it hit or entered the overbought region, also indicating a bearish trend breakout.
I used the stochastic indicator to make the third confirmation , it also entered the overbought region too. All this confirmation confirms the signal and tells the trader that it is the right moment to place a sell entry.
Q4 ANALYZE AND OPEN A DEMO TRADE ON TWO CRYPTO ASSET PAIRS USING CONFLUENCE TRADING . THE FOLLOWING ARE EXPECTED IN THIS QUESTION . (a) Identify the trend. (b) Explain the strategies/trading tools for your confluence. (c) What are the different signals observed on the chart?
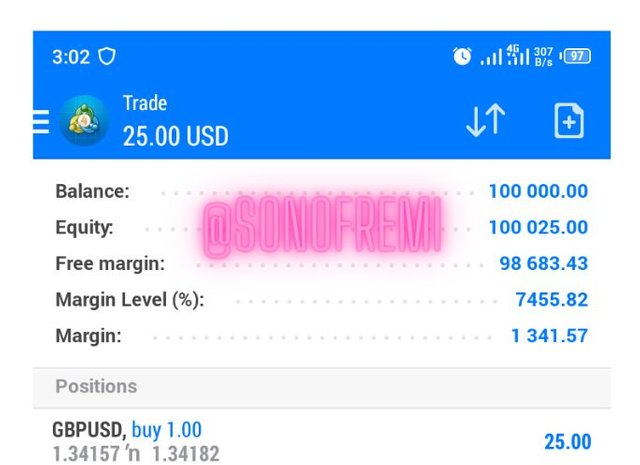
- BUY ORDER;
- THE price chart I displayed below is that of GBP/USD, configured to a time frame of 1minute.
As we can observe from the chart, one can observe that price was making a series of lower lows and lower highs
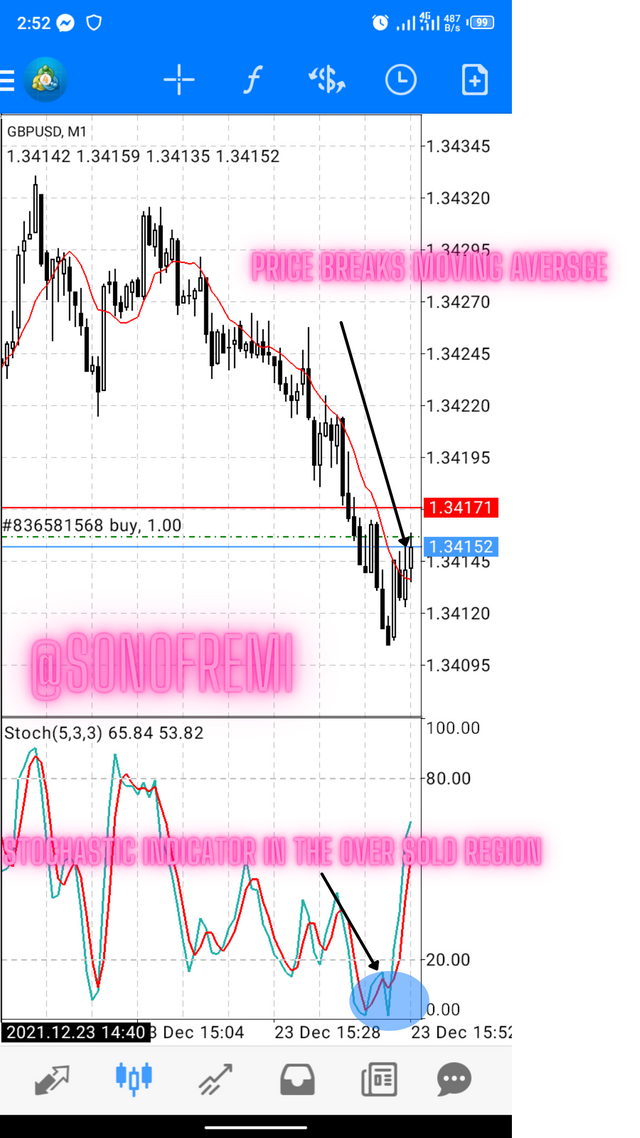
For my strategy I applied the stochastic indicator and the exponential moving average. I patiently waited for the stochastic indicator to get to the oversold region before I placed my buy entry.
As also seen above, we can observe that the stochastic indicator entered the oversold region and this signals a buy entry, which was done. Also price broke the exponential moving average upward also indicating a buy entry. These two confirmations validated my signal and I placed a buy order.
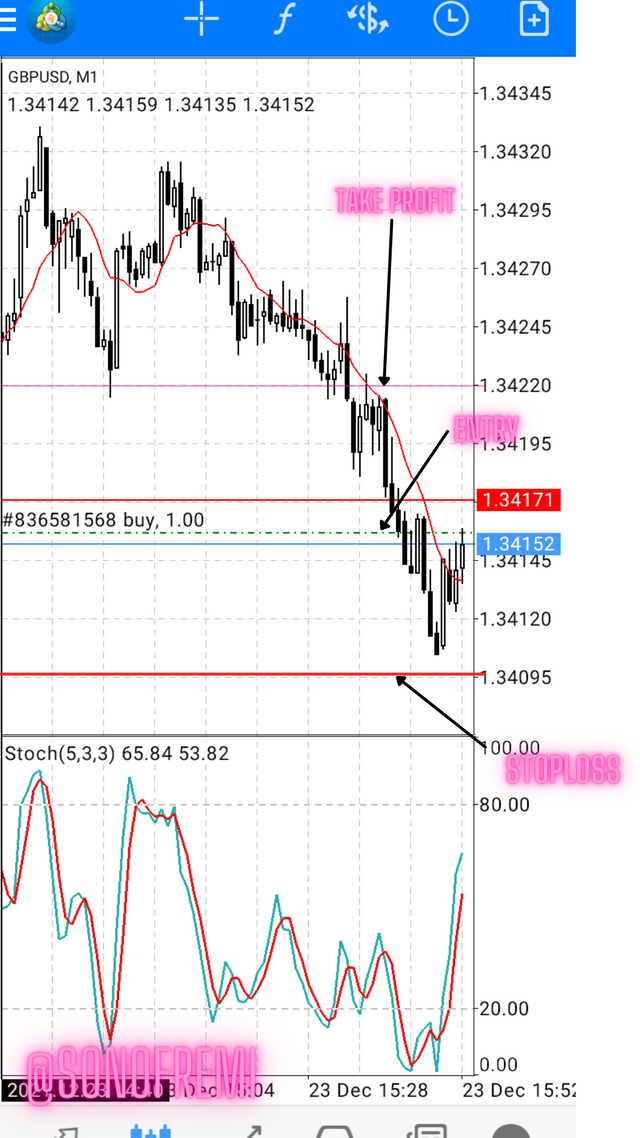
From the above picture I took a buy order, using the confirmation from my two indicators, I placed my stop-loss below the lower low and take profit above.
Below is the screenshot of the trade immediately after I placed the order.
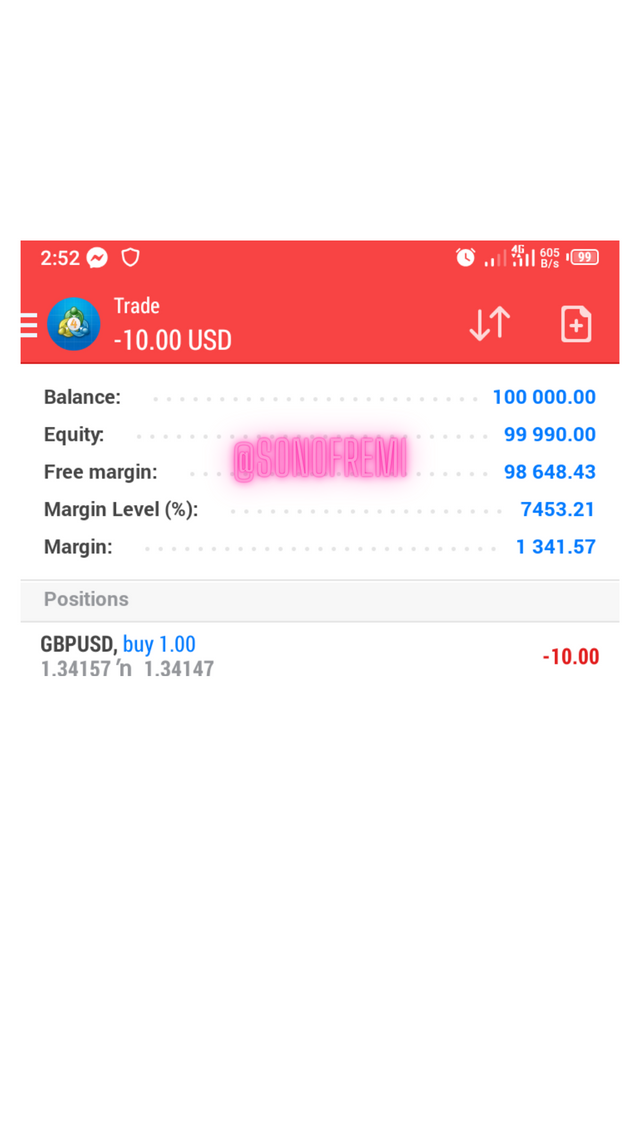
At first it can be observed that I was making some loss, but after waiting for about 10 minutes , I rechecked and saw that I have started making some profit as seen in the picture below.
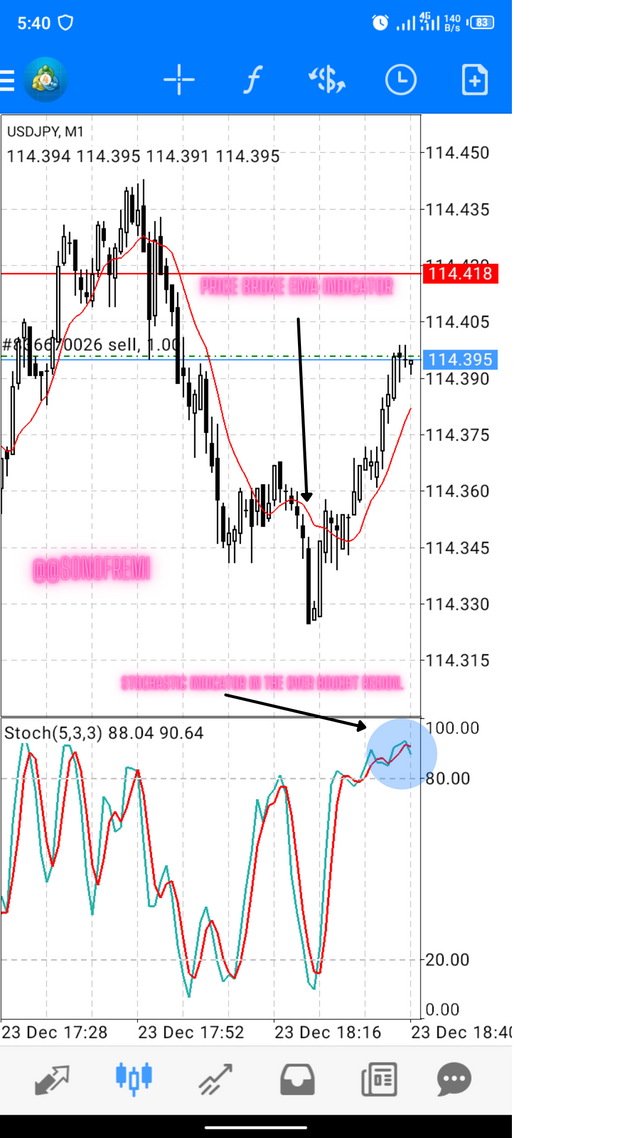
- SELL ORDER;
The picture uploaded below is a chart for USD/JPY, on a one minute time frame, as seen in the screenshot we can observe that price movements kept on developing higher highs, an indication that price might go bearish after a breakout reversal.
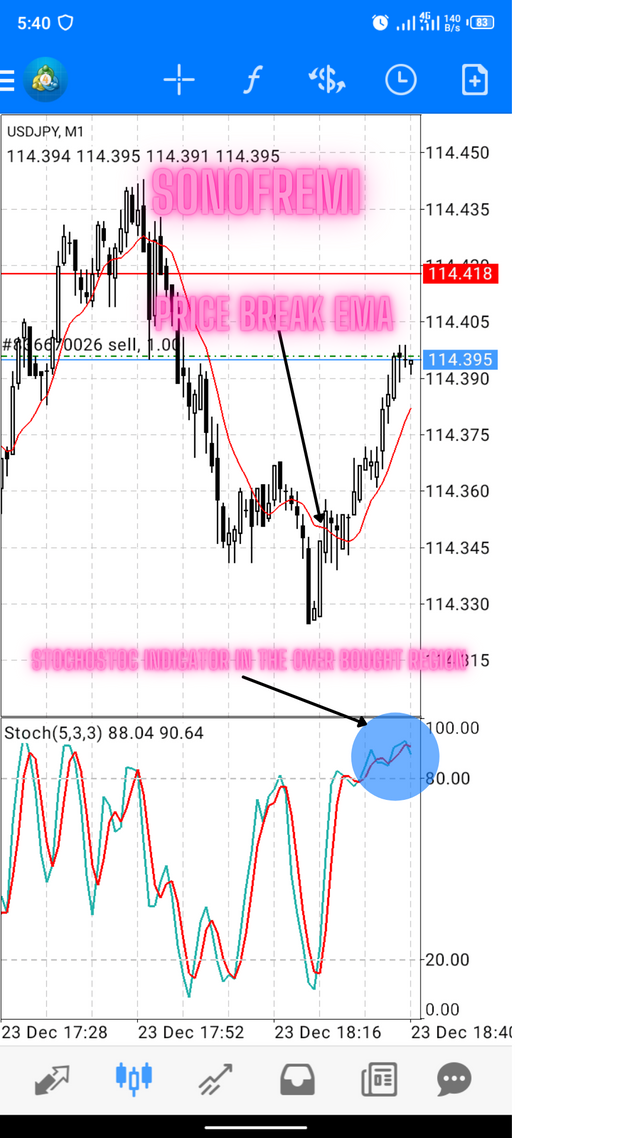
At a particular place on the chart, price broke the moving average. That is one signal confirmation, the EMA Indicator confirmed that market will take a new course and that is downwards, then shortly after the stochastic indicator also entered the overbought region also confirming the signal and when this happens we are expected to make a sell order in the market, which I did.
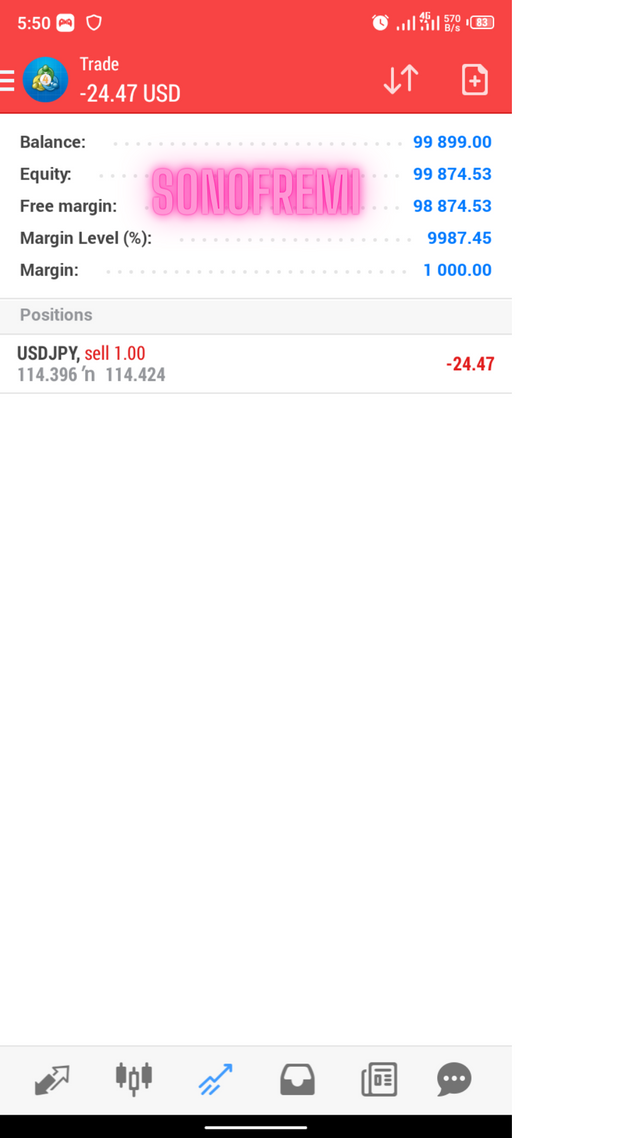
After the confirmation from my two indicators, I placed a sell order as predicted by the indicators. The stop loss was placed higher than the previous low.
The screenshot below shows the outcome of my trade.
In conclusion, confluence trading as I have explained above is very useful in signal confirmation, it enables trader to make right choices.
This strategy simply entails the use of two or more indicators and strategy on the price chart.
And they are two different levels or stage of use or application of this indicator and strategies, they are the 2level and three level.
In my post i laid emphasis on the importance of confluence trading and how it influences a trader's winning odds in the market.
I also placed a buy and sell order using the confluence trading strategy.
Lastly, I want to say a big thank you to professor @reminiscence01 for this wonderful lecture, it was very educative and I enjoyed answering your questions.
Thank you for reading...
Hello @sonofremi , I’m glad you participated in the 6th week Season 5 of the Beginner’s class at the Steemit Crypto Academy.
You have violated the homework guidelines by using forex pairs to execute your trade. This is not acceptable in the academy. Every study in the academy should be related to the crypto market.
Also, you do not meet the requirements for #club5050 program as you haven't powered up to 150 Steem in the last 30days.
Remark: Homework Task Disqualified
I would power up immediately, I didn't mean to not follow the rules, next time I would surely use trading view for crypto. Thanks for marking the post. Highly appreciated 🖤
I have powered up 33 Steem to make my total power up to 150Sp.