Crypto Academy / S5W8 - Homework Post for @sachin08": Reading Special Bar Combinations

Image was made with Canva

A good day and a happy new year to all my fellow steeminas around the world, this is the last week of the season 5 steemit crypto academy and it has been a very lively and educative ride.
My name is kenechukwu Ogbuishi and I will be taking a professor @sachin08 course which is reading special bar combinations and I will be attempting the homework questions below. Thank you.
Q1 EXPLAIN PRICE BARS IN YOUR OWN WORDS . HOW TO ADD THESE PRICE BARS ON CHART WITH PROPER SCREENSHOTS
During technical analysis, different elements are involved to predict or determine the next move of price or trend breakout. We could apply price bars, candles, lines, bars or trend lines, all this helps a trader to analyze for confirmations before making a buy or sell entry in the financial market.
It is always very essential for traders to make use and apply different technical analysis tools before determining when to step into the market. The price bar is one important tool.
The price bar is simply another element or indicative component that can be applied on the price chart, just like the candlesticks, they help tell the point at which the market opened, closed and the highest and lowest points attained. And this is a major advantage it possesses over the Japanese candlesticks.
These price bars are simply vertical lines, with a point showing the point at which the market opened for the day and another point showing where it closed for the day.
The movement and progression of this vertical line(price bars) have meaning, in the sense that whenever a trader observes long price bars forming on the price chart, it simply means there is a lot of price movement and action in the market. Whereas whenever he/she notices the formation of shorter bars it means there is low volatility or price action and movement in the market for that given period.
The price bar is simply a graphical representation of the dynamic and fluctuating price movement on a price chart of an asset or security.
This simply means that the movement of price on the chart is determined by the buying and selling power of the asset and this activity can be represented on the chart using the price bars.
The buying and selling of assets or the entry and exit of traders in the financial market of a security determines price movements and trends. Hence the demand and supply of any asset determines the price action on the chart.
Therefore whenever there is bearish movement of price it means the price of the asset is on a downtrend and when there is bullish candlesticks formation or bullish movement it means the price of the asset is in uptrend and all these signals can be displayed on the price chart using price bars.
The uptrend movement of price is always associated and displayed on the chart with higher highs of price and higher lows. This means that the price of the present day is higher than the price of the previous day. The downtrend movement of price is also associated with lower lows and lower highs. All these changes and fluctuations of price can be represented on the price chart using price bars and candlesticks.
Price bars can also be used during technical analysis to calculate the level of buying and selling happening to a particular asset or security. That means they can also be used to track or keep tabs on the activity for a day. Whenever a trader observes that the open and close point on a price bar formed on the chart are far apart, it means that there is a lot of buying and selling done presently whereas whenever he/she finds that the open and close points are not too far away from each other( close to each other) it entails that there is low activity in the market.
The price bar has different structural components and characteristics. Price bars are characterized by:
The open
The Close
High
Low
As the name implies, it is simply the starting point of price for a day and this is represented on the bars by a horizontal line which forms at the left side of the price bars. It is that initial point where price started counting for a day.
This is the point where price for a given day closed, and this is represented on the chart by a horizontal line but this time forming on the right side of the price bar. It is that point where price stopped counting for a particular day.
This is the highest point of price formation for a given day, and it is represented or found on the highest point of the price bars which is on the very top.
This is the lowest point of price formation for a given day and is found on the lowest point of the price bar, which is located at the bottom of the price bar.

All these different structural features can weĺl be observed on a price chart, they have different functionality and roles. They signal a trader that a new price direction or trend is imminent, it shows them the point of a start and end of any trend, and the point at which the price of an asset hits either low or high. And all these points when put together can be calculated by a trader during technical analysis to determine the overall performance and feedback of an asset or security.
PROCEDURE TO ADD A PRICE BAR TO THE CHART
In this section I will be discussing and showing the procedures on how to add a price bar to the chart. And I will do this using the trading view application on my android phone.
- First of all I opened the trading view application on my phone as shown below.

- Next, looking at the top of the screen one can observe the candlestick option or symbol, that means the candlestick is presently used on the chart.
- Select the candlesticks symbol and a list of other options like hollow candles, price bars, Area, baseline e.t.c will appear. On clicking on the price bar it is applied to any price chart of any asset being viewed.

Q2 HOW TO IDENTIFY TRENDS USING PRICE BARS . Explain both trends. (screenshots required)
During technical analysis, price action on the chart depends on the selling and buying capacity of the given asset, it also depends on the supply and demand of the asset or security. So before a trend is recognized in the market, one of these elements must be involved. The supply and demand of a particular asset gives way for either the formation of higher highs and higher lows on the chart, which represents an uptrend in price or the formation of lower highs and lower lows. All this dictates the entry or course of the day.
USING PRICE BARS TO IDENTIFY AN UPTREND IN PRICE
Above we explained that a bullish trend in market price is always characterized by the formation of higher highs and higher lows by the candlesticks on the price chart, this is just one characteristics of a bullish trend, there are lots of other ways and techniques used to identify an uptrend in the market of an asset or security.
To identify an uptrend or bullish trend in the market, a trader must keep an eye to see that the price of the asset opened at a lower point and it closed at a higher point as well as the low of the previous day being lower than the next one(Higher low). We can observe this in the picture below

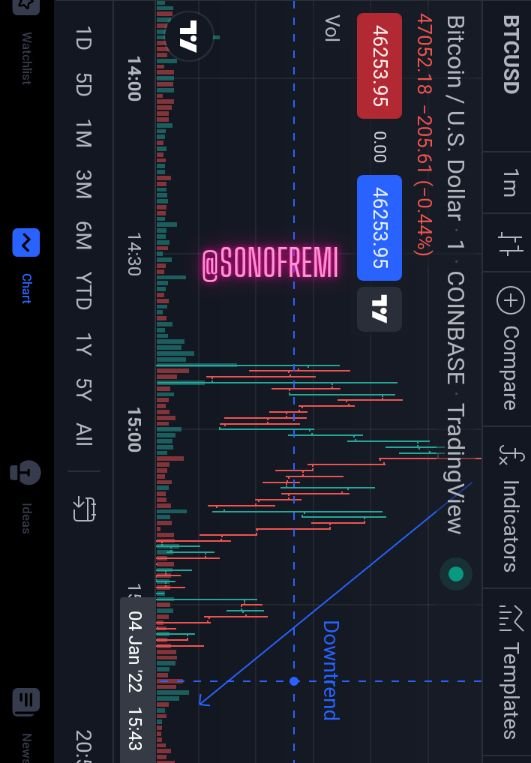
USING PRICE BARS TO IDENTIFY A DOWNTREND IN PRICE
This procedure simply entails the opposite of the other, as a trader is expected to look out for lower highs and lower lows made by the price bars in the price chart of an asset, this signals a downtrend of price on the chart. The closing point of the present day has to be lower than that of the previous one on the price bars; this signals a valid confirmation of a downtrend of price as shown in the picture below.
Q3 EXPLAIN THE BAR COMBINATIONS FOR SPENDING THE DAY INSIDE FOR BOTH CONDITIONS . (Screenshots required)
Just like every indicator used in the price chart by traders during technical analysis, all have patterns in which they use to convey signals to the trader on the price chart. The price bars have their own unique patterns that display or signal points of changes in the price market.
In this section we will be discussing these patterns but specifically the price bar combination for Spending the Day inside.
This situation, pattern or combination happens when the present price bar for the day is engulfed inside the precious bar for the previous day. This simply means that the new price bars high and low are covered totally by the previous price bar of the previous day. This is one pattern displayed by the formation of price bars, it signals that there is a lot of uncertainty in the price market of an asset or security. What do I mean by uncertainty in the market?, it simply means that the level of demand and supply in the market is almost at the same point or equal hence the holders of assets are not willing to sell and the potential buyers are eager to buy.
The signal portrayed by this combination is not certain, it doesn't foresee price breakout and changes in trends, it just signals uncertainty in the market. A situation where price movement is indecisive. And it can also occur either in a bullish or bearish market trend.
For Spending the Day inside to form on a price bar there are conditions and descriptions that must be met.
- The first is that the previous price bars high must be at a higher point than that of the present or new one.
- The second condition is that the previous price bar must be lower than that of the new price bar.
I have described the opening day inside combination in relation to the bullish and bearish market trend with the screenshots below. All that matters is the direction at which price is taking course.
When we talk about a bearish day inside we will observe that the open and close of the new bearish price bars are engulfed in a bullish price bar. This combination signals a downtrend or trend reversal.

Talking about the bullish day inside, we can see that the previous bearish price bar engulfs the following bullish price bar and this indicates a bullish trend continuation.

Q4 EXPLAIN THE BAR COMBINATIONS FOR GETTING OUTSIDE FOR THE DAY FOR BOTH CONDITIONS . (Screenshots required)
Just like getting inside the bar combination, the opposite which is getting outside the bar combination signals a trader that there might be a new trend reversal or a trend continuation. For this combination to form a signal a trader has to observe and notice that both the highs and lows are formed outside the day of the next candle.

In the case of a bullish trend, a trader has to observe to notice that the open is at a lower point than that of the closing point. Here the previous high price bar is usually Lower than the next.
Whereas in the case of a bearish trend, a trader has to observe to notice that the open will be positioned at a point on top while the close would be at the bottom. In this scenario the closing point of price is usually at a lower point to that of the previous price bars close.
Q5 EXPLAIN THE BAR COMBINATIONS FOR FINDING THE CLOSE AT THE OPEN FOR BOTH CONDITIONS IN EACH TREND . (Screenshots required)

Uptrend is said to be an opening of a price is seen at the open of the last seen previous price bar and then the closing is seen directed to the high and signal indicating is seen to still go in an uptrend movement.
Whereas in a situation of a downtrend, when the close of the previous price bar is at the open of the new one or near it, and it is close to the high point then this signals a possible trend reversal but when the close and open of the two price bars are on the same point and it is closer to the low, then it signals a possible trend continuation.
In conclusion the price bar combination is a very important aspect of technical analysis, just like the Japanese candlesticks, lines, baseline e.t.c they all help to know the point at which a trend reversal will occur as well as a trend continuation. The activity of price and action of price of a given security can be tracked using the price bar combinations. And this has proved to be a very useful, effective and essential tool used for technical analysis.
Lastly, I want to say a very big thank you to professor @sachin08 for this wonderful lecture. I enjoyed every second of the assignment.