Steemit Crypto Academy Season 5 Week 1 [Beginner's Course] - Understanding Trends: @sonia440
Homework Question
- Homework Tasks
- 1a) What do you understand by a Trending market?
- b) What is a bullish and a bearish trend? (screenshot required)
- Explain the following trend identification and give an example of each of them. (Original screenshot needed from your chart). Do this for a bullish and a bearish trend.
- i) Market Structure.
- ii) Trendlines
- Explain trend continuation and how to spot them using market structure and trendlines. (Screenshot needed). Do this for both bullish and bearish trends.
- Pick up any crypto-asset chart and answer the following questions -
- i) Is the market trending?
- ii) What is the current market trend? (Use the chart to back up your answers).
- Conclusion.

Introduction
Good Day Steemians , I will be responding to Home task given by professor @reminiscence01 , Thank you for this wonderful explanation on ''understanding trends'' . below is my homework.
- Question 1
- 1a) What do you understand by a Trending market?
- b) What is a bullish and a bearish trend? (screenshot required)
1) a) What do you understand by a Trending market?
About 20yrs ago when cell phone was released. So many persons were excited and confused at same time because of the idea of moving about with their cell phone outside their home. Only limited number of persons have cell phones and some where not sure about the future . Looking at the situation of things now every streets and lane is now being dominated by cell phone which was not in existence 20 years ago . We now have Tablets, smartphones even smart watches which allows you to make phone calls. This changes in Telecommunication market is a wonderful example of what is Trending in the market system.
In crypto space market trend is said to be the tendency of money market to move in a direction at a given period of time. It can either be upward movement or downward movement. Trend movement can be noted by “higher high” and “higher lows” in uptrend movement while “lower highs” and “lower lows” in downtrend movement .
- b) What is a bullish and a bearish trend? (screenshot required)
Bullish Trend
The term bullish originated from bull that strikes upward with his horns, thus causing an upward movement in price. The word bullish can be used to denote an uptrend movement . Bullish Trend is when the market tend behave like a bull . Bullish signifies that an asset will rise in value, A bull season of asset is the season when an asset is expected to rise in price.
Bullish Trend movement can be noted by “higher high” and “higher lows” in uptrend movement. In bull market when demand for an asset increases, there will be an increase in the volume of the same asset which would cause an uptrend movement.
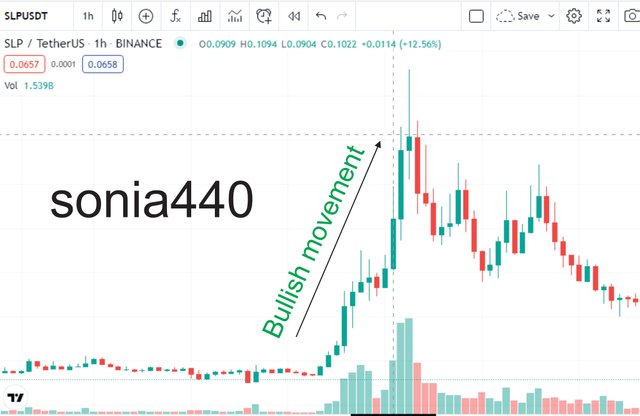
Source: SLP/USDT bullish Trend on Tradingview
Bearish trend
The term bearish originate from the word "bear" who fight or strike downward using its paws, thus bearish trend simply means downward movement of price.
Bearish is the complete opposite of bullish. Bearish season signifies that the price of an asset will drop or fall in value. A bear season of asset is the season when an asset is expected to fall in price.
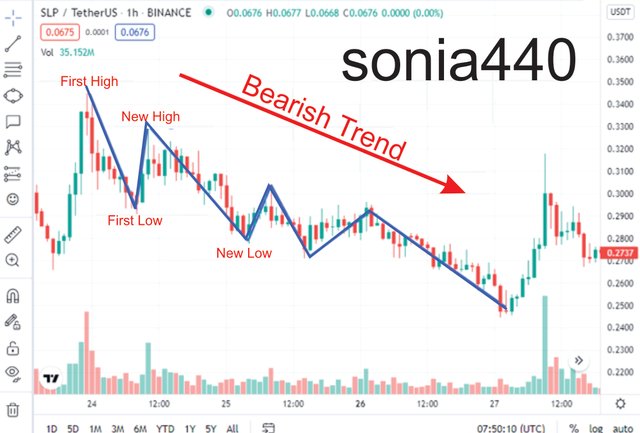
Bullish Trend movement can be noted by “lower highs” and “lower lows” in a downtrend movement . In bear market when demand for an asset decreases, there will be decrease in the volume of the same asset which would cause an downtrend movement.
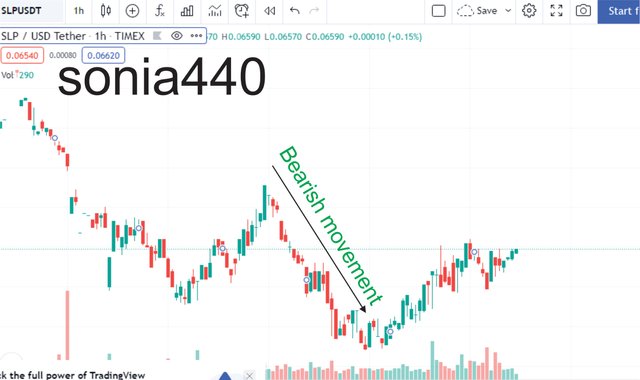
Source: SLP/USDT bearish Trend on Tradingview
- Question 2
- Explain the following trend identification and give an example of each of them. (Original screenshot needed from your chart). Do this for a bullish and a bearish trend.
- i) Market Structure.
- ii) Trendlines
Market Structure
Market structure can be define as the nature and degree of competition in the market for services. The structures of market factor is being determine by nature of competition in particular market at given period of time .
Looking at the Bullish Trend, we would discover their higher-high and higher-low trends which signifies that the price is increasing. which also signifies a selling point and when market price fall below it also show a buying point.
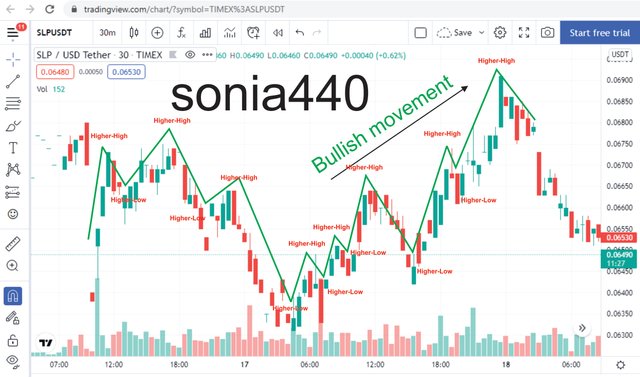
Source: Bullish Trend on SLP/USDT
Following the market structure on Bearish Trend, we would discover the lower high and a lower low patterns which the market runs on , which also signifies that the price is gradually decreasing. This is actually the best time to buy because of the downward movement of the price.
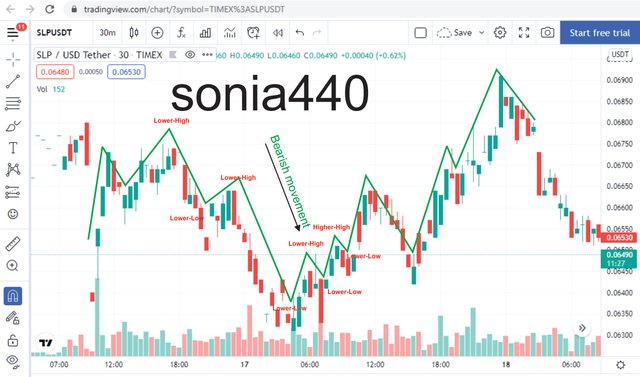
Source: Bullish Trend on SLP/USDT
Trendlines
Trendlines is one of the tools used in technical analysis to determine movement of market . For bullish market 2 Low easily recognizable point is combine and a line draw on the charts to link the series of price together. The outcome of the line is used investor or trader to determine the direction in which an asset value might move.
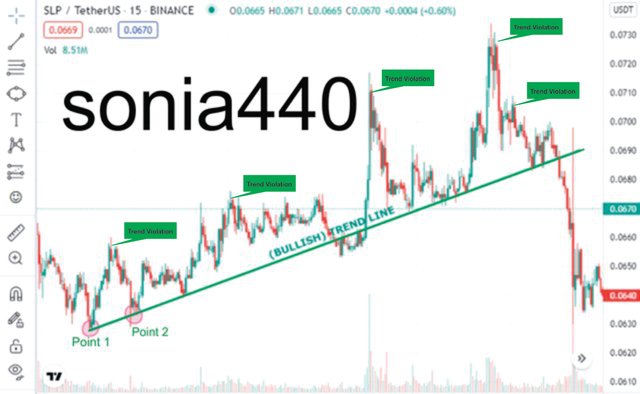
Bullish Trend Line
An asset that is in a bullish season and whose trendline has been marked, if the price of the asset reaches the trend line, it fires up and this is an excellent opportunity for traders to take profit but if the line discontinues along the line it indicate an exit point.
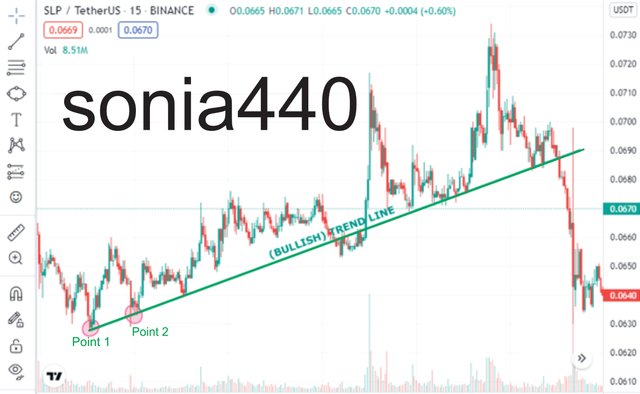
Source: Bullish Trend Line using SLP/USDT on Treadingview
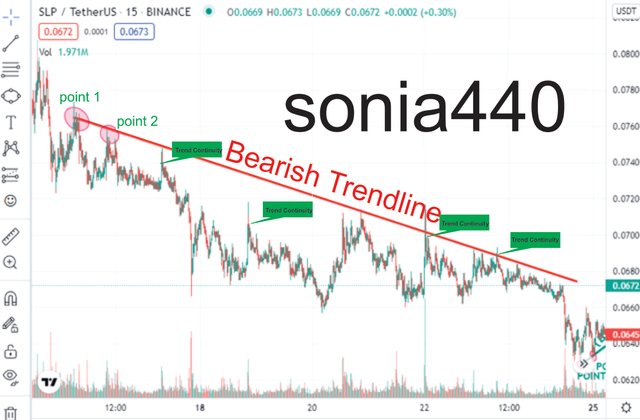
Bearish Trend Line
An asset that is in a bearish season and whose trendline has been marked or drawn, if the price of the asset reaches the trend line, it meet a resistance fires down and this is an excellent opportunity for traders but if the line discontinues along the line it fires back up which can also indicate an entry point.
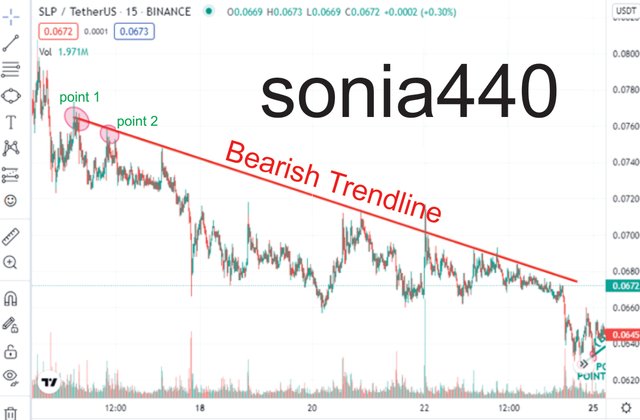
Source: Bearish Trend Line using SLP/USDT on Treadingview
- Question 3
- Explain trend continuation and how to spot them using market structure and trendlines. (Screenshot needed). Do this for both bullish and bearish trends.
Trend pattern is the pattern within the price chart that indicates the direction where prices might next and their is only two option ,is either the trend continues or it reverses . If the trend continues, there will be take profits and exit points, and there will also be new entry point when the market value falls with this trend continuity is maintained.
Bullish Trend Continuity
In Bullish trend, the new price moves higher than the previous high while the new low must be higher than previous low .
Bullish trend continuation image is shown below.
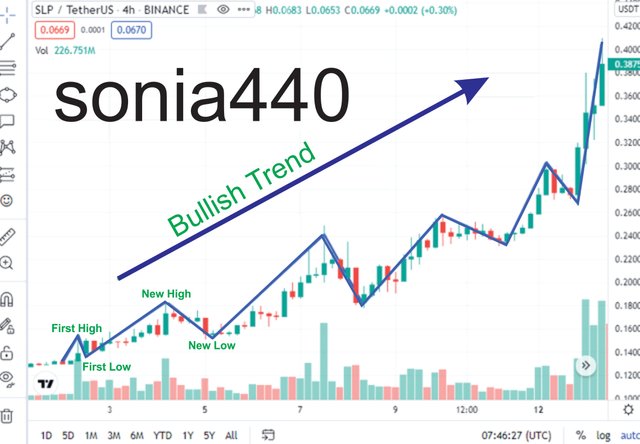
Source: Bullish Trend Continuity using SLP/USDT on Treadingview
Bearish Trend Continuity
In Bearish trend, the new price moves Lower than the previous high while the new low must be Lower than previous low .
Bearish trend continuation image is shown below.
Source: Bearish Trend Continuity using SLP/USDT on Treadingview
In Market Structure, identifying the trendline is very necessary. The Trend must follow the lay down guide line but If there is a break of point in the trendline, it means a reversal will occur. Below is the image for both bullish and bearish trend violation.
Source: Bullish Trend Continuity using SLP/USDT on Treadingview
Source: Bearish Trend Continuity using SLP/USDT on Treadingview
- Pick up any crypto-asset chart and answer the following questions -
- i) Is the market trending?
- ii) What is the current market trend? (Use the chart to back up your answers).
Is the market trending?
For this question I will be SLP/USDT pair. currently, the candle chat shows that the trend is not moving in a particular direction rather in a irregular manner thus their no definite trend currently.
What is the current market trend? (Use the chart to back up your answers).
As discussed above, there is no stagnant trend in the chosen trend. The Ranging Phase of the assets was noticeable in as much their was a rise at the beginning of November, it couldn't stay long above the resistance before drop towards the support point. After that the assets picked up before falling back again and their is chances that the assets will still rise again.
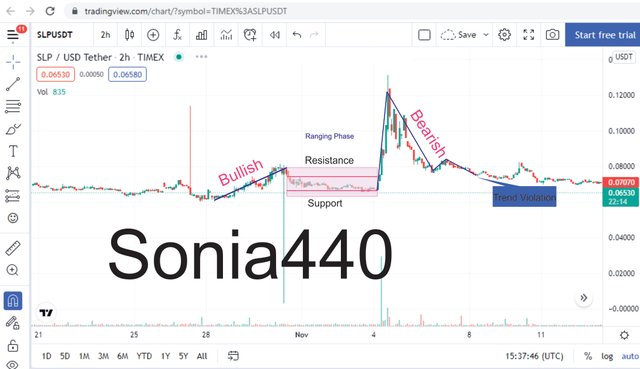
Source: Identifying the Current Trend using SLP/USDT on Treadingview
Conclusion
At first , I didn't actually understand what market trending is all about but after going through this class am now to describe market movement , I now know when to enter and exit market.
Am Thankful professor @ @reminiscence01 for this wonderful lecture.