[Recognizing Simple Patterns in Trading] - Crypto Academy / S5W2 Homework Post for @sachin08
Greetings cryptoacademy,
It is a wonderful time in this community. I will have to acknowledge prof. @sachin01 for such an enlightening lecture. The topic Recognizing Simple Patterns in Trading
Without much waste of time, I'll do justice to the given task.

1. What is your understanding about triangles in trading. Explain all forms of triangles in your own words (screenshot required)
It is amazing to know that cryptocurrency is becoming known to more people than it was before now, and to that effect, for one to be a successful trader, he/she must have deep knowledge of many technical strategies.
One of the technical strategies successful traders use is the Triangles in trading. This triangles are shapes formed by the activities of the available trade in the market.
This triangle shape pattern is as a result of the buying and selling force in the given market.
Three different types of triangles can be seen on a chart and a detailed understanding of each of them will aid you in making the best out of your trades.
The 3 types of triangle are;
i. Ascending triangle
ii. Descending triangle
iii. Symmetrical triangle
I wll be explaining them in details below
Ascending triangles
Ascending triangles entails a triangle connecting two lines in an ascending order, from bottom to the top at the base of the chart forming the support line of the chart.
The second line which is a horizontal line is drawn above the longest possible diagonal line which forms the resistant line.
The ascending line runs from the bottom to cut across the horizontal or the resistance line at the apex, and any breakout in the resistance line will lead to a bullish run which shows a buy signal.
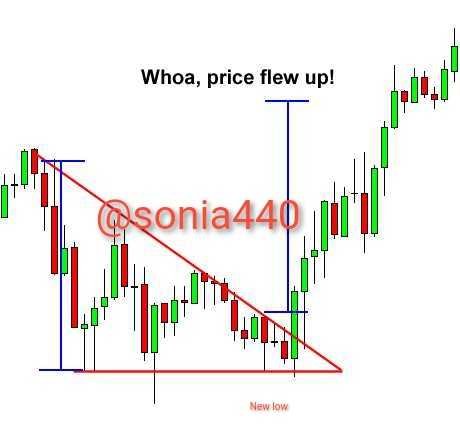
Descending Triangles
Descending triangle on the other hand connects two lines in a downward direction. The longest line been drawn from the top to touch or cut across the horizontal line below, at the triangle's base. Whenever there is a breakout in the support line, a sell signal is indicated.
A descending triangle forms a right-angled triangle with the hypotenuse descending from the left to the rightdown.
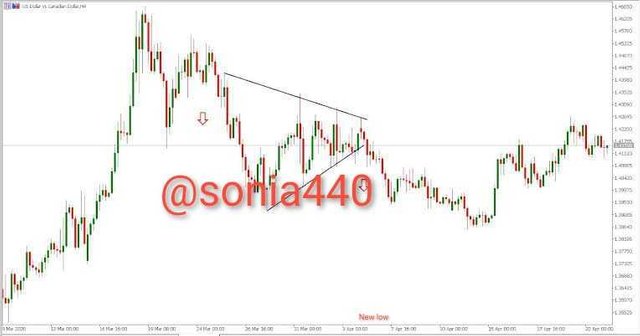
Symmetrical Triangles
A symmetrical triangle takes the form of an isosceles triangle with two identical sides. These two sides forms the support and resistance of the chart.
I term this triangle as an uncertain triangle because, the breakout is always uncertain, it goes bullish if it breaks the resistance line or bearish when it breaks the support line.
2. Can we also use some indicators along with the triangle pattern? Explain with screenshots.
Technical indicators are used by technical analysts in conjunction with other indicators in making the best trading decision.
When it comes to crypto trading, every good trader devices means to identify strong signals for entrance into a market.
For the fact that there is no ideal signal, traders are advised to confirm a signal with two or three technical indicators to be sure before making any trade.
Alongside the triangle pattern, indicators like EMA and the William %R can be used to confirm signals denoted using the triangle pattern.
Source
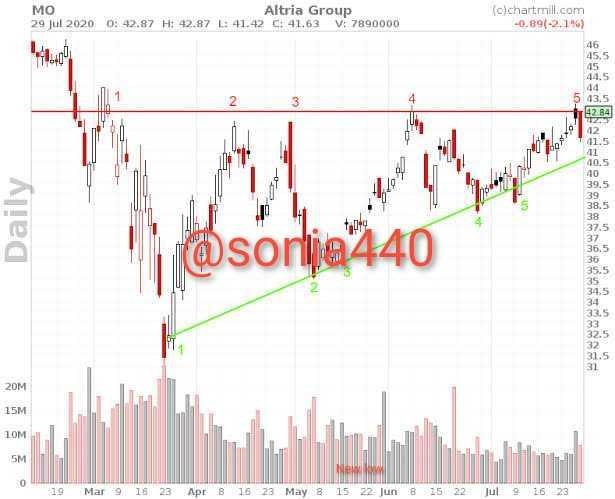
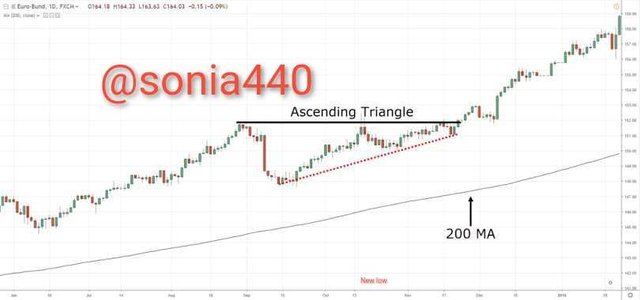
In the chart above, we used the 200 moving average alongside ascending triangle.
The ascending triangle shows a buy signal which was confirmed by the moving average.
3. Explain flags in Trading in your own words and provide screenshots of both bullish and bearish flag.
Flags are strong strategies that identifies a strong movement in price action either upwards or downwards. i.e flags are technical strategies that are used to identify strong price movement which can either be bullish or bearish.
A flag is formed after a strong trend. The steep price movement forms the poll of the flag with a triangle-like flag.
Bullish Flag
After a strong bullish movement, the bullish flag forms.
The poll of the flag is formed by a strong bullish candlestick, while market activities at the top will form a triangle which combines with the poll to form a bullish flag.
To make a successful trade with the bull flag, two lines associated with the triangle are considered, taking cognizance of our support and resistance.
Any breakout will determine our entry. (Buy order if it breaks the resistance and a sell order if it breaks the support.)
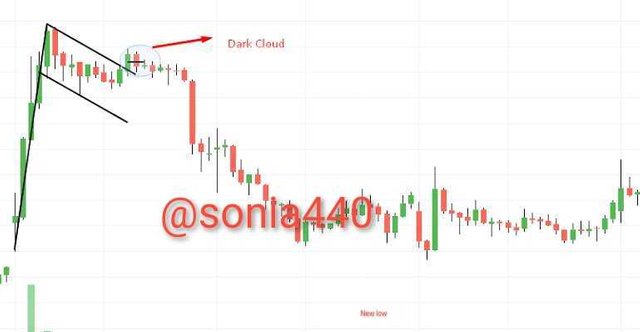
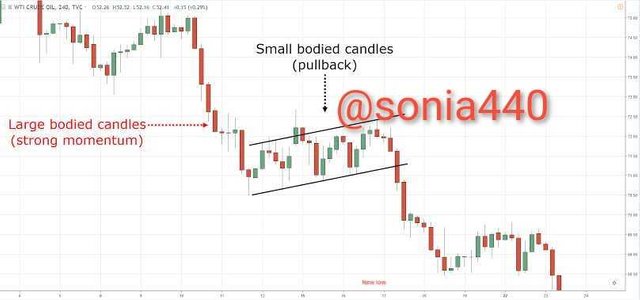
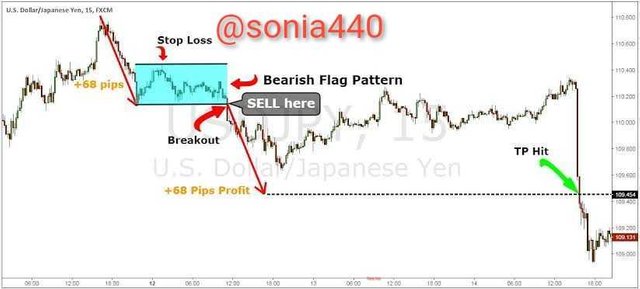
Bear Flag
Bearish flag on the other hand is formed at the end of a strong bearish movement.
The poll of the flag is formed by strong bearish candlesticks. At the end of the poll, the market action there forms the triangle which joins with the poll to form the bearish flag.
For a successful trade to be made with the bearish flag, we consider the two lines involved in the triangle and identify our support and resistance. Any breakout in price action will give us hint as pertaining to the new market movement which will either be bullish or bearish and can be confirmed with other technical indicators.
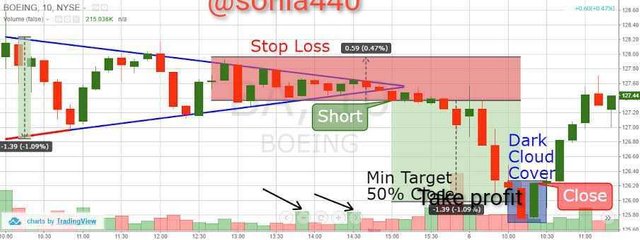
4. Show a full trade setup using these patterns on any cryptocurrency chart (Ascending triangle,symmetrical triangle, bear flag)
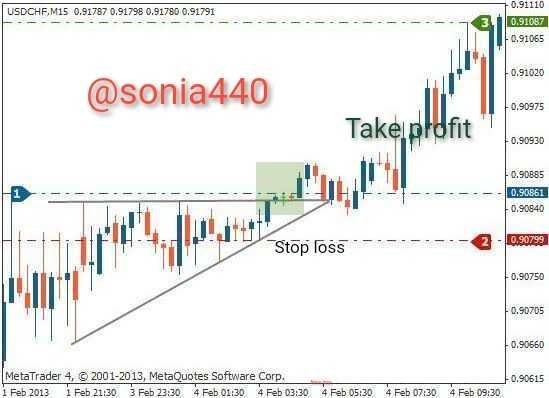
Ascending Triangle
There are few steps to take in setting up trades viz;
Step 1 indicate a nice ascending triangle
Step 2 watch closely for a break of the resistance zone
Step 3 on identifying a bullish candlestick place a buy order.
Step 4 Don't forget your stop loss and take profit (very important).
Symmetric Triangle
Few steps in setting up a symmetric triangle;
Step 1 look out and identify a good symmetric triangle
Step 2 Check out for a breakout in the resistance or support zone.
Step 3 Place a buy order in the case of a bullish signal and a sell order in the case of a bearish signal.
Step 4 stop loss and take profit not to be forgotten
Bear Flag
To setup a bear flag;
- Lookout for a perfect bear flag
- Wait for a breakout in the resistance line for a buy trade or a breakout on a support zone in the case of a sell trade.
- place a buy order or a sell order depending on the market movement
- Never forget to place your stop loss and take profit.
Conclusion
In conclusion, I will like to use this medium to applaud prof. @sachin08 for this great teaching. I must say it is worth much more than applaud.
I appreciate you for this insightful teaching..