Basics to trade cryptocurrencies correctly. | Part 2 - Crypto Academy / S6W3 - Homework post for nane15


INTRODUCTION
Good evening Steemians , I will be responding to assignment given by professor @nane15 on "Basics to trade cryptocurrencies correctly - Part2". Let's begin.
Q1. - Explain your understanding of charts, candlesticks, and time frames. (Use your own words and put screenshots)
A chart can be said to be the graphical representation of data using different elements, arranged in a unique way to send out information. Charts in trading signifies the communication between buyers and sellers that is being represented in a graphical form to show the price price of a asset at amy point in time.
We different forms of charts in trading they include :
- bar chart
- line chart
- candlestick chart
- market profile chart
Candlestick
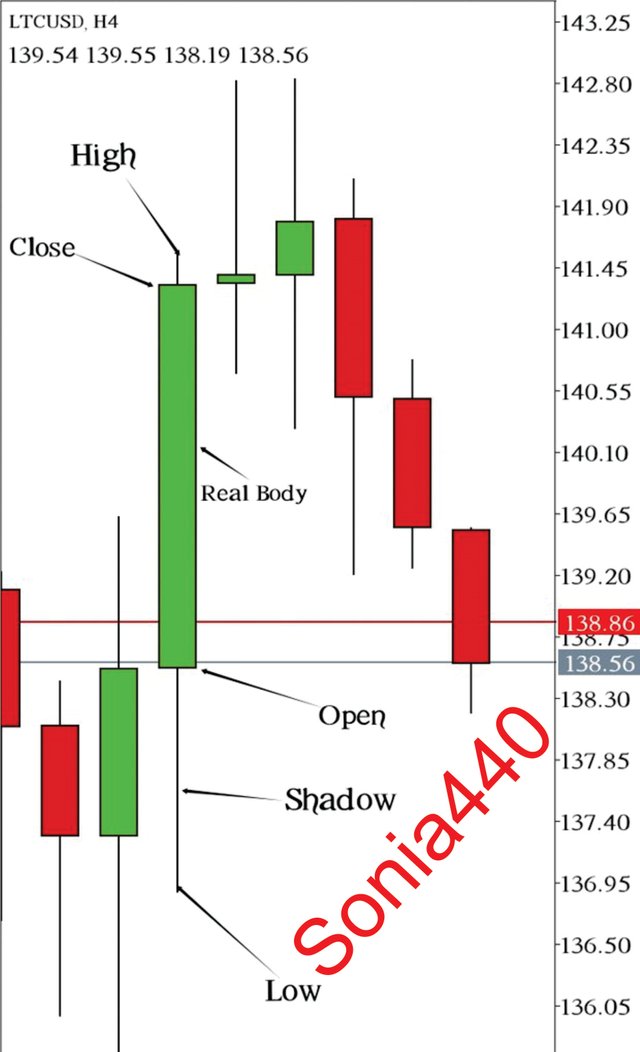
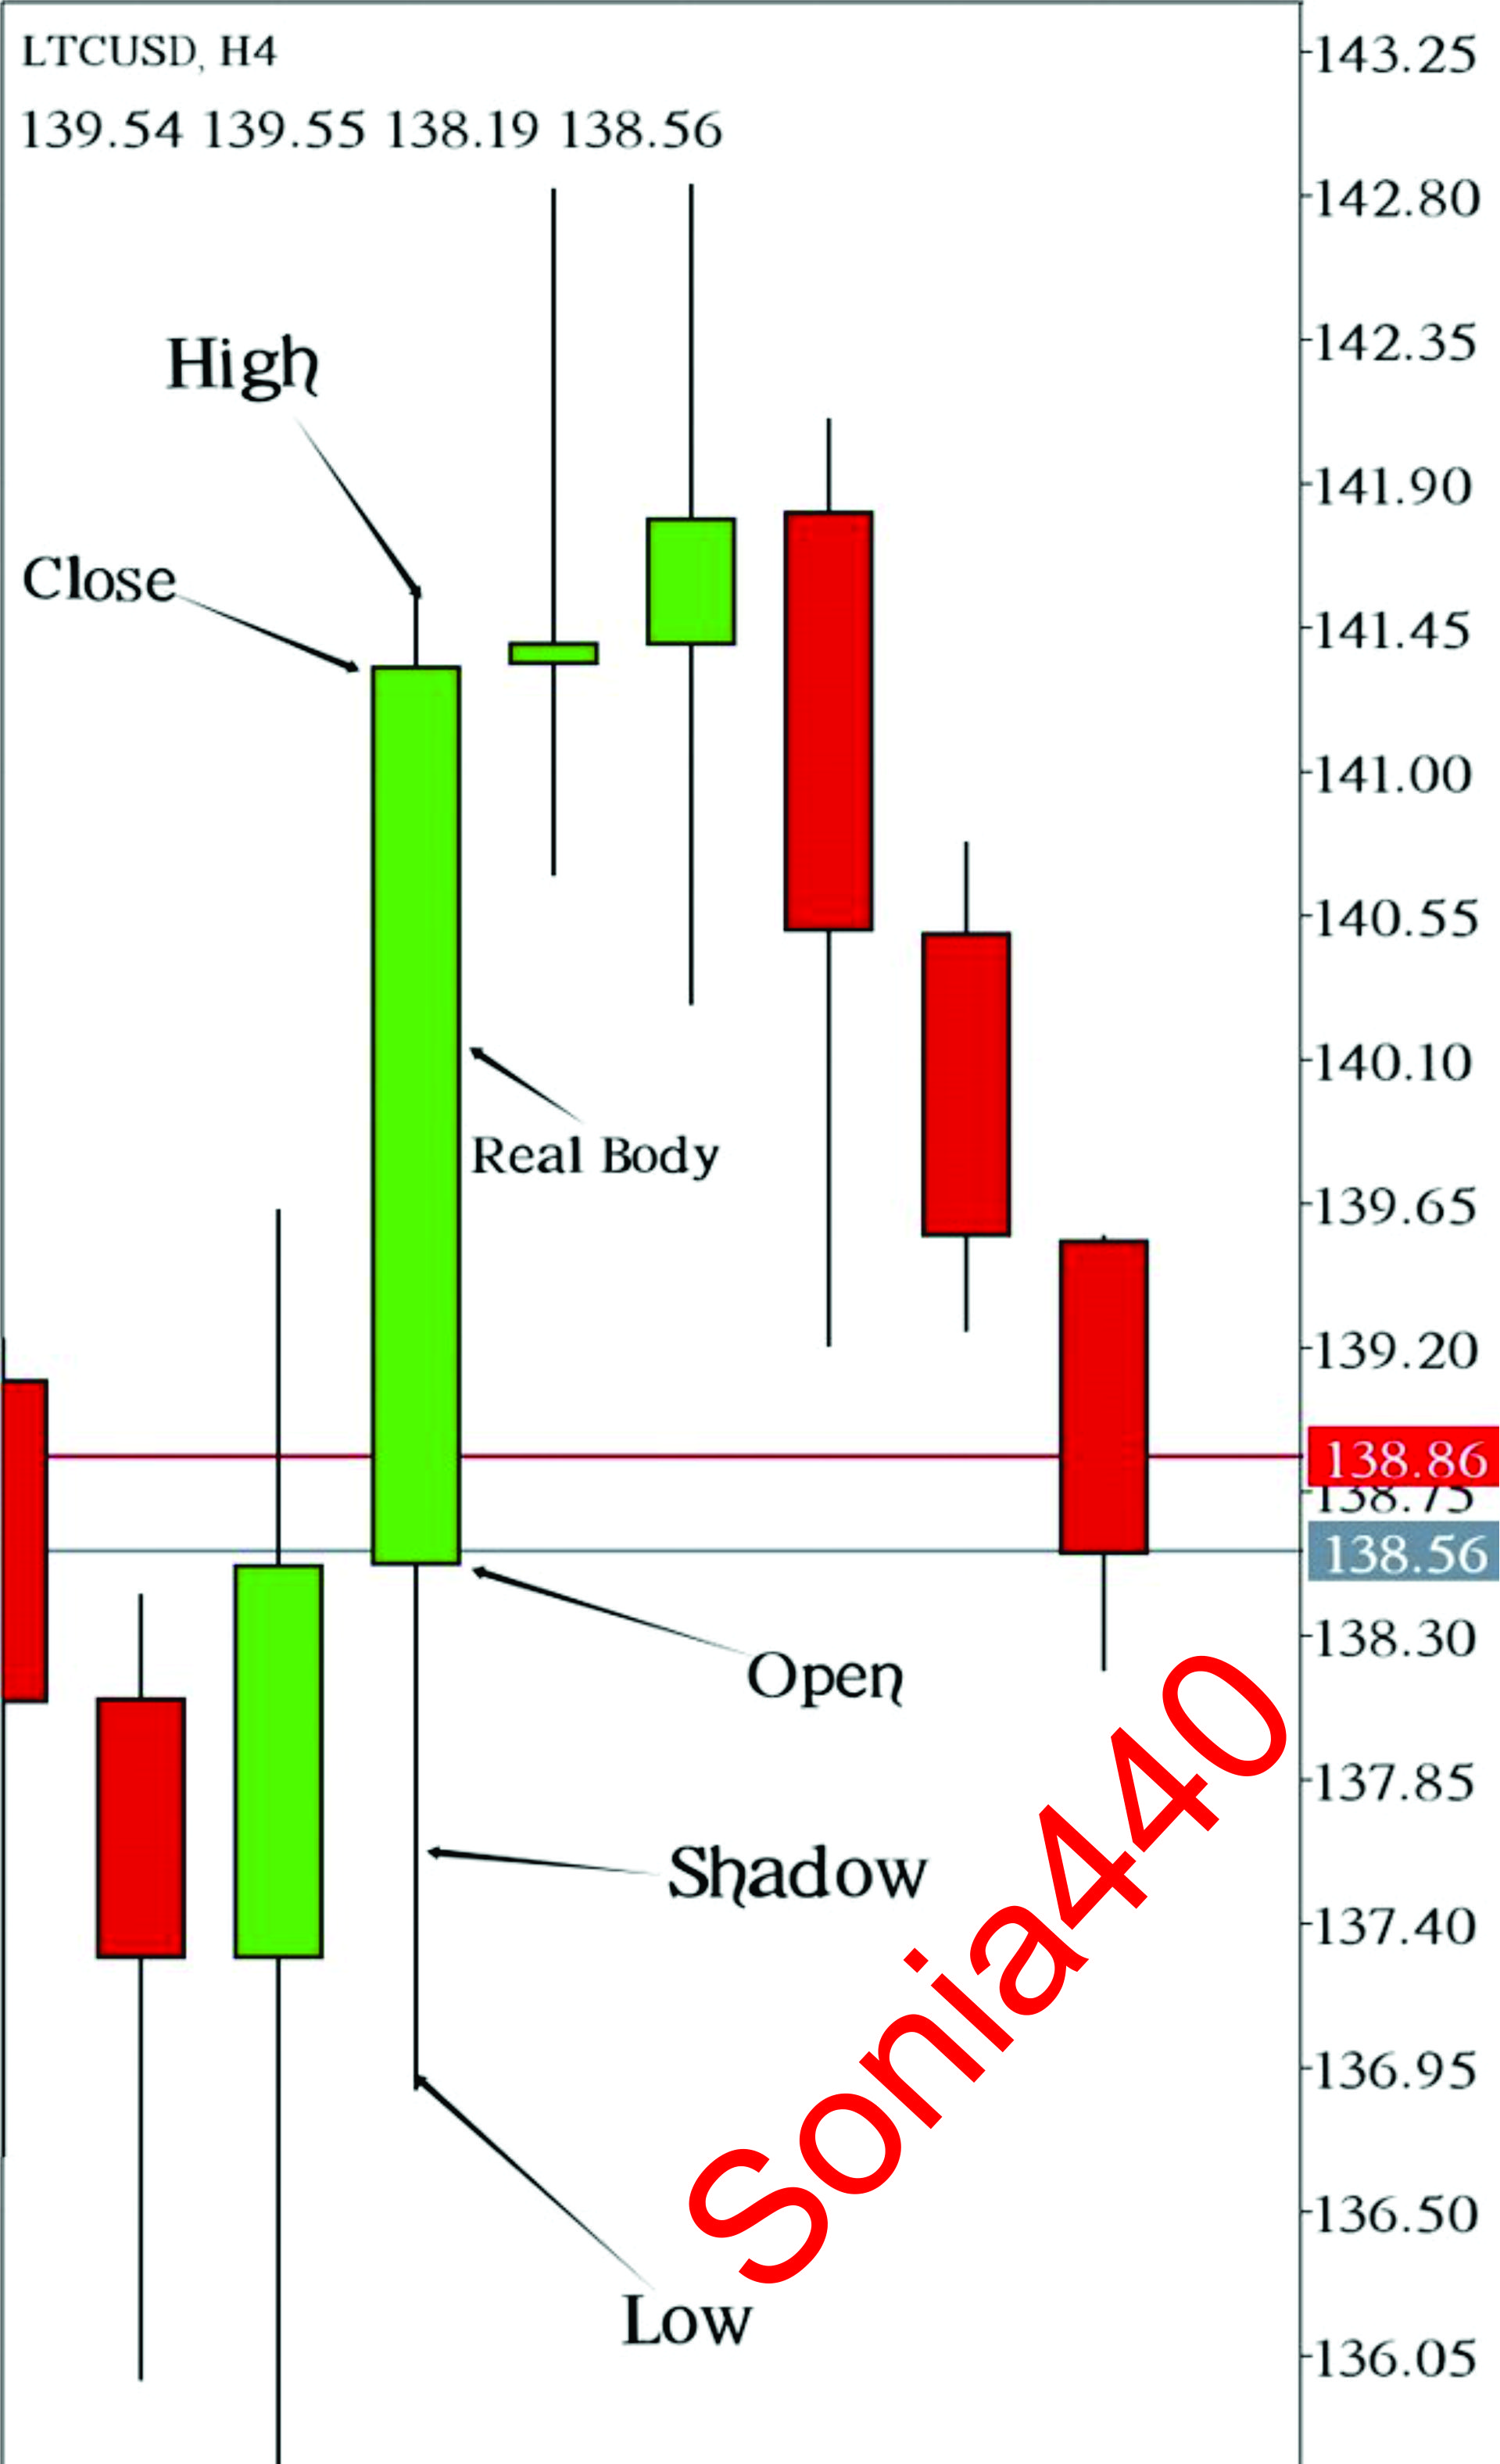
candlestick is used to represents the movement of price at any given time. A candlestick is made up of six important parts which are ; Open, High, close, low, shadow, and real body. They all can be use to represents the price movement .
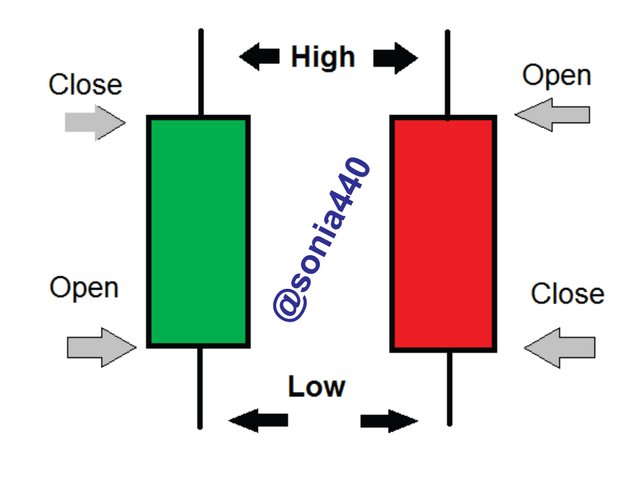
High:
It's the part of candlestick that shows the peak of price or the highest movement of price at a given of time. It can be seen at the top end above the shadow.
Open:
The open of a candlestick is related to the opening price of that same candlestick at the beginning of any period.
Close:
The close of a candlestick is related to the ending price that same candlestick. It is the price at the end of season or period.
Low:
It's the part of candlestick that shows the lowest price discovered at a period. It can be seen at the bottom end below the shadow.
Shadow:
A line the candle stick that shows changes in price of an asset in respect to opening and closing price. it signifies the highest and lowest price at which an asset was traded at a given period of time.
Real body:
It is the wide part which display the range of price between the opening and closing of price at any given period of time. It's the most useful part of a candlestick that shows the volume.
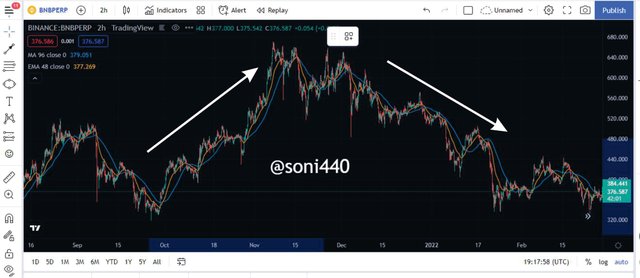
Timeframes
Timeframes is simply the time interval at which a trade last. The timeframe be differentiated on the charts depending on the trader input, We have different time intervals example: 5mins timeframe , 15mins, 45mins, 1hr , Days, Months depending on the traders choice. So each timeframe will display chat corresponding to time the traders choose.
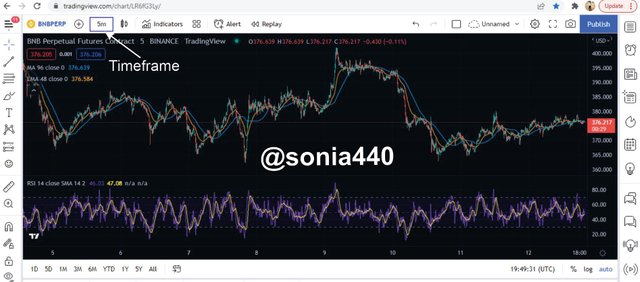
The screenshot below is 5mins Time frame of BNBUSDT pairs
Q2. - Explains how to identify support and resistance levels. (Give examples with at least 2 different graphs)
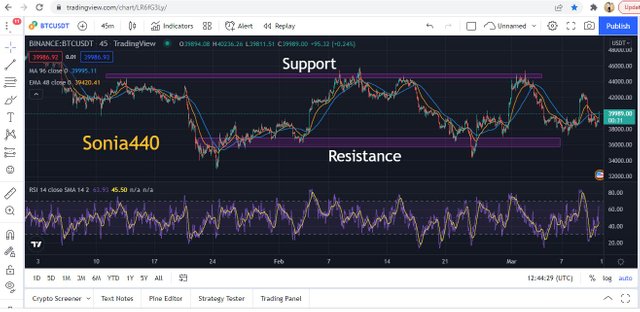
Support and resistance is one of the most important attributes of analysis, which benefit crypto trader in so many ways. Support Level is a price level at which the price an asset does not drop below or cross over a period of time. An asset's support level is being maintained by buyers entering the crypto market when the price of an asset falls to a lower price while Resistance Level is a price level where the price an asset finds it difficult to cross over a period of time
We also have two kinds of support and resistance levels which are:
- Horizontal
- Dynamic.
Below is the image BTCUSDT and supporta nd resistance was clearly shown in the image
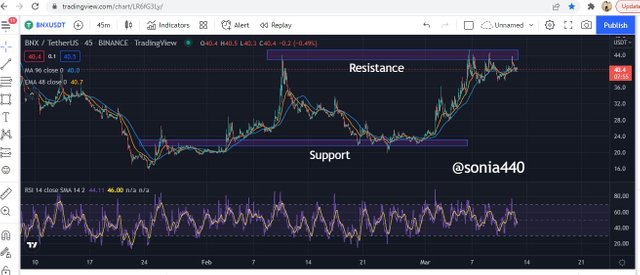
Below is the image BNXUSDT and supporta nd resistance was clearly shown in the image
Q3. - Identifies and flags Fibonacci retracements, round numbers, high volume, and accumulation and distribution zones. (Each one in a different graph.)
Fibonacci
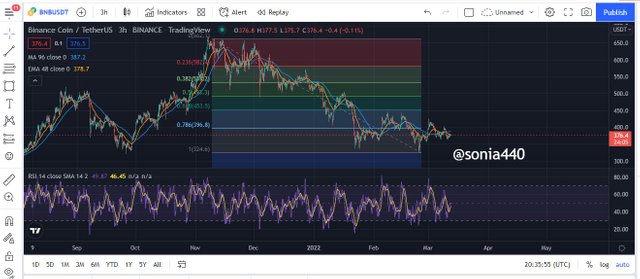
Fibonacci is used to determine the depth of a retracement that took place between support and resistance zone. The Fibonacci tool made of horizontal line marked diagonally between points(high and low points ), in the market system a trader Plotting Fibonacci on chart need to have a complete overview of price movement (either upward trend or downward trend)
In bearish trend Fibonacci is use measure the retracement or counter-trend movement . The lines are drawn from low point to the current high point. while in bullish trend Fibonacci is use to measure the retracement or counter-trend movement in upward direction of price, The lines are drawn from high point to the current low .
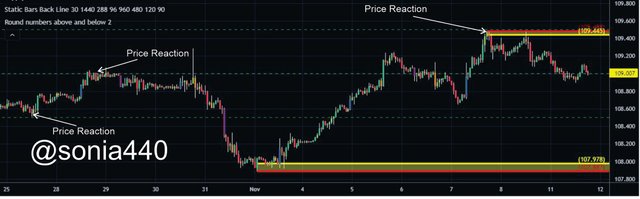
Round number
Round numbers: It can be used to understand the market trend, also to get a round figure like 1.600,3000 etc. Sometimes trader wait for the price level so as to place their trade orders around these price level.
Most individual believes that prices tend to move when it gets to rounded price .so they patiently wait for rounded\d figures so to trade. below is screenshot to illustrate to rounded figures.
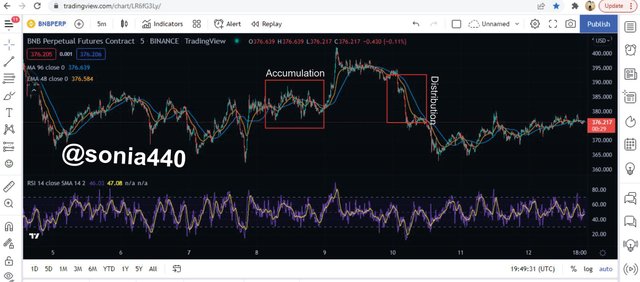
Accumulation and Distribution Zones
The idea of market volume is related to accumulation and distribution. The volume shows the rate of inflow or outflow in the market system at any point in time by trader and accumulation & distribution points out when inflow or outflow of currency is on the increase in the crypto market . Strong traders with assists decides the trends using accumulation and distribution , They tend do this by executing massive trade influences the demand or supply thereby affecting the price of the asset.
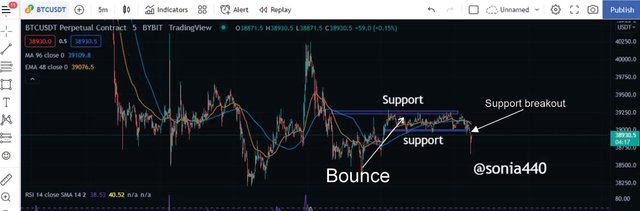
Q4. - It explains how to correctly identify a bounce and a breakout. (Screenshots required.)
A bounce of Resistance or Support: This is when the price movement moves away from a support or resistance level approaching or testing the support or resistance level. Bounce movement can take place as a result of possible liquidity which didn't take place because of an opposing force encountered causing price to return to its inital movement.
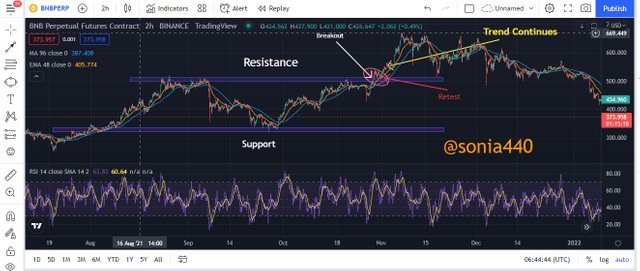
Breakout is when the market trend moves away from support or resistance line, it can be to be upward trend movement in up away from resistance or downward direction down away from support . We have things that happens when breakout takes place:
There is a retest before the trend continues :
Most times when the price movement breaks the resistance, it touches the resistance before it continues upward. For Support when the price breaks the support it retest the support before it continues downward and when this happens the support changes to resistance and support becomes the resistance just has shown in the screenshot below.There is always a trend continuity:
When support and resistance is broken the movement continues in the direction of the trend unless the market gains a momentum to return back.
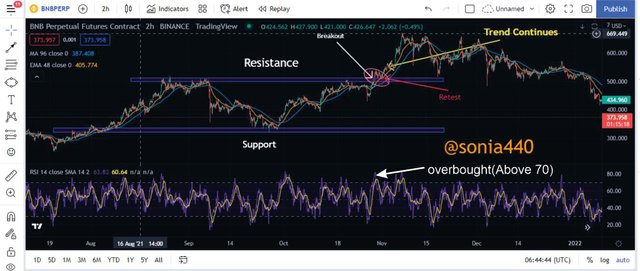
Breakout of resistance is when their is continuous upward movement of the price of an assets up away from the initial points of resistance. When the price moves above the initial resistance its said to be breakout in resistance .
Breakout of support is the continuous downward movement of the price of an assets down away from the initial points of support. When the price moves below the initial support its said to be breakout in support .
Breakout of Resistance
For this illustration, I will using MA, EMA20 along side RSI indicator.
From the screenshot, MA, EMA along side RSI which was used to note my position. Whenever EMA 48 and MA 96 meets and you see MA on-top it shows that the trend is in bearish trend but when you see it below it shows bullish trend. I noticed that the market was in a bullish trend and also to confirm the breakout I used the RSI indicator to my chart.
From the screenshot below , the price of the asset was showing overbought as the RSI line was found above the upper band level above 60 . RSI indicator shows that from threshold of 70 above signifies overbought and from the screenshot it clearly shows overbought.
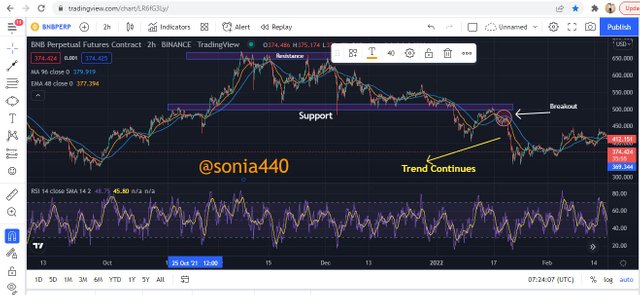
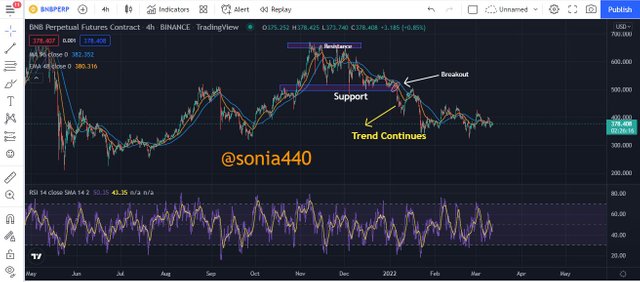
Breakout of Support
For this illustration, I will using MA, EMA20 along side RSI indicator.
From the screenshot, MA, EMA along side RSI which was used to note my position. Whenever EMA 48 and MA 96 meets and you see MA on-top it shows that the trend is in bearish trend but when you see it below it shows bullish trend. I noticed that the market was in a bearish trend and also to confirm the breakout I used the RSI indicator to my chart.
From the screenshot below , the price of the asset was showing oversold as the RSI line was found above the upper band level below 30 . RSI indicator shows that from threshold of 30 below signifies oversold and from the screenshot it clearly shows oversold.
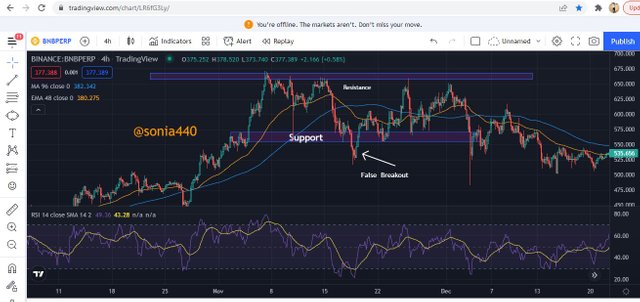
Q5. - Explain that it is a false breakout. (Screenshots required.)
A false breakout occurs when the price movement breaks through a support or resistance line and then it returns back to the initial zone it was before the breakout took place . false breakout tends to clear or flush out weak traders that trade base on emotions. When ever false breakout takes place, it doesn't continue it's movement in the direction of breakout rather it returns back to its initial resistance or support range. This takes when the bigger investors that maintain the momentum pull out their funds which can cause great loss to smaller investors or new investors that just entered the market.
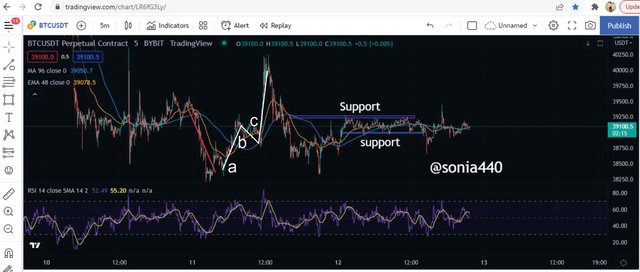
Q6. - Explain your understanding of trend trading following the laws of supply and demand. It also explains how to place entry and exit orders following the laws of supply and demand. (Use at least one of the methods explained.)(Screenshots required.)
Trend trading is sure way that follow the law of demand and supply it can be seen when market following a new trend, We can use market trend to take profit, I will be using Elliot theory, where we see a retracement in the market using the market volume .
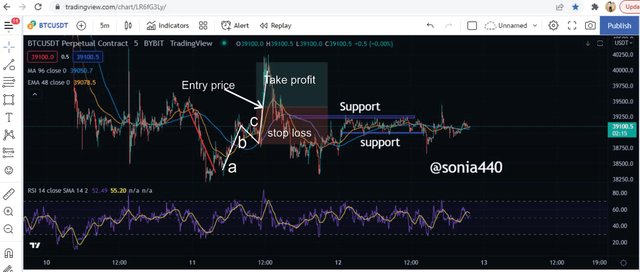
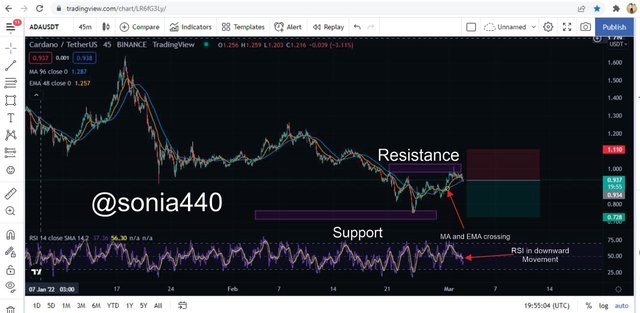
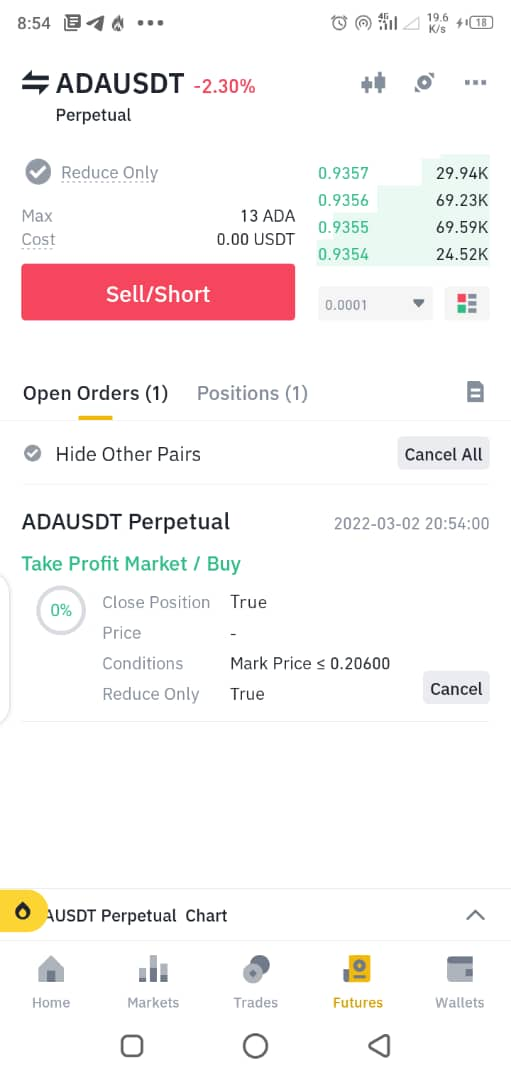
In this part I will be using ADA/USDT pairs which I picked for this assignment and the analyses was done using a 45min chart, From the image below, MA, EMA along side RSI which was used to note my position. also note that Whenever EMA 48 and MA 96 meets and you see MA on-top it shows that the trend is in bearish trend but when you see it below it shows bullish trend. I discovered that the market was in a bearish trend movement for sometime and it has not gained it stand in the market.
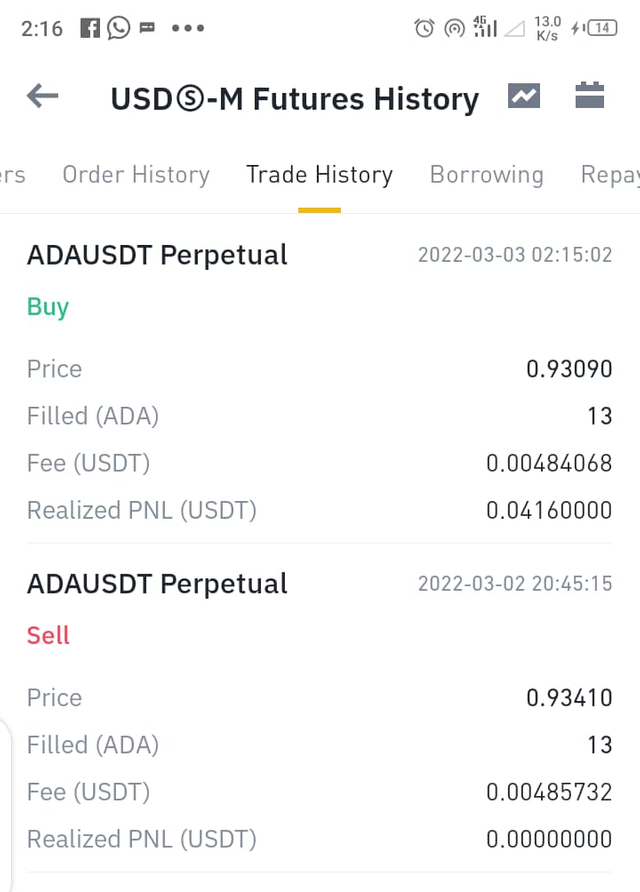
And I also use RSI in downtrend movement which also shows that the market is in bearish movement. According the image below, So I placed trade with entry price of 0.93410 and I set my take profit at 0.20600 and stop loss at 1.110 after so many hours I have I have to close my order with $0.0416 interest.
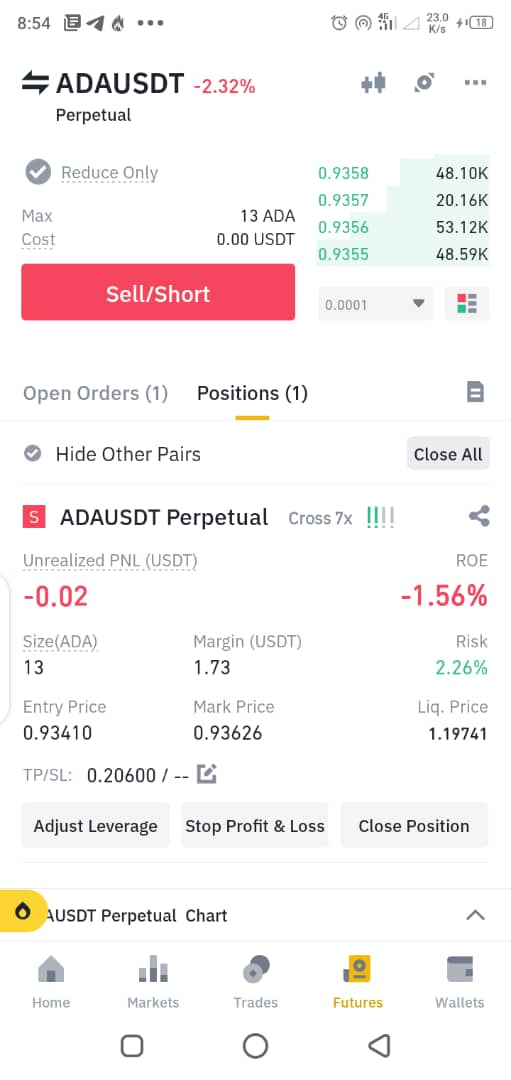
The image below shows my sell orders carried out on binance exchange. So I placed trade with entry price of 0.93410 and I set my take profit at 0.20600 and stop loss at 1.110 after so many hours I have I have to close my order with $0.0416 interest.
After some hours I closed the trade with profit of $0.0416
Conclusion
The important of support and resistance in trading can never be overlooked before buying and selling .Fibonacci is used to determine the depth of a retracement that took place between support and resistance zone. The Fibonacci tool made of horizontal line marked diagonally between points(high and low points ), in the market system. Thanks' professor @nane15 for this great lecture.
