[REPOST][Trading Using Wedge Pattern] - Crypto Academy / S5W5 - Homework Post for @sachin08


Homework Question
- Explain Wedge Pattern in your own word.
- Explain both types of Wedges and How to identify them in detail. (Screenshots required)
- Do the breakout of these Wedge Patterns produce False Signals sometimes? If yes, then Explain how to filter out these False signals.
- Show full trade setup using this pattern for both types of Wedges.( Entry Point, Take Profit, Stop Loss, Breakout)
- Conclusion
Introduction
Good Day Steemians , I will be responding to Home task given by professor @sachin08 , Thank you for this Great explanation on ''Trading Using Wedge Pattern'' . below is my homework.

- Explain Wedge Pattern in your own word.
Explain Wedge Pattern
A wedge pattern can be describe as a price pattern that takes place after an up trend or down trend, indicating if a trend will continue or reverse .
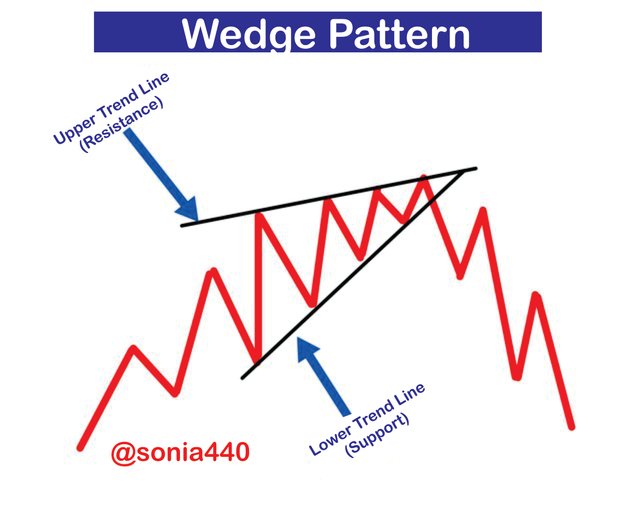
Wedge pattern is used by traders or investors to know the price or predict the price movement, if it's going to reverse or continue . The wedge pattern looks like a triangle with two sides forming support-resistance. The prices tend to move before forming a wedge. In wedge pattern, price tend to go up or down along side the edge.
Designed by me using canva
Wedge pattern look like a triangular shape that has a open base with a narrow end. It implies that wedge pattern starts wide and then meet at a end over a period of time. Wedge pattern slow the movement of price in different direction. I
We have two type of trendline in Wedge pattern : the upper trendline and the lower trendline . Upper trendline is the resistance while the lower trendline is the support. In wedge pattern, the price always touch both the resistance and support trendline until a break out happens.
The wedge pattern can be in form of trend continuation or trend reversal. And in wedge patterns we also have rising wedge and falling wedge.
- Explain both types of Wedges and How to identify them in detail. (Screenshots required)
We have two types of wedge pattern in trading they are :
- The rising wedge
- The falling wedge
Rising Wedge
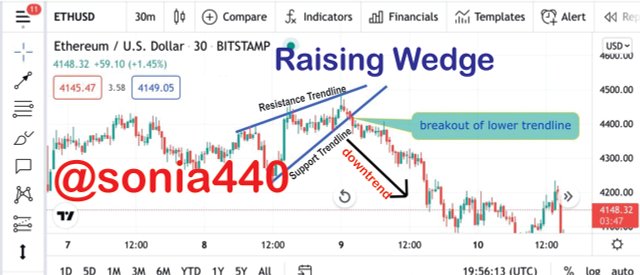
Rising wedge is the type of wedge pattern that occurs in a bearish movement. The trendlines start wide from below and then it keeps narrowing as price moves up until it finally converge at a point above before a break out occurs.
Rising wedge is also known as bearish pattern because when movement occurs it shows reversal of bull trend or continuation of bear trend. In rising wedge a trendlines is drawn above and below the pattern, so to acts as support and the other will act as resistance .
This pattern always occur at the end of a bull trend such that the price will reverse to the opposite direction and it can also be seen during a bear trend.
Source: Tradingview
The screenshot above signifies a rising wedge . Before the rising wedge occurs, the price was making a lower highs and lower lows movement. Then at some point, the price retraced which resulted to the formation of a rising wedge as shown in the above screenshot.
How to Identify a Rising Wedge
There must be presence of multiple touches from the support trendline and resistance trendline. For a raising wedge to be valid there must be at least 5 touches.
The first thing trader is meant to do is to identify to identify where there is small pause movement of price. It is also an indicator that a rising wedge can form or is about to occur.
Another possible way to recognize a raising wedge is to draw a two trendlines , the upper trendline going to connect highs and the lower trendlines will connect the lows.
When a rising wedge takes place volume always decreases. And the Breakout Volume can either be can be heavy or small.
Falling Wedge
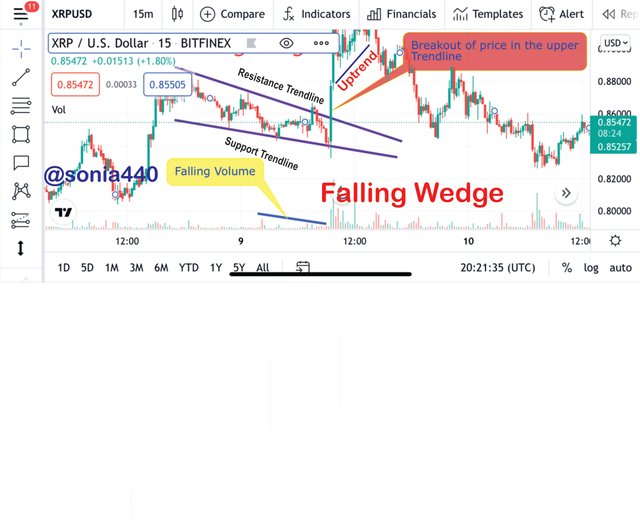
Falling wedge is just the complete opposite of rising wedge. Falling wedge has a downward convergence of trendline, which implies that the wide side of trendlines begins from the top and it keep narrowing as the price makes a downward movement until it finally meet at a point just below before the break.
Falling wedge is also known as bull because when it happens it signifies a trend reversal or continuation of a bulltrend. In falling wedge the highs and lows always decreases and the price keep on narrowing in a way that the resistance trendline and support trendline which connects the highs and lows meet below.
Source: Tradingview
The screenshot above signifies a falling wedge . Before the falling wedge occurs, the price was making a lower high and lower lows movement. Then at some point, the price reversed and went upward which resulted to the formation of a falling wedge as shown in the above screenshot.
How to Identify a Falling Wedge
There must be presence of multiple touches from the support trendline and resistance trendline. For a falling wedge to be valid there must be at least 5 touches.
The first thing trader is meant to do is to identify to identify where there is small pause movement of price. It is also an indicator that a falling wedge can form or is about to occur.
Another possible way to recognize a raising wedge is to draw a two trendlines , the upper trendline going to connect highs and the lower trendlines will connect the lows.
When a falling wedge takes place volume always decreases. And the Breakout Volume can either be can be heavy or small.
- Do the breakout of these Wedge Patterns produce False Signals sometimes? If yes, then Explain how to filter out these False signals.
False Signals with the Wedge Pattern Breakouts
My answer here is YES I believe a wedge patterns breakout often produces false signals.
In-order to avoid false signals , it is very necessary to make use of risk management principle while trading which is about stopping loss and taking profit when necessary.
False signals produced by wedge pattern can be filtered in many many ways, which will include using different indicators for confirmation and using it alongside the volume for confirmation. just as in the image below.
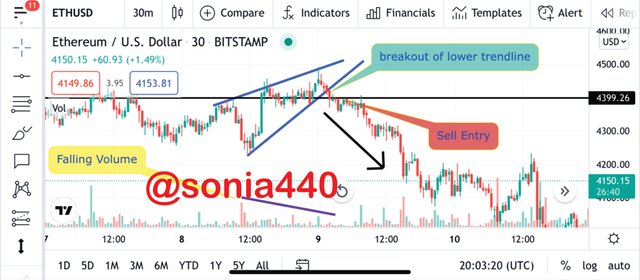
- Confirmation with Falling Volume
False breakout can be filtered just by adding the confirmation with a falling volume where we can buy or sell a assets
Source: Tradingview
Source: Tradingview
We have other indicators that can be used to filter false breakout in wedge pattern so as to increase multiple confirmations and also increase probability of take profit level. LIst of indicators that can used include:
- The stochastic,
- Parabolic sar indicator and
- Relative strength index indicator .
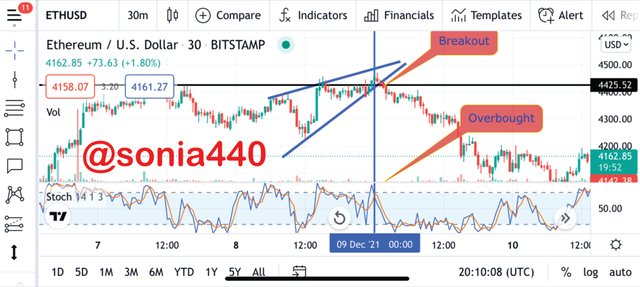
I will be the stochastic indicator for my explanation. The stochastic indicator signifies overbought and oversold regions. The overbought regions signifies a point where traders tired of buying a particular asset while oversold region signifies a point where traders are tired of selling a particular asset. The overbought region signifies a sell order which which will give room for a rising wedge while oversold signifies a buy order which will give room for a falling wedge.
Therefore with the help of stochastic, we can filter false breakout of the wedge pattern.
Source: Tradingview
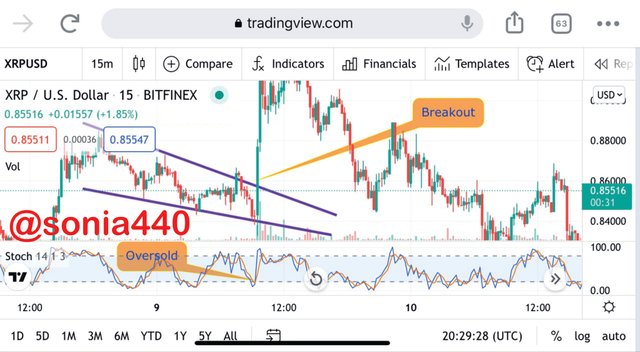
Source: Tradingview
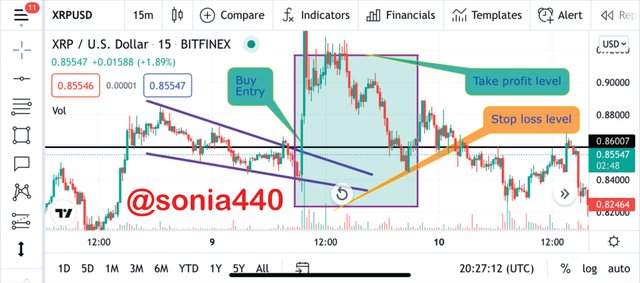
- Show full trade setup using this pattern for both types of Wedges.( Entry Point, Take Profit, Stop Loss, Breakout)
Raising Wedge
Source: Tradingview
Source: Tradingview
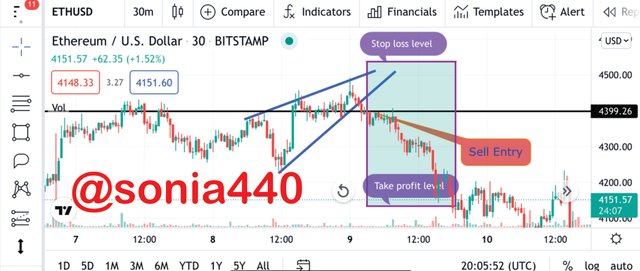
From the screenshot above there a rising wedge trade. We can see how the price is bouncing back as it touches both resistance and support trendline and it also makes multiple touches at the trendlines before price takes a downward break . The entry order was placed just after the break of the support trendline and stop loss order above the resistance trendline. Take profit order was also set by taking measurement of the distance between the support and resistance trendline .
Falling Wedge
Source: Tradingview
Source: Tradingview
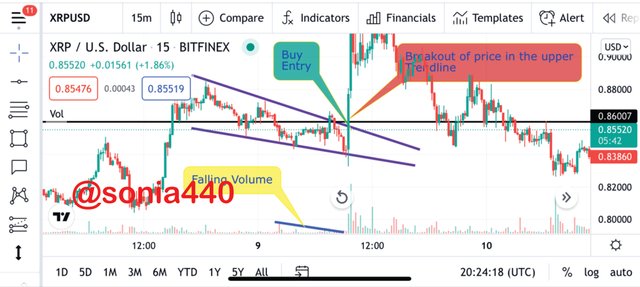
From the Screenshot above, there is a falling wedge formed just below the bearish trend. The price keeps bouncing up and down as it touches both resistance and support trendline . After some time the price moves against the resistance trendline. Just as it break the resistance trendline, a trade entry was recorded and stop loss placed just below the support trendline. Take profit order was also set by taking measurement of the distance between the support and resistance trendline .
Conclusion
In this lecture I was able to understand what wedge pattern is and the types (raising and falling).
Sometimes wedge pattern can produce false breakout and We have indicators that can be used to filter false breakout in wedge pattern so as to increase multiple confirmations and also increase probability of take profit level example;the stochastic, Parabolic sar indicator and Relative strength index indicator .
Am Thankful professor Professor @sachin08 for this wonderful lecture.