Technical indicator II Steemit Crypto Academy- S4W4- Homework Post for @reminiscence01
Explain Leading and Lagging indicators in detail. Also, give examples of each of them.
Leading indicators: these are simply indicators that tend to predict the direction a trade is heading in the financial market even before the commencement of the movement. Its a very useful technical analytic tool which helps to predict the future trend of a particular asset. It also guides the trader in making decision fast on when to enter the market and when to exit. This indicator is very useful for short term trade and on a sideways market.
However, its major demerit is that it has the tendency of misleading the trader into a false breakout as it gives its signal very early which might sometimes be misleading. Examples of this indicators includes; stochastic, donchian channel, RSI.
lagging indicator: A lagging indicator simply shows the direction of trade in the financial market after the commencement of the move. This type of indicator is suitable for a long term trade as it influences the trader's decision on when to enter the market after a advent of a clear signal.
This indicator often lags behind and may have a wide stop loss. However, they do not mislead the trader into false breakout as the signal often appears after the start of the trend. Examples of this types of indicators includes; the moving average, MACD, parabolic, SARS, etc.

With relevant screenshots from your chart, give a technical explanation of the market reaction on any of the examples given in question 1a. Do this for both leading and lagging indicators.
Leading indicator
In the explanation of the leading indicator, I'll make use of the stochastic indicator
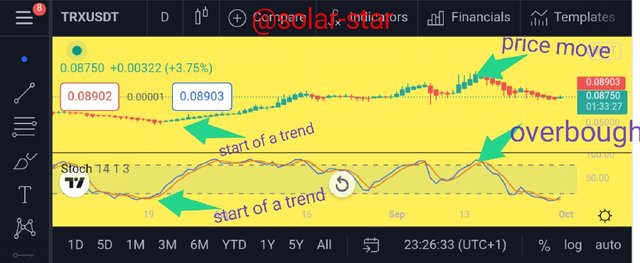
As shown above, the market signal appears early enough before the actual trend begins. This is evident at the overbought position as the chart moves downward after previously being in an overbought position, this particular movement indicates or signifies the presence of a leading indicator.
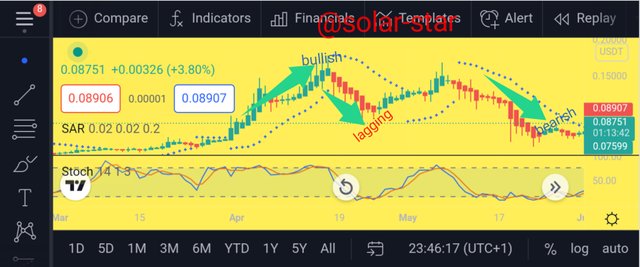
lagging indicator
As seen from the chart below, the parabolic SAR indicator has shown a lagging characteristics by not showing the signal early enough at the start of the market trend. The signal only appears after the commencement of the actual market move. This type of scenario is synonymous of a lagging indicator.
What are the factors to consider when using an indicator.
understanding the market trend; In other to be a successful trader, one must well vested on the knowledge about the workings of the market trend. The market trend helps to know when to enter the market and when to exit it. A good trader knows that its risky to go against the market trend, that's why this knowledge is paramount to the success of any trader in the financial market.
understanding the type of indicator to use; There are a lot of indicators out there for usage, but its always advisable to study only a few that you'll be able to effectively apply on your chart. There us no point of using numerous indicators in technical analysis as this indicators may tend to confuse the trader. However, the knowledge of technical indicators is good, but understanding how to effectively use them in analysis a chart is the core value.
understanding your trading strategy; Every trader must have a unique strategy in which he or she employs on every trading, This strategy must be workable, simple and unique to the trader. This is in fact the most important factor when dealing with technical indicators. Every trader should be able to device his or her own strategy that best suits the type of trade, the duration of the trade and volatility of the market. This knowledge is essential for the success of every trader.
finding confluences; confluence deals with the confirmation of signals through the use of other of other tools. This process is very significant in technical analysis as it helps to increase the efficiency and the productivity of the indicators used. This knowledge is very essential in other to make a good trading decision.
Explain confluence in cryptocurrency trading. Pick a cryptocurrency pair of your choice and analyze the crypto pair using a confluence of any technical indicator and other technical analysis tools. (Screenshot of your chart is required ).
Confluence is simply when when the indicator moves in tandem with the market action i.e when signal given by the indicator corresponds with the market trend.
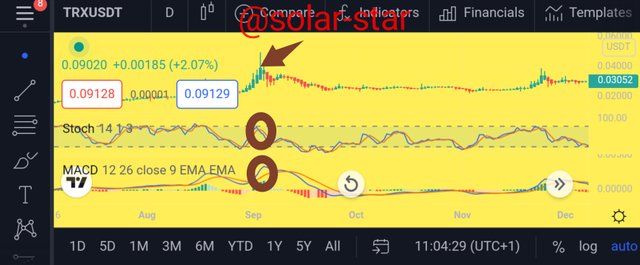
As seen above in the crypto currency pair of TRXUSDT, the technical indicator used highlights the confluence showing that the signal is authentic as duly confirmed by another indicator. Therefore, to avoid fake signals in the financial market, its always advisable to look out for this things before or while placing a trade.
Explain how you can filter false signals from an indicator.
In other to filter false signal from an indicator, we can make use of concurrent indicators to determine the authenticity of the signal. In this process, the direction in which the indicator moves is being compared with the price reaction of the financial market at that point in time, this is to ascertain that the indicator moves in tandem with the current market trend. This is known as confluence. By doing this,the rate of losses can be greatly reduced. However, one of the major demerits as regards the use of technical indicator is the misleading characteristic in which they all possess.
Explain your understanding of divergences and how they can help in making a good trading decision.
Divergence is simply the state which the indicator seems to be in a form of disagreement with the price movement. In other words, the market price is moving in a different direction as compared to the indicator. when this happens, it signifies an intending change in the market. This indicates that the price is about to shoot up or vice versa, divergence can therefore be likened to a reversal indicator.
Divergence are very important tools in making good decisions as regards trading, this is due to the fact that it will help filter off false signal which is predominantly experience in the financial market. Its imperative to understand the workings of this tool in other to broaden your knowledge of financial market.
Using relevant screenshots and an indicator of your choice, explain bullish and bearish divergences on any cryptocurrency pair.
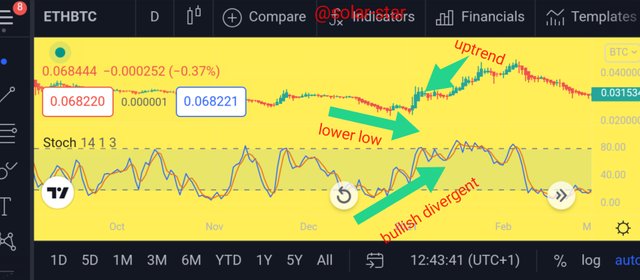
bullish divergence
This is simply a kind of divergent in which the indicator signals an uptrend while the actual market price shows a downtrend. This dis parity in data may signify a reversal in the
market trend as the current market trend might be coming to an end. This is shown below using the ETHBTC crypto pair
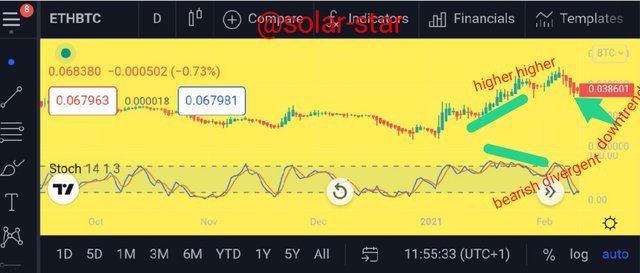
Bearish divergence
This is simply a form of divergence in which the indicator signals a downtrend while the current market price shows an uptrend. This abnormale may signify that the there is an intending change in the market trend. This is shown below using the ETHBTC crypto pair
Conclusion
The knowledge as regards the use of technical indicator is very essential as it will help influence the decisions of a trader which might have been detrimental. This important tool provides one with numerous approach to the financial market.
False signals can easily be detected if the trader is well vested with this knowledge.
N/B: all photos used on this post are screenshots from the official site of trading view.
Hello @solar-star, I’m glad you participated in the 4th week Season 4 of the Beginner’s class at the Steemit Crypto Academy. Your grades in this task are as follows:
Observations:
It doesn't necessarily have to be between an indicator and market trend. It can also be indicator with other indicators or indicators with other technical analysis tools.
Recommendation / Feedback:
Thank you for participating in this homework task.