Heikin-Ashi Trading Strategy-Steemit crypto academy /s4w2/Homework post for @reddileep
define Heikin-Ashi technique in your own words?
Heikin-Ashin technique can simply be defined as the technique in which a current market pattern can be calculated from the previous candle data. This data include; the open, close, high, and low prices of the previous candles. This technique is based on a two period averages.
Heikin-Ashi is a japanese word which stands for "average bar", it was developed by munehisa Homma in the1700s. This technique uses the average data of previous candle to calculate the current trend. Unlike the traditional Japanese chart, this technique looks smoother, making it relatively easy to spot market trend

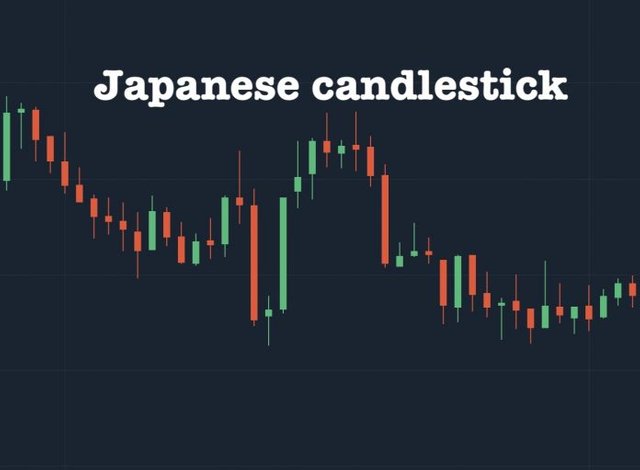
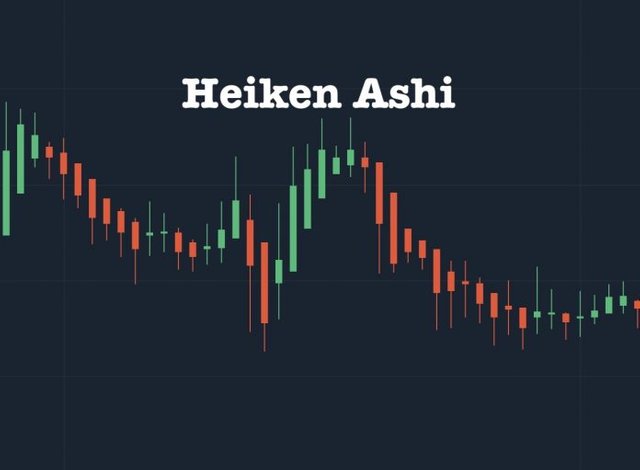
Make your own research and differentiate between the traditional candlestick chart and the Heikin-Ashi chart. (Screenshots required from both chart patterns)
| Heikin-Ashi candle stick chart | traditional candlestick chart |
|---|---|
| It uses the values of the previous candles to determine the current trend | The current trend is not calculated from the previous data |
| The technique generally helps to filter out noise through the use of average price price data | they do not make use of the average price data |
| It looks smother, making it relatively easy to spot market trends | it looks complex, hence market trends are difficult to spot. |
| They display successive colour patterns making it easy for traders to identify trends | they change colours from red to green and vice versa |
| It uses formulas to calculate the next trend | formulas are not in use |
| It makes the interpretation of price movement relatively easy | price movement may not be easily interpreted. |
Explain the Heikin-Ashi Formula. (In addition to simply stating the formula, you should provide a clear explanation about the calculation)
The Heikin-Ashi formular uses four parameters for its calculations, i.e the open, close, high, and low. The open-high-low-close from the current data and open-close data from the period.
• open: this can be calculated by dividing the open of the previous candle and the close of the previous candle by two just as shown below
Open = (open of previous candle + close of previous candle)÷2
The open is always set at the middle point of the body of the previous bar.
• close: this can be calculated by adding the open, close, high and low points of the current and dividing them by four just as shown below
Close = (open + close + high + low of current candle)÷4
The close can be calculated as the average price of the current bar.
• High: this is equal to the maximum value of the high, open or close points of the current candle
High = maximum value of high, open, or close of the current candle.
High is usually the highest values among the current high, open and close.
• low: this is equal to the minimum value of the low, open or close points of the current candle.
Low = minimum value of low, open or close of the current candle
The Heikin Ashi formula can be used on any time frame, be it the intraday, weekly or monthly.
Graphically explain trends and buying opportunities through Heikin-Ashi Candles. (Screenshots required)
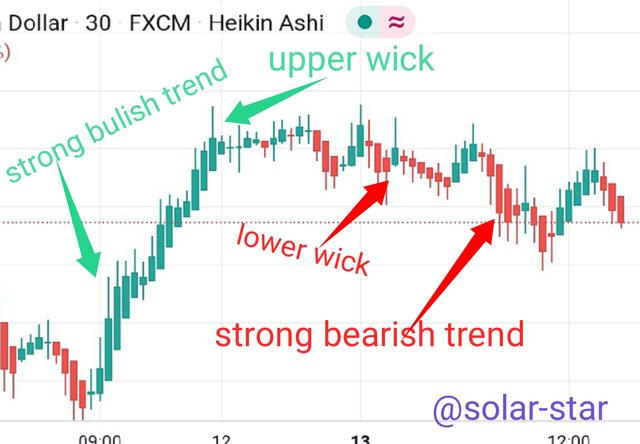
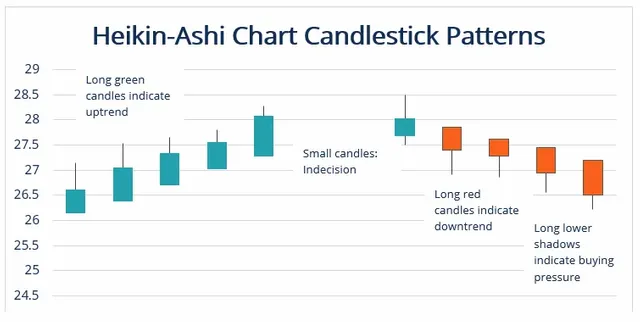
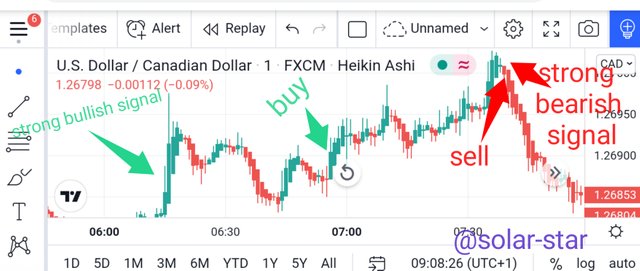
• Bulish trend:this is a very strong signal indicating an uptrend in the market. They appear as successive green candle stick without lower wick.
• Bearish trend: this is a strong signal indicating a downtrend in the market. They appear as successive red candle stick without upper wick.
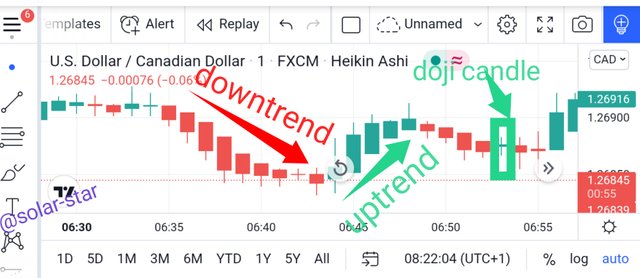
• Indecision or doji candle: they appear as small candles with long wicks. They indicate market uncertainties.
The emergence of a strong bulish trend indicates an uptrend, hence traders with short position may leave the market, while those with long positions may consolidate on their position. Its a good position to place the buy order. The reverse is the case for a strong bearish trend which offers a good position to place the sell order.
For doji candles, its emergence indicates either a pause in trade or a reversal, hence the trader must be very technical to determine which to follow suit
Is it possible to transact only with signals received using the Heikin-Ashi Technique? Explain the reasons for your answer.
It is very possible to carry out transactions with only signals recieved from Heikin-Ashi indicator. this is because the charts of Heikin-Ashi are very smooth, and can be interpreted very easily by a trader. This reduces the risk of losses.
In addition to that, the Heikin-Achi patterns are oftenly very accurate and precise compared to the traditional candlestick.
However, it is at the discretion of the trader to determine whether to use only Heikin-Ashi or combine it with other indicators. It is worthy of note that no indicator is 100% certain as market behaviour may change anytime. Hence, the trader needs to be very careful while performing transaction with only one indicator.
By using a Demo account, perform both Buy and Sell orders using Heikin-Ashi+ 55 EMA+21 EMA.
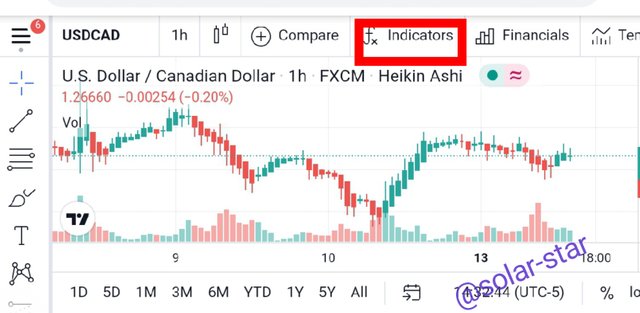
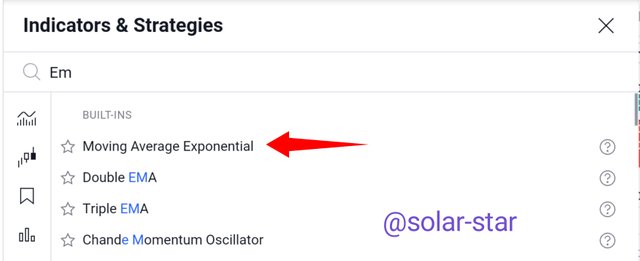
In other perform the buy and sell order using the heikin-ashi + 55 EMA + 21 EMA, go to https://www.tradingview.com and click on the fx indicator Icon as shown below
Search for the EMA indicator and add after which close the pop up menu as the indicator has been added successfully
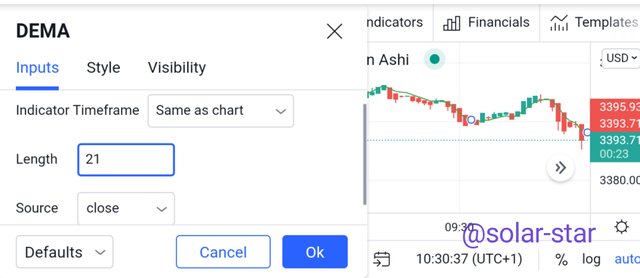
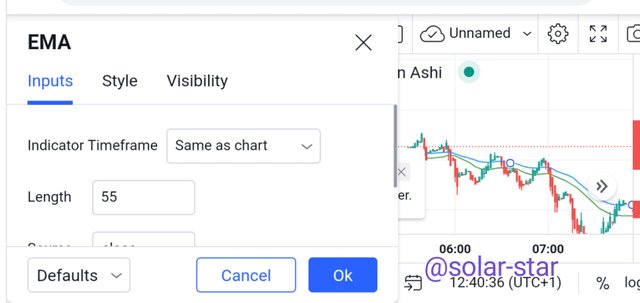
Configure the settings accordingly and set the periods at 21 and 55 as shown below
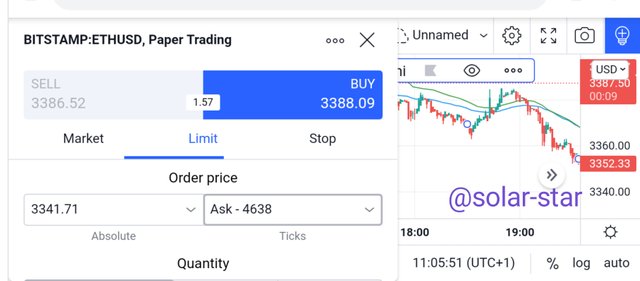
Buy signal
In placing the buy order, you look out for where the two lines of the EMA crosses each other below the price chart, this depicts that there is an uptrend in the market which is a good time to place an order.
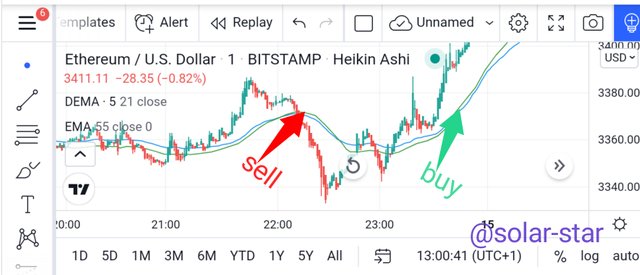
sell signal
In placing the sell order, you look out for where the two lines of the EMA crosses each other above the price chart. This point is suitable enough to place the sell order as the market is currently on a downtrend.

conclusion
Heikin-Ashi technique is a very unique strategy as it offers us with another alternative different from the conventional candle stick patterns. This tool is often more suitable for long term trade as it eliminates the the occurence of false signals. It is very easy to spot market trends using this tool. However, it also has its own limitations as it is not advisable for short term trade and scalping.
Thank you
Nice work
This really good
Thanks 😊