Steemit Crypto Academy Season 3- Dynamic Course for Beginners – Week 7 | Analysis and Trading with the indicators "Stochastic Oscillator + "Parabolic Sar" by @small-ville
.jpg)

Define in your own words what is the Stochastic Oscillator?
A stochastic Oscillator is a Trading Indicator that measures the momentum of price by indicating the Overbought and Oversold periods, this means it helps the user know when there is going to be a reversal in the trend. It was founded in the 1950s by a Technical Analyst Name Dr, George Lane.
The value of the Stochastic Oscillator is bounded between 0 and 100, but also has a default limit for the Overbought and Oversold areas at 80 and 20 respectively. The Stochastic Oscillator plots 2 lines on the chart one known as the %K and the other %D.
Explain and define all stochastic oscillator components (line %k, line %D + overbought and oversold limits)
Line %K
This is the Main Stochastic Oscillator, which is used to indicate overbought and oversold areas. This is calculated by using this formula %K=(Ccp-Lp)/(Hp-Lp)*100
Ccp= Current closing price
Lp= Lowest period
Hp= Highest period
Line %D
%D Which is also known as the signal line is calculated using this formula; %D= (Average %k)/(default periods), This is also known as the slow stochastic because of its slow responsiveness to assets.
Overbought Limits
Overbought Limit is when there is an influx of buyers into the market so much that the line of %K goes above 80 ( 80 is the default overbought limit)
Oversold limits
Oversold limits are when there is an influx of sellers into the market so much that the %K line goes below 20 (20 is the default oversold limit)
Briefly describe at least 2 ways to use the Stochastic Oscillator in a trading operation
Entry trigger
It serves as a confirmation tool to get into a trade, a confirmation tool could be a bearish or bullish hammer which the Stochastic Oscillator could serve as, because when the market trades above the oversold or below the overbought level that could potentially serve as an Entry trigger.
Indication of Pullback periods in a down or uptrend
When the market is in the downtrend you look for overbought areas and if the market is in the downtrend you look for oversold areas because the overbought and oversold areas are potentially where the pullback will end.
Define in your own words what is the Parabolic Sar?
The Parabolic SAR is a technical indicator, invented by J. Welles Wilder Jr. It is used to identify or discover the direction of a trend, it can also be used as an entry signal generator or as a trailing stop loss indicator and also as an exit signal generator.
The Parabolic SAR is identified on the trading charts as series of dots lying either above or below the price trend. when the dots are above means that a bearish trend is about to suffice, also if the dots are below means that the bullish trend is about to suffice. The Parabolic SAR uses a method called the Stop and Reverse to find entry signals
Explain in detail what the price must-do for the Parabolic Sar to change from a bearish direction and vice versa
A parabolic SAR is identified as a chain of dots that move below or above the price trend. For the Parabolic SAR to change from a Bearish direction to a Bullish direction at least 3 series of dots need to appear above the price trend. Also for the SAR to change from bullish to Bearish direction at least 3 series of dots need to appear below the price trend before the potential trend reversal can be verified.
Briefly describe at least 2 ways to use parabolic SAR in a trading operation?
Entry signal generator.
When a trader wants to predict a potential entry price. This can be identified when the Parabolic dot moving under an upward trend suddenly starts to appear above or below the trend, this shows that a downward or bearish trend is about to begin. But the user has to wait for the entry candle to be complete before making an entry at the closing price of the candle.
Price Trend Identification
The parabolic SAR can serve as a good technical guide because it can be used to predict a trend reversal. When the Parabolic dots are above the candles then the market is in a downtrend also when the dots are below then the market is in an uptrend.
show a step-by-step of how to add the Stochastic Oscillator (Pointing to Line %k and Line %D, the overbought and oversold zone) to the graph
To add the stochastic oscillator, click on the Indicator icon

Then scroll down till you reach the Stocastic indicator, then click on it.

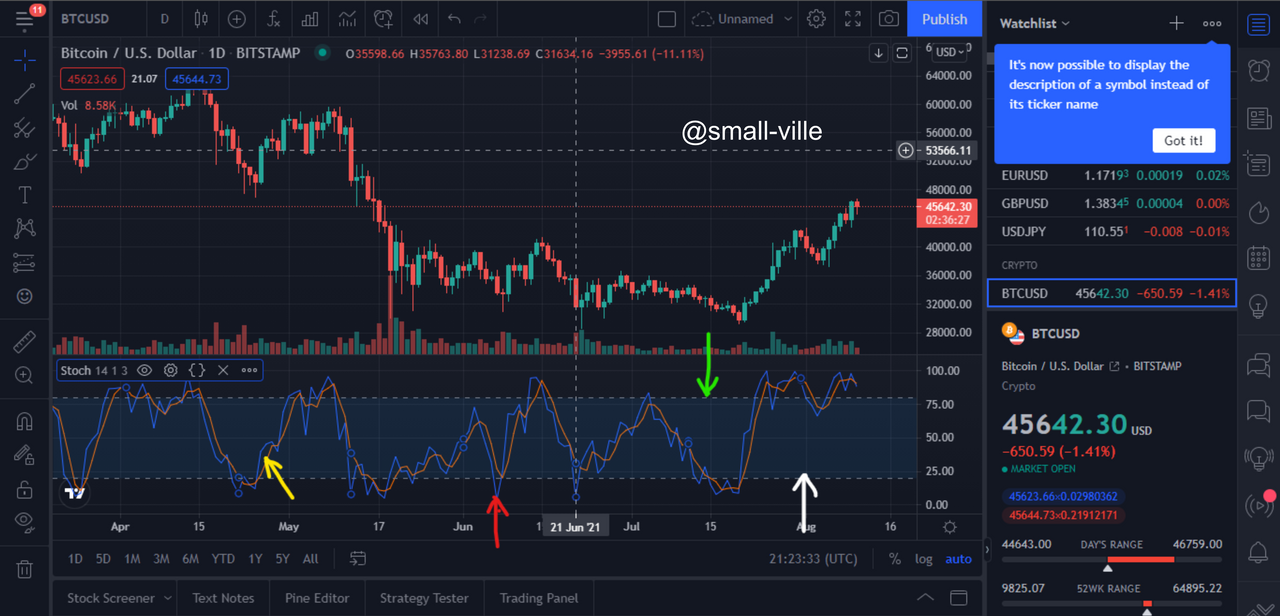
The Stochastic indicator will appear below the trading charts.

The line marked by the green arrow is the default overbought limit, while the line marked by a white arrow is the default oversold limit.
The red zig-zag line marked by a yellow arrow is the %k( the main Stochastic), while the zig-zag blue line marked by the red arrow is the %D (average %K)
Show step by step how to add the Parabolic Sar to the chart and how it looks in an uptrend and a downtrend
When you click on the indicator icon a list of indicators will appear.
Then scroll down till you reach the parabolic SAR then click on it.

The parabolic SAR is identified as dots that run above or below the price trend.
The yellow arrow which points at the parabolic dots below the price trend shows the market is in an uptrend, while the green arrow pointing at the parabolic dots above the price trend shows the market is in a downtrend.
Add the two indicators (Stochastic Oscillator + Parabolic Sar) and simulate a trade in the same trading view, on how a trade would be taken.

I am using the MT5 trading view to illustrate the use of the Stochastic and Parabolic SAR in a trade.
looking at the Stochastic oscillator I can see that the %K has crossed the default overbought limit, this would interpret that there should be a reversal in the market. Also looking at the Parabolic SAR I can see that the market is in an uptrend because the parabolic dots are below the price trend, but the Parabolic signal has not yet given any indication that the market would potentially enter a downtrend, because the parabolic dots has not yet appeared above the price trend. Looking at the chart I could see the market, in general, is in an uptrend but there could be a potential for a short reversal that is why I placed a short sell order.
Conclusion
The Parabolic SAR and the Stochastic Oscillator are wonderful technical indicators, they can also mislead an amateur who does not know how to read the market. Using any of them alone can be very catastrophic for any user that is why it is advisable to merge any of them with another indicator to achieve a concrete result.
Technical Indicators are very helpful tools in predicting the market, that is why I would recommend this course to every trader and crypto guru so they can be able to achieve good results in market prediction. Personally, this course has been an eye-opener in understanding the market trends and price momentum.
Thanks for reading
Special thanks to;