Crypto Academy Season 3 | Intermediate Course: Crypto Assets and the Random Index (KDJ) by @small-ville
.png)

What is The Random index and how is it calculated
The Random index which is also known as the KDJ is a trend and price market analysis indicator which is used to determine the direction of the market trend, entry points and overbought and oversold levels, and it works best when the market is volatile.
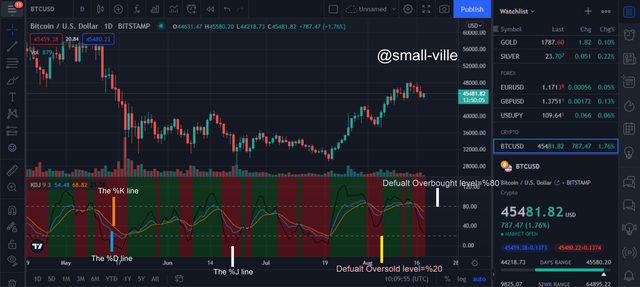
The KDJ name given to the random index is gotten from the %k, %D lines which are present in the Stochastic Oscillators, the Random index is very similar with the difference being the %J line. The J line is the area of separation between the line %K and %D.
To calculate the Random index which is KDJ. I would first calculate the Reserve value of the assets using the formular.
- RSV = (Ccp-Lp)/(Hp-Lp)*100
Ccp= Current closing price
Lp= Lowest period
Hp= Highest period
To calculate the K and D values I will use the formula.
K value of the day= 2/3 X previous day K value+ 1/3 X RSV of the day
D value of the day=2/3 X previous day D value+ 1/ 3 X K value of the day
If the K value and D value of the previous day cannot be found the use 50.
- %J = 3 x %K day value - 2 x %D day value
Is the random index reliable? Explain
Different indicators are used in the trading world, but none of them is %100 accurate.
Just like every other indicator the Random index is not %100 accurate because in a flat market movement it would not give the desired outcome for a profitable trade. It is advised to use the necessary Risk Management procedures or the trader should make use of additional indicators so that the result or outcome would be much better.
How is the Random index added to a chart and what are the recommended parameters?
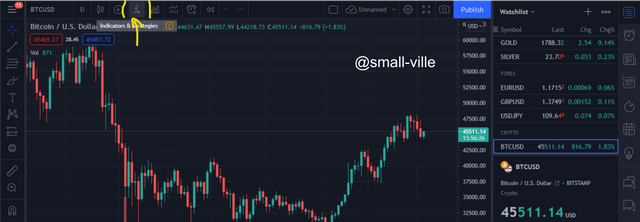
- To add the Random Index o a chart, first, click on the indicator icon
- Then search for the KDJ in the search area and click on it.
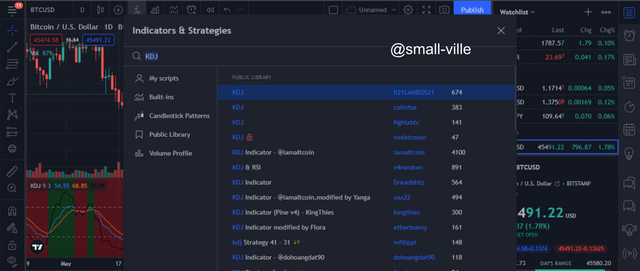
- This will make the indicator appear on the display chart
- When the indicator is visible on the chart you can modify the indicator by clicking on the settings icon. This will bring up an information box, with different tabs which include; Input, Style and Visibility.
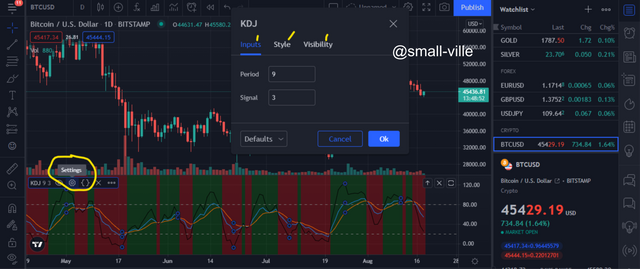
KDJ Parameters
The Random Index has so many uses but I will elaborate on the sell and buy signal.
Buy signal
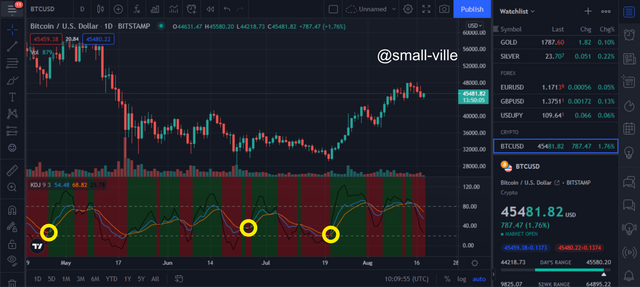
The buy signal can be identified when the %J line moves above the interception of the %K and %D line. Also notice that as soon as the %J line touches the interception of the %K and %D line the colour of the KDJ changes to Green when it moves above.
Sell signal
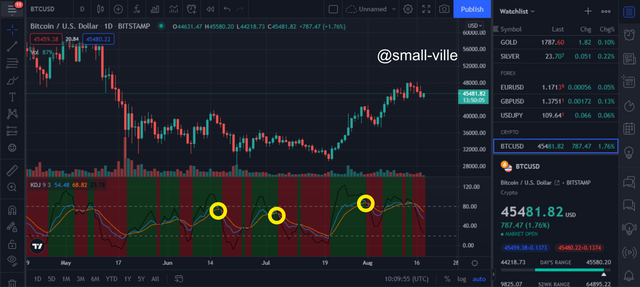
The sell signal can be identified when the %J line moves below the intercept of the %K and %D line. Also when the %J line touches the interception of the %K and %D line the colour of the KDJ changes to Red when it moves below.
Differences between KDJ, ADX, and ATR
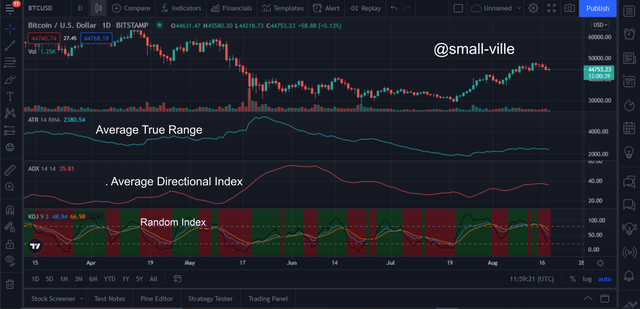
- KDJ is used to identify the direction of the trend and also it is used to determine the entry point for a trade. The KDJ shows multiple lines which are used to show the overbought and oversold signals, which other indicators do not show.
- Average Directional Index (ADX) is used to know when there is going to be a trend reversal and it stays ahead of the trend and also identifies how strong a particular trend is.
- The Average True Range (ATR) is used to know how volatile the market is, and also it is used to know when to exit and enter trades.
Use the signals of the random index to buy and sell any two cryptocurrencies.
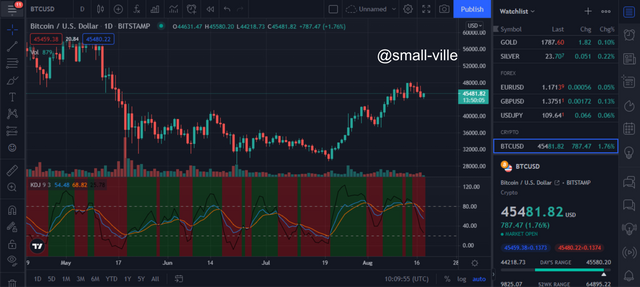
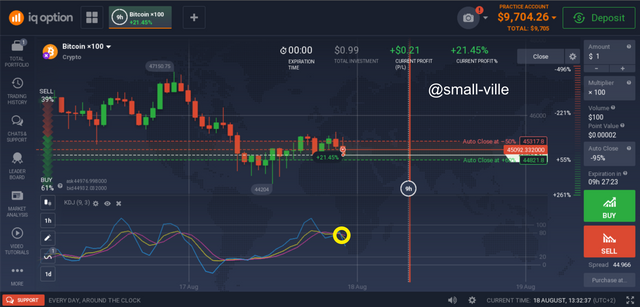
Looking at the first trade which is the bitcoin, the KDJ is indicating a sell order because the %J line has just moved below the intercept of the %K and %D line, that is why I placed a sell order.
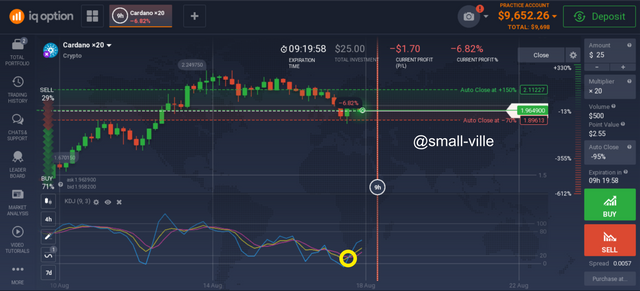
From the second trade which is the Cardano the %J line has just moved above the intercept of the %K and %D line. This indicates a buy signal.
Conclusion
The KDJ is a very important indicator that helps to identify trend direction and also gives signals on when to enter a trend, but sometimes the data that the KDJ gives might be false due to a flat market, I believe making use of the ADX and the ATX would give the trader more conclusive information about that particular security.
Thanks for reading.
Special thanks to Professor @asaj