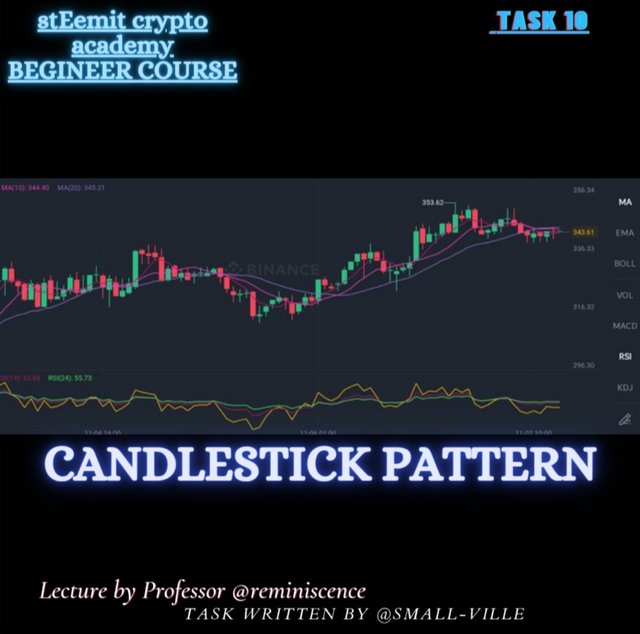
Candlestick Patterns - Steemit Crypto Academy Season 4 - Homework Post for Task 10
Hey guys,
I welcome you all to the steemit crypto academy introductory course task 10 by professor @reminiscence01.
Without wasting much of our time, I will quickly proceed with QUESTION 1.
1a) Explain the Japanese candlestick chart? (Original screenshot required).
b) In your own words, explain why the Japanese Candlestick chart is the most used in the financial market.
c) Describe a bullish and a bearish candle. Also, explain its anatomy. (Original screenshot required)

QUESTION 1a
1a) Explain the Japanese candlestick chart? (Original screenshot required).
INTRODUCTION
The history of the Japanese candle stick was dated as far back as the 18th century when a Japanese rice trader by name Munehisa Homma discovered that the rice market was not only influenced by just the law of demand and supply but also by the emotions of traders.
In the late 1800, Steve Nison properly introduced it to the western world in one of his books titled Japanese Candlestick Charting Techniques.
Ever since the popularity of this chart pattern has been on the increase yet there are still doubts that it was first used by Munehisa Homma. According to Steve Nison, the Japanese candlestick chart was first developed in the early part of the Meiji period in Japan.
The above belief led Steve Nison into quoting as thus:
However, based on my research, it is unlikely that Homma used candle charts. As will be seen later, when I discuss the evolution of the candle charts, it was more likely that candle charts were developed in the early part of the Meiji period in Japan (in the late 1800s).source
In as much as there this uncertainty on when the Japanese candlestick chart was first used and by who, there are still no objections on where it was first used which thus gave it the name Japanese Candlestick
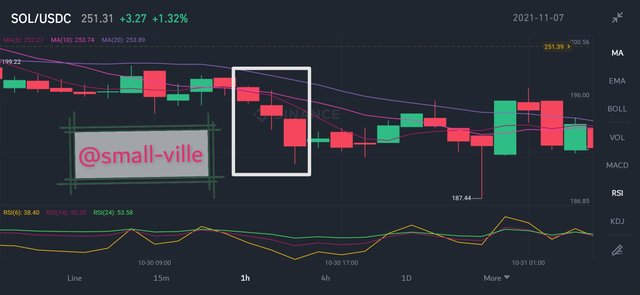
JAPANESE CANDLESTICK CHART
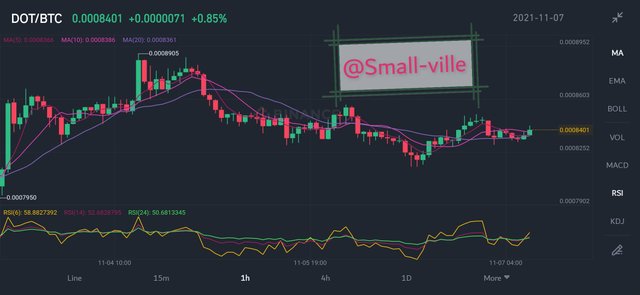
The Japanese Candlestick Chart is a type of financial chart which provides information on the current happenings on the financial market. This informations aid traders and analyts in speculating possible price movements and directions of assets.
The Japanese Candlestick chart looks more like a graphical representation of bar charts whose movement and formation are dependent on the activities of traders on the market, majorly their rate of asset demand and supply.
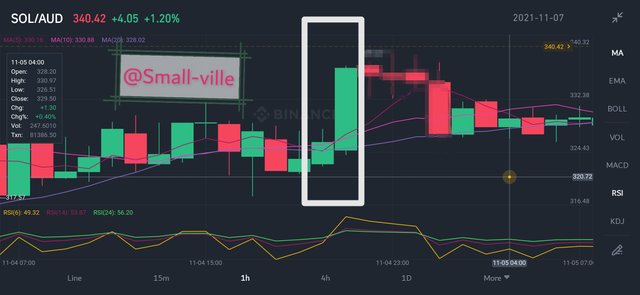
The candlestick chart is made of two similar but different candles which portray an increase or decrease in the rate of demand and supply.
The bullish candle which is usually set to be green or white in color, forms when there is a high rate of demand of an asset at a particular time frame, and the red or black cloured candlestick forms when there is a low rate of demand of an asset.
The overall formation of these green and red candles in a graphical pattern is what forms the Japanese candlestick chart.
QUESTION 1b
b) In your own words, explain why the Japanese Candlestick chart is the most used in the financial market.
The Japanese candlestick chart pattern has been widely adopted by traders and analysts since its discovery because it gives a clear understanding of what is happening in the financial market.
Some of this information include;
- Rate of demand
- Rate of supply
- Opening and closing point of an asset, etc.
RATE OF DEMAND AND SUPPLY
The Japanese candlestick chart aid analysts to clearly observe the rate of asset demand and supply at a given time frame.
This happens by the formation of bullish and bearish candles with the bullish candle indicating an increase in demand against the supply and the bearish candle indicating a decrease in demand against the supply at a particular time.
OPENING AND CLOSING POINT OF AN ASSET
The Japanese candlestick chart also aids analysts in determining the opening and closing point of assets at a given time.
This makes it possible for analysts to know the point of formation of a new price and its closing point. This knowledge in turn makes it possible for analysts to clearly speculate the possible future price opening and closing points.
Adding to the above, the Japanese candlestick chart also provides good interphase on which indicators can be applied for proper speculation of possible price direction.
It also provides information on market direction for analysts by them carefully observing its trend mostly by applying a trendline on it.
Nevertheless, it also shows the point of breakouts thereby signalling traders on the possible price reversal.
QUESTION 1c
c) Describe a bullish and a bearish candle. Also, explain its anatomy. (Original screenshot required)
BULLISH CANDLE
The bullish candle is a type of Japanese candlestick which indicates a high demand on a particular asset at a given period of time.
This type of candlestick opens immediately after the close of the preceding candle and closes above the open.
ANATOMY OF A BULLISH CANDLESTICK
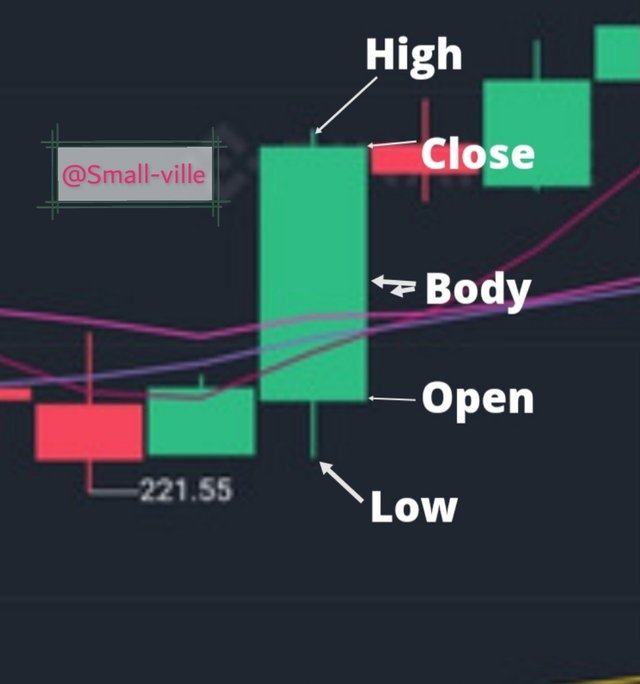
A bullish candlestick has a body which is made up of four parts namely;
- The High
- The Low
- The Open
- The Close
HIGH
The high is regarded as the upper shadow of a bullish candle. It is the maximum point attained by the candle.
In other, for an upper shadow to form, the bullish candle must close at a point below the maximum point attained and above the opening of the candle.
LOW
Similar to the high but opposite is the low of a bullish candle. This is the minimum point attained by a bullish candle.
OPEN
The open of a bullish candle is the point of formation of a new bullish candle immediately after the close a preceding candle.
It indicates the beginning of a new price movement at a given time frame and for a bullish candle, the open is always located below the close.
CLOSE
This is the point at which a bullish candle reaches before the formation of a new candle. For a bullish candle, the close is located above the open and sometimes below the high.
BEARISH CANDLE
A bearish candlestick is a type of candlestick that shows a very low demand for an asset at a given time. It shows that there are more sellers with little or no buyers at a particular time. It opens just after the close of the preceding candle and closes below the open.
ANATOMY OF A BEARISH CANDLESTICK
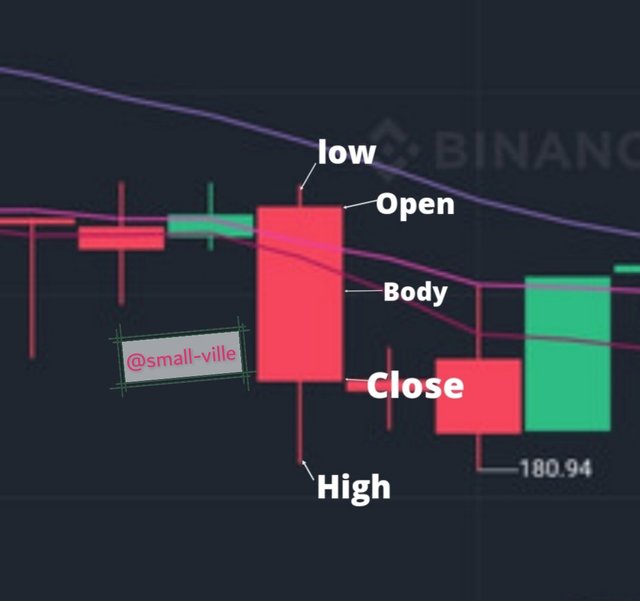
Similar to the bullish candlestick, the bearish candlestick is made up of four parts which includes;
- The High
- The Low
- The Open
- The Close
HIGH
The high of a bearish candle is the minimum downward point attained by the bearish candle before closing at a point above it. For a bearish candle, the high is located downward.
LOW
The low is the maximum upward point attained by a bearish candle before closing at a point below its open. For a bearish candle, the low is located upward.
OPEN
The opening of a bearish candle is the point at which a new bearish candle forms after the close of a preceding bullish or bearish candle. For a bearish candle, the open is always above the close.
CLOSE
The close of a bearish candle is the point at which a bearish candle is before the formation of a new candle.
For a bearish candle, this point is always located below the open.
CONCLUSION
The Japanese candlestick is a widely used chart pattern in the financial market. It serves both experts and newbies due to its easy to interpret body pattern which makes it easy for traders and analysts to interpret currently happenings in the market.
Nevertheless, it is not advisable to base only on the Japenese candlesticks pattern and formation in speculating the possible price movement of assets but a proper combination of other technical analysis tools will help to more accurately speculate market movement and directions.
