Steemit Crypto Academy | Course 2 By @stream4u| How To Read Candlestick Charts In Different Time Frame & Information about Buy-Sell(Support & Resistance) by @Slwzl
Conocer algunos tipos de gráficos empleados para el análisis de trading nos beneficia porque podemos tener mayores beneficios en nuestras inversiones y resguardo de cryptos.
Una de las herramientas de análisis financiero grafico son los “gráficos de velas”, estos son llamados así por su peculiar forma similar a las velas comunes, pero el principio de estos símbolos es mostrar puntos claves en los valores de una moneda o de un activo.
Un ejemplo es el siguiente:
Knowing some types of charts used for trading analysis benefits us because we can have higher profits in our investments and cryptos safeguard. One of the tools of financial graphical analysis are the "candlestick charts", these are so called because of their peculiar shape similar to common candlesticks, but the principle of these symbols is to show key points in the values of a currency or an asset.
Al hablar de puntos clave hacemos referencias al inicio de la colocación en el mercado, al punto de máximo valor, al punto de mínimo valor y a un punto de cierre, estos datos pueden obtenerse en periodos definidos.
Sólo para entender cómo se manejan los gráficos de vela haremos unos ejercicios poco probables, colocaremos la apertura, el techo, el suelo y el cierre con montos parecidos.
When talking about key points we refer to the beginning of the market placement, the point of maximum value, the point of minimum value and a closing point, these data can be obtained in defined periods. Just to understand how candlestick charts are handled we will do some unlikely exercises, we will place the open, the high, the low and the close with similar amounts.

Dentro del recuadro de la línea punteada observamos las velas con correspondencia a los valores 45, 55, 20 y 50 en cada apertura, el techo, el suelo y el cierre en las comparaciones.
Inside the dotted line box we observe the candles with matching values 45, 55, 20 and 50 in each opening, the ceiling, the floor and the close in the comparisons.

Ahora modifiquemos los valores de la gráfica para ver mejor las diferencias, con correspondencia de valores diferentes en cada una para la apertura, el techo, el suelo y el cierre en las comparaciones:
Now let's modify the values of the chart to better see the differences, with correspondence of different values in each for the open, the ceiling, the floor and the close in the comparisons:

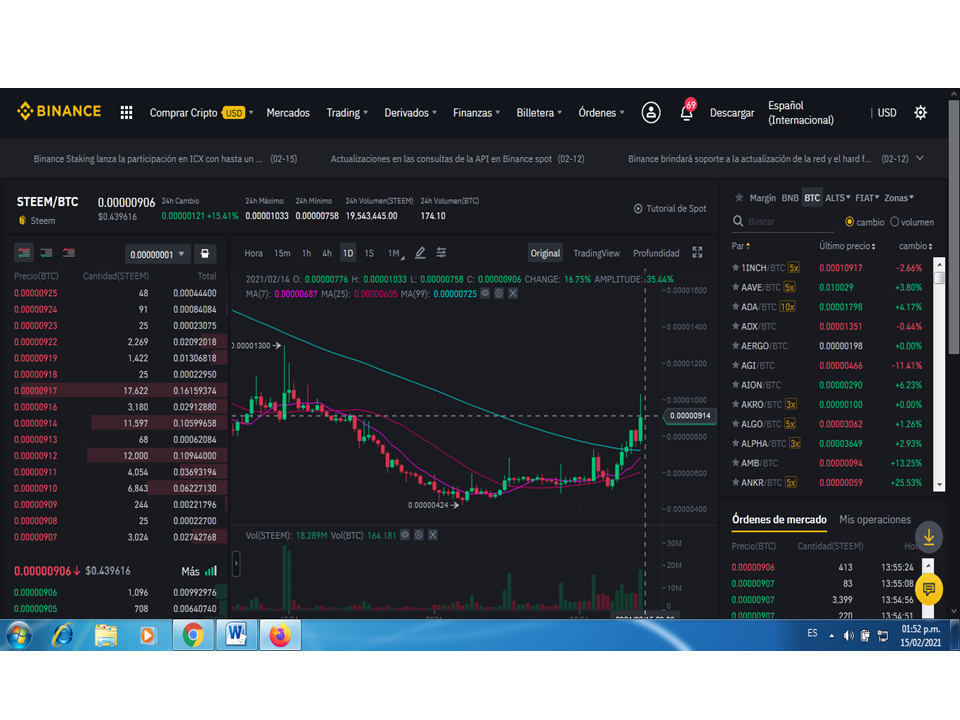
A continuación podemos observar un gráfico de vela tomado desde Binance donde se muestra el comportamiento del Steem con respecto al BTC, de allí que estudiar los detalles es importante para los que estamos aprendiendo a manejar nuestras billeteras.
Below we can see a candlestick chart taken from Binance showing the behavior of Steem with respect to BTC, hence studying the details is important for those of us learning to manage our wallets.

Ahora bien los precios pueden variar y esto se debe a dos términos que también debemos intentar comprender en esta tarea, “soporte” y “resistencia”, estos términos tienen que ver con los intercambios entre los comparadores y vendedores.
Soportes y resistencias se refieren a los niveles del precio donde se mantienen os topes del valor de la crypto o del bien, está claro que esto es consecuencia de las tendencias alcistas o bajistas del mercado, cada vez que como inversionistas nos inclinamos a un extremo del mercado estamos sumando fuerzas en los soportes o resistencias de los vales.
En los gráficos de velas podemos observar los soportes y resistencias visualizando la línea de tendencia que cruza las velas. Como se muestra a continuación justo donde cortan los ejes de la cuadricula:
Now prices can vary and this is due to two terms that we must also try to understand in this task, "support" and "resistance", these terms have to do with the exchanges between comparators and sellers. Supports and resistances refer to the price levels where the crypto or asset value stops are maintained, it is clear that this is a consequence of the bullish or bearish market trends, every time as investors we lean to one extreme of the market we are adding forces in the supports or resistances of the vouchers. On candlestick charts we can observe the supports and resistances by visualizing the trend line that crosses the candlesticks. As shown below just where they cut the axes of the grid:

Partiendo de esa visualización nos inclinaremos por el mejor precio en nuestra transacción, pero debemos recordar que estos métodos no son infalibles y sólo con la práctica se mejora.
Starting from that visualization we will go for the best price in our transaction, but we must remember that these methods are not infallible and only with practice we improve.

Comenzaré por algunos detalles que me faltaron en la publicación…. Continuación….
¿Cuál es el significado de la vela Verde y Roja?
Las velas Rojas en un gráfico significan que baja el precio de la moneda o el activo que se esté estudiando en cuanto a un tiempo específico, a su ve las velas verdes identifican que aumenta el precio, de esta manera podemos contrarrestar alzas y bajas en los activos.
Ahora bien, para el siguiente punto el profesor solicitó explicar con el gráfico de velas, ¿cuáles son los marcos de tiempo disponibles que podemos establecer en el gráfico, y por qué es necesario cambiar el marco de tiempo de la vela?
La siguiente captura del visor Trading View muestra un grafico de velas con un tiempo fijado en cuatro horas (4 hrs), el cual es un tiempo prodencial para ver si el activo realmente está subiendo o bajando.
Note que la manito apunta el periodo de observación.

Muestre un gráfico de velas de un activo en particular en un marco de tiempo diferente y explique brevemente lo que ve en el gráfico, como qué tendencia vemos, cuáles son los niveles de precios.

Como muestra la gráfica se observan los topes máximos y mínimos señalados lo que da un intervalo prudencial para saber que el comportamiento es en alza. Y no recomiendan ir en contra del mercado. Es alcista cuando hace mínimos ascendentes. Mínimo y máximos ascendentes.
¿Qué tipo de operadores hay en el mercado, explique cómo funcionan?
Según la revisión documental existen principalmente dos tipos de mercados uno a corto plazo y otro a largo plazo.
Los mercados a corto plazo comprenden los movimientos que pueden desarrollarse en intervalos de horas o un día por ejemplo, este método es arriesgado pero los inversionistas tras un buen análisis podrían tener ventajas en poco tiempo.
Ahora bien, los mercados a largo plazo son aquellos que pueden esperar meses o incluso años con el fin de asegurar el aumento de los activos o cryptos.
Con estas respuestas se intenta complementar la tarea asignada por el profesor @tream4u. Gracias por su corrección y también gracias por el soporte a @steemcurator01 y @steemcurator02
I'll start with some details I missed in the publication.... Continued....
What is the meaning of the Green and Red candlestick?
Red candlesticks on a chart mean that the price of the currency or asset being studied is going down in terms of a specific time, while green candlesticks identify that the price is going up, so we can counteract ups and downs in the assets.
Now, for the next point the teacher asked to explain with the candlestick chart, what are the available time frames we can set on the chart, and why is it necessary to change the time frame of the candlestick?
The following screenshot of the Trading View shows a candlestick chart with a time frame set to four hours (4 hrs), which is an essential time to see if the asset is really going up or down.
Note that the little hand points to the observation period.
Show a candlestick chart of a particular asset on a different time frame and briefly explain what you see on the chart, such as what trend we see, what the price levels are.
As the chart shows you see the high and low tops and bottoms indicated which gives a prudent interval to know that the behavior is on the upside. And do not recommend going against the market. It is bullish when it makes rising lows. Rising lows and highs.
What types of traders are there in the market, explain how they work?
According to the documentary review there are mainly two types of markets, one short term and the other long term.
Short-term markets comprise movements that can develop in intervals of hours or a day for example, this method is risky but investors after a good analysis could have advantages in a short time.
Now, long-term markets are those that can wait for months or even years in order to ensure the rise of assets or cryptos.
With these answers we are trying to complement the homework assigned by professor @tream4u. Thanks for your correction and also thanks for the support to @steemcurator01 and @steemcurator02.
❤
ALGUNAS BIBLIOGRAFIAS CONSULTADAS:
Cómo dibujar SOPORTES y RESISTENCIAS en trading
Guía sobre las Líneas de Tendencia
Translated with www.DeepL.com/Translator (free version)
Interesante, didáctico este trabajo de hoy, me sirve como referente para continuar aprendiendo. Felicitaciones lo lograste!
Muchas gracias amiga. Continuamos aprendiendo.