SteemitCryptoAcademy Season 2: Week 6 Homework (by @fendit) | Elliott Wave Theory
Hello, dear Steemit Crypto Academy members,
The Elliott Wave Theory, which has been used for many years in the financial markets, is an important tool that is also used in cryptoanalysis. Traders who trade in crypto markets need to know this theory. In order to analyze the market better, I decided to learn this theory in more detail. I would like to thank Professor for guiding our research on this subject.

Introduction
Various studies have been carried out to explain the future price movements of financial assets. It was discovered at the beginning of the 20th century that changes in market movements were not coincidental. Financial journalist Charles H. Dow has argued that it is possible to predict future price levels based on past price movements of assets. Ralph Nelson Elliott is one of those who study by being influenced by the Dow Theory. Ralph Nelson Elliott examined the price charts of many stocks traded on the New York Dow Jones Stock Exchange. Elliott found that fluctuations in prices recur regardless of time.
First, we will try to understand the applications of Elliott Wave Theory. Secondly, we will learn with an example in more detail. I thank Professor @fendit for choosing this topic.
A) Share your understanding of this lecture by answering the following questions:
1. What's the application of this theory?
R. N. Elliott found that price follows a cyclical movement and called this cyclical movement “wave”. Elliot defines this theory: “When one cycle is completed another cycle begins. Regardless of its size and duration, the rhythm of the new cycle will be the same as before.” According to the Wave Principle, human behavior fluctuates rhythmically between optimistic and pessimistic emotions. This theory suggests that market movements result from natural mass psychology. Patterns are created based on the current market sentiment ranging from bearish to bullish.
In order to apply the Wave Principle:
- Free determination of prices
- Availability of regular and measurable parameters in the market
- Having a large number of buyers and sellers.
Wave Theory, an important prediction mechanism used in the analysis of stock markets, divides market trends into sections and states that each section can be divided within itself.
Figure 1. Wave Notation
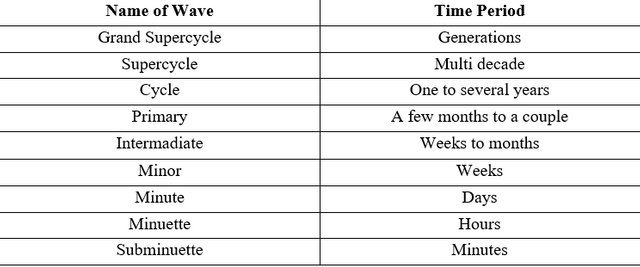
Source: https://elliottwavestockmarket.com/mweb/ewsm.wavenotation.pdf
R.N. Elliott said that securities charts are independent of time. He stated that the price movements in charts with annual data consist of charts with monthly, hourly, or daily data.
2. What are impulse and corrective waves? How can you easily spot the different waves?
Elliott Wave Cycles are composed of Impulse waves consisting of 5 sub-waves and Corrective waves moving in the opposite directions to them.
- Impulse Waves
The impulse is the waves that take the price to new peaks or new troughs. Properties of impulse waves;
• Waves 2 and 4 should not take back all waves 1 and 3.
• Wave number 3 should always rise above where wave number1 ends.
• Wave number 4 should never go down to the price level of wave 1.
• Wave number 3 should not be the shortest wave.
Figure 2. Impulse Waves
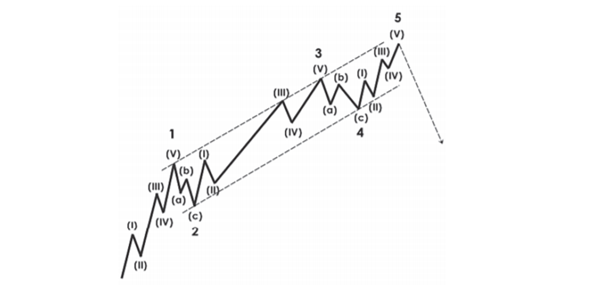
Source: https://www.kisa.link/OUHf
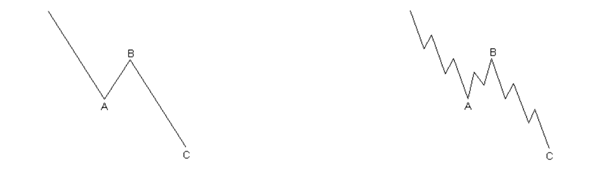
- Corrective Waves
Corrective waves move in the opposite direction. These waves are indicated by letters on the graphics. Corrective waves have internal structures different from impulsive waves.
Corrective waves can be specified under 4 headings. These:
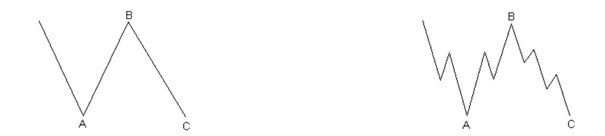
Zigzag Corrections (5-3-5)
A single zigzag in a bull market is a simple three-wave descending pattern labeled A-B-C and subdividing 5-3-5. The peak of wave B is significantly lower than the beginning of wave A, as shown in Figures 3.
Figure 3. Zigzag Correction
Flat Corrections (3-3-5)
A flat correction differs from a zigzag in that the subwave sequence is 3-3-5 as shown in Figures 4. The first action wave, wave A, lacks sufficient downward force to open up to exactly five waves as it were.
Figure 4. Flat Correction
Triangle Corrections (3-3-3-3)
The triangles look similar with five wave events dividing 3-3-3-3-3. They seem to reflect a balance of power that causes a sideways movement often associated with reduced volume and volatility.
Figure 5. Triangle Correction
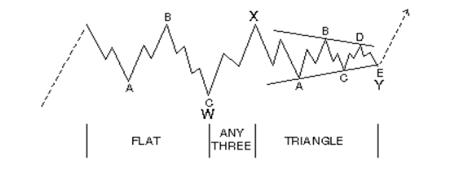
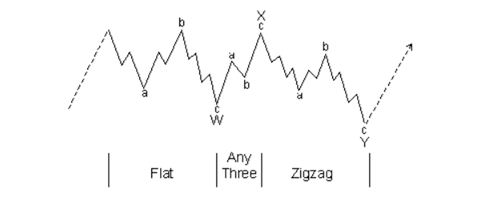
Combined Corrections
Elliott called the lateral combinations of corrective patterns "double triples" and "triple triples". While a single three is any zigzag or straight, a triangle is the last allowable component of such combinations and is referred to as "three" in this context.
Figure 6. Combined Corrections
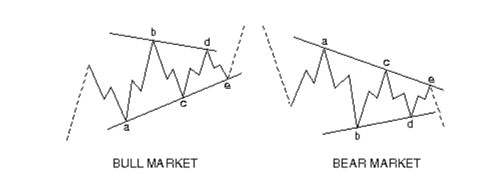
How can you easily spot the different waves?
Since every wave has a certain rule, the difference between waves can be determined easily. We can easily see this difference in the bull and bear market.
3. What are your thought on this theory? Why?
When I started researching Elliott Theory, I thought it was a necessary theory for financial markets. With this theory, I thought that the decisions made by the traders could be more profitable.
Anyone starting financial literacy should definitely learn this theory. There may be those who criticize this theory, but in my opinion, it is an important tool in checking the pulse of the market. Considering the interest in crypto markets in recent years, I understand the importance of this theory.
I think this theory, which has been used since the 20th century, has benefited many people and institutions. Thanks to this assignment, I had the chance to research in detail. I think I will take advantage of this theory when trading in the crypto market.
B) Choose a coinchart in which you were able to spot all impulse and correct waves and explain in detail what you see. Screenshots are required and make sure you name which cryptocurrency you're analyzing.
To answer this question, I studied several coins and decided to interpret the Litecoin chart. When I look at this chart for the first time, it can be clearly seen that there was an increase first and then a decline in the price.
Figure 7. Analyze Litecoin Graph
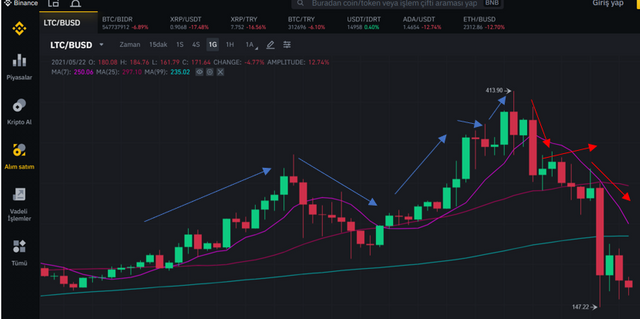
Since my technical drawing is insufficient, I will try to explain it to you with the arrows on the graphic.
- I chose blue arrows as an example of impulse waves. Red arrows are correction waves.
- The first, third, and fifth arrows are pointing up. The second and fourth arrows show a downward trend.
- The first and third correction arrows are downward. The second arrow indicates an uptrend.
Conclusion
Elliott Wave Theory argues that people are under the influence of their emotions. According to this theory, rhythmic movement in prices follows the same trend regardless of time. In this context, determining the pattern followed by the price makes it possible to estimate the future price. Elliott Theory is an important tool of financial markets with these features. In this context, traders in the crypto market need to know this theory. This theory is important nowadays with the transition between bear and bull markets.
CC:
@fendit
Thank you for being part of my lecture and completing the task!
My comments:
Your work was fine, but your answers were too simple in some parts. The only one that was really good was the theory, but when it c omes to your point of views or the analysis it was just too simple.
Overall score:
4/10
Thanks Madam,
Best Regards.