

Welcome guys,
Today I will be presenting my homework task for week number 4 of the season number 6. I have attended the lecture delivered by professor
@fredquantum on topic titled
Crypto Trading Strategy With Triangular Moving Average (TRIMA). Without much time wasted, lets get started.
1. What is your understanding of the TRIMA indicator?
One of the most used trend based indicator in the crypto market today is the moving average. This indicator is a lagging indicator which makes use of historical price data for it's calculation. There are many types of moving average indicator today, these indicators are built as an advancement upon the previous e.g SMA, EMA, TEMA etc. The TRIMA indicator is an advancement of the SMA indicator, when SMA indicator was developed, a lot of lapses was seen in the indicator such as lagging behind the price of an asset, reacting to price unnecessary thereby leading to false signal etc.
The TRIMA indicator was developed to solve this issues associated with the SMA. In it's development, it is design to have a more smooth and clear signal there by removing any form of noise from the market. The TRIMA indicator is a double average with a double smoothed interface and for that reason it reacts less to unnecessary price movement and it gives a more clear signal due to it's smoothness.
We know that crypto market are highly volatile and the only way we can minimize our losses and maximize our profit is by entering the market at the appropriate time and not entering the market anytime a price fluactuation surfaces. The TRIMA indicator can be use to help us as traders know when the signal for the market is real and when the signal is false. Though no indicator is 100% effective but the TRIMA indicator has proven to be a bit more reliable when it comes to giving a proper trading signal.
2. Setup a crypto chart with TRIMA. How is the calculation of TRIMA done? Give an illustration. (Screenshots required).
To set up a crypto chart with the TRIMA indicator, I will be using the tradingview platform to perform this task. Let's follow the basic steps below.
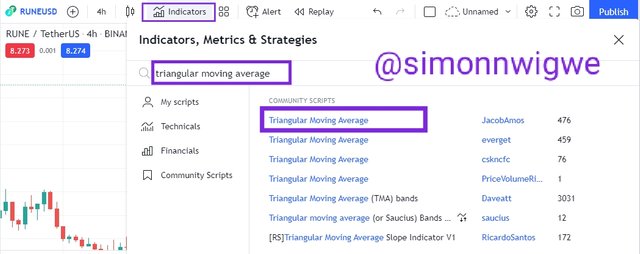
- Visit the tradingview.com official website by clicking on Tradingview.com, on the interface, click on chart menu and when the chart page loads, then click on indicator menu at the top of the page, a search bar will display then search for the name Triangular moving average and then click on it. Immediately, the indicator will be added to your chart see screenshots below
Source
Source
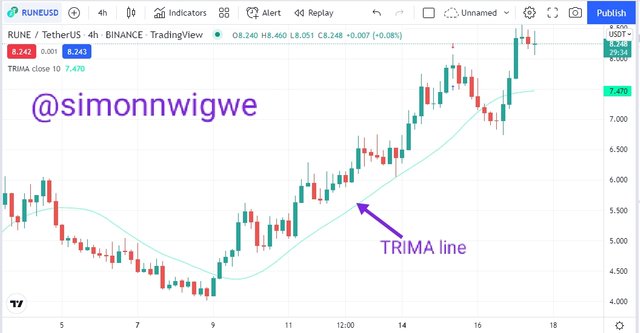
TRIMA indicator on a chart
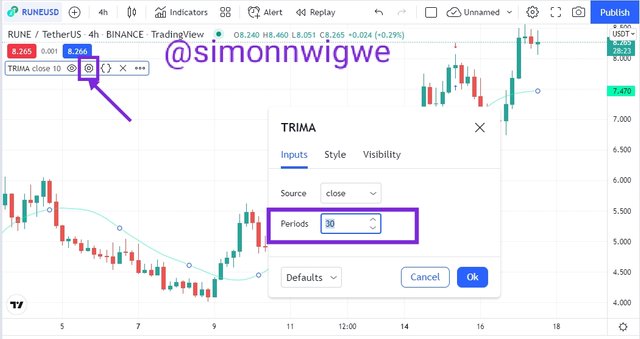
- To configure your chart, click on the settings icon by hovering over the name of the indicator and a pop up menu will display with headings Inputs, Style and Visibility. Here I will be changing the period settings to suit my trading strategy. See screenshot below.
Source
Calculations of TRIMA Indicator
Every indicator has a mathematical expression in which it is built on. The case of the TRIMA indicator is not an exception. The TRIMA indicator is calculated from the SMA as we have said above. This implies that to get the TRIMA value we need to get the values of SMAs first and then find it's averages to give us the TRIMA values. Mathematically it can be represented as
SMA = (P1 + P2 + P3 + P4 + P5...Pn) / n
Where
P = Price of asset
P1-5 = The price of asset over 5 periods
Pn = The last price
n = The number of periods under consideration
With this, we can then find the value of TRIMA by summoning the values of SMA and then getting it's average.
TRIMA = (SMA1 + SMA2 + SMA3 + SMA4... + SMAn) / n.
3. Identify uptrend and downtrend market conditions using TRIMA on separate charts.
Trend direction can be identified using the TRIMA indicator effective since the indicator is a trend based indicator. Every trader needs to identify the trend of the market before taking any position. To use the TRIMA indicator for either long term or short term trading, the trader has to select a suitable period that will fit into his or her trading strategy. For short term traders a less period is required with less timeframe and for long term traders a higher period with higher timeframe is required.
Uptrend Identification
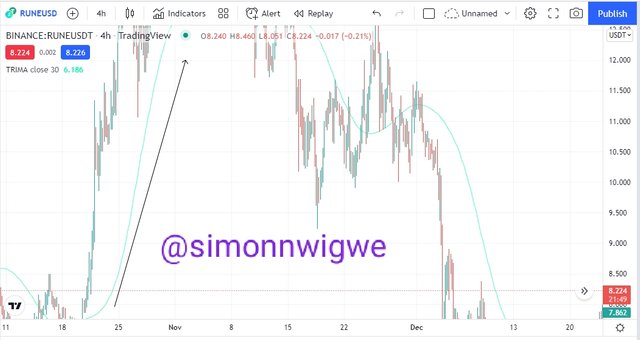
Just like every other moving average indicator, when the price of the asset is moving in an upward direction I.e when price is making consistent higher high and higher low movement, the TRIMA indicator will be seen below the price action and that implies that the price at that point is in uptrend. Let's consider the chart below.
Source
From the chart above, the price of the asset is seen moving above the TRIMA indicator and that is a sign that the asset is in an uptrend. Here the TRIMA indicator as a dynamic support to the price action.
Downtrend Identification
Just like every other moving average indicator, when the price of the asset is moving in a downward direction I.e when price is making consistent lower low and lower high movement, the TRIMA indicator will be seen above the price action and that implies that the price at that point is in downtrend. Let's consider the chart below.
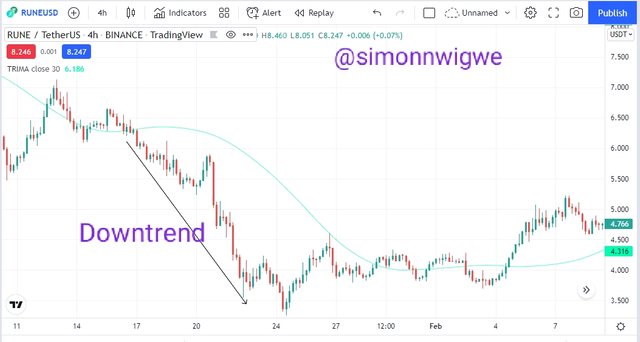
Source
From the chart above, the price of the asset is seen moving below the TRIMA indicator and that is a sign that the asset is in a downtrend. Here the TRIMA indicator as a dynamic resistance to the price action.
4. With your knowledge of dynamic support and resistance, show TRIMA acting like one. And show TRIMA movement in a consolidating market. (Screenshots required).
The levels of support and resistance are always taken into consideration by traders as this points are points where traders take their profit and also stop their losses when ever they are entering into a position. Ideally for a buy entry, it is normally done at the level of support and the take profit set above resistance level whereas the stop loss is set a little below the support level. In the same way, for a sell entry, it is normally done at the level of resistance and the take profit set below support level whereas the stop loss is set a little above the resistance level.
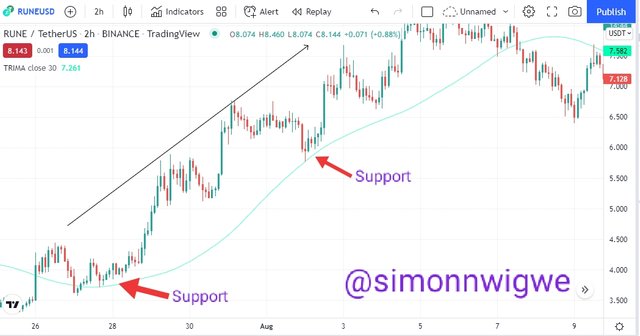
Dynamic Support Using TRIMA
The dynamic support is usually seen when the price of the asset is in an uptrend direction. During this movement, the price of the asset normally finds it's support at the TRIMA line when the price of the asset is retracing. When this retracement happens, the price then reverse and move in an upward direction I.e the direction of the initial trend. Let's consider the chart below.
Source
As we can see clearly, the dynamic support is seen by the TRIMA indicator. When ever the price hits the support level, it will move back to an upward direction.
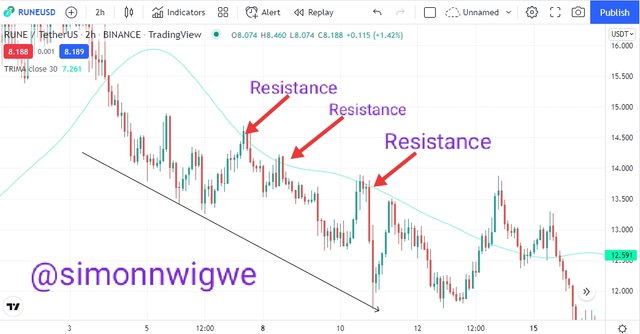
Dynamic Resistance Using TRIMA
The dynamic resistance is usually seen when the price of the asset is in a downward direction. During this movement, the price of the asset normally finds it's resistance at the TRIMA line when the price of the asset is retracing. When this retracement happens, the price then reverse and move in a downward direction I.e the direction of the initial trend. Let's consider the chart below.
Source
As we can see clearly, the dynamic resistance is seen by the TRIMA indicator. When ever the price hits the resistance level, it will move back to a downward direction.
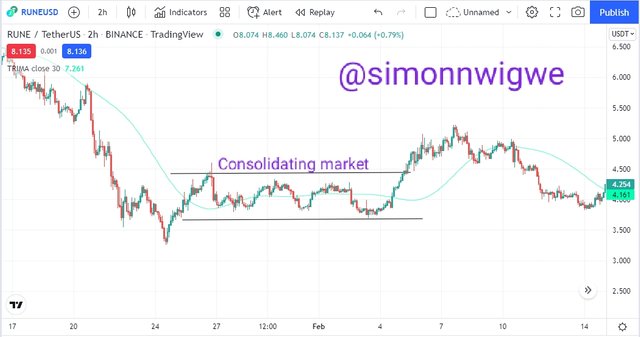
Consolidating Market Using TRIMA
The consolidating market or a sideways or a range market is a market in which the price of the asset does not have a specified direction. Here we experience a horizontal support and resistance as price moves up and down. From the law of demand and supply of an asset, they demand and supply of asset at this stage is said to be in equilibrium. The TRIMA line here is usually seen at the middle of the price implying that both demand and supply are equal. Let's consider the chart below.
Source
As we can see clearly, in the consolidating market the TRIMA indicator is seen between the price action as the price moves up and down between the levels of horizontal support and resistance.
5. Combine two TRIMAs and indicate how to identify buy/sell positions through crossovers. Note: Use another period combination other than the one used in the lecture, explain your choice of the period. (Screenshots required).
The combination of two TRIMAs indicators of different period on a chart can help traders to take a position either buy or sell entry in the uptrend and downtrend respectively via the process of crossover. The TRIMA indicator filters false signal by lagging behind price action due to the double smoothed phase. Though because of this lagging nature, the indicator may give signal when the trend is about to end.
So for the TRIMA indicator to be used effectively, I will be applying both a slow period TRIMA indicator and a faster period TRIMA indicator. This will help to solve the issue of the lagging. When ever there is a cross between these two indicators, a position for either buy or sell will be taken.
Here I will be using periods 12 and 30 for both slow and faster TRIMA respectively. The crossing between these two line will open for me a position. Let's look at buy and sell scenario below.
Buy Entry Using TRIMA
For buy entry, the asset must be moving in an upward direction. The shorter period of the TRIMA indicator must also cross above the faster period of the TRIMA indicator. When this is notice, it is an indication that the trend has reverse from it's initial bearish trend to a bullish trend. Immediate after the crossover, a buy entry can be taken with a proper risk management. Let's consider the screenshot below
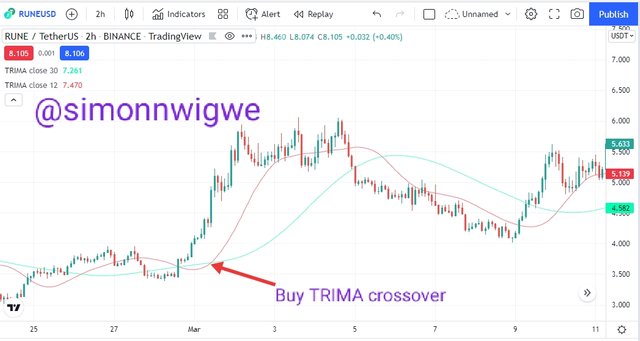
Source
From that chart above, the slower period TRIMA line is seen crossing above the faster period TRIMA line. From the chart we can see series of higher high and higher low form as the trend moves in upward direction.
Sell Entry Using TRIMA
For sell entry, the asset must be moving in a downward direction. The faster period of the TRIMA indicator must also cross above the slower period of the TRIMA indicator. When this is notice, it is an indication that the trend has reverse from it's initial bullish trend to a bearish trend. Immediate after the crossover, a sell entry can be taken with a proper risk management. Let's consider the screenshot below
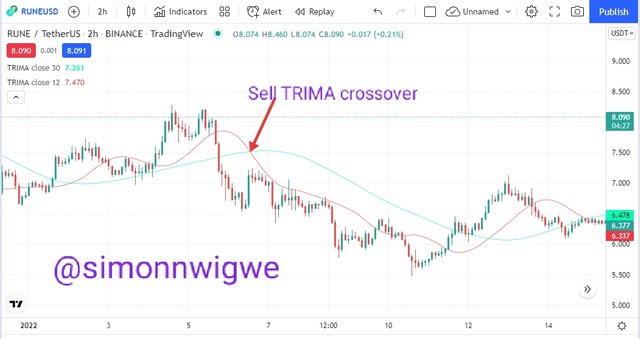
Source
From that chart above, the faster period TRIMA line is seen crossing above the slower period TRIMA line. From the chart we can see series of lower low and lower high form as the trend moves in downward direction.
6. What are the conditions that must be satisfied to trade reversals using TRIMA combining RSI? Show the chart analysis. What other momentum indicators can be used to confirm TRIMA crossovers? Show examples on the chart. (Screenshots required).
The TRIMA indicator as we have stated previously is a lagging indicator and to spot reversal of a trend we need to combine the TRIMA indicator with a leading indicator so that traders don't enter the market when the trend has reverse already. In this section, we will be using the RSI indicator to spot the region of trend reversal on the chart. We know that the RSI indicator indicates points or region of oversold and overbought and this are possible trend reversal zones. The criteria for trading reversal using the TRIMA indicator are seen below.
Criteria for Trading Bullish Reversal using TRIMA
To successfully trade bullish reversal using the TRIMA indicator, the following criteria must be obeyed
Firstly you have to add two TRIMA indicator I.e a slow one and a fast one to the chart and also add an RSI indicator as well.
For a bullish reversal signal, you have to watch and be sure that the price enters the oversold region during a bearish movement or a consolidating movement.
Another confirmation is when the slower TRIMA line cross and move above the faster TRIMA line. When that happens we conclude that the price is now in an uptrend.
When all these confirmation has been done, wait for at least two bullish candle to surface on the chart the place your buy entry at that point.
A risk reward ratio of 1:1 or 1:2 is always recommended for such a trade. Place your stop loss above the dynamic support level and your take profit above the dynamic resistance level.
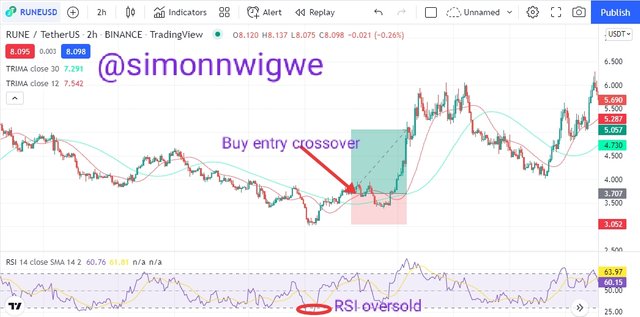
Source
From the above screenshot, the RSI indicator shows oversold which is a sign of trend reversal and also the slower TRIMA line cross and went above the faster TRIMA line as a confirmation of the trend moving from bearish to bullish trend. A buy entry was made after the formation of about two bullish candle.
Criteria for Trading Bearish Reversal using TRIMA
To successfully trade bearish reversal using the TRIMA indicator, the following criteria must be obeyed
Firstly you have to add two TRIMA indicator I.e a slow one and a fast one to the chart and also add an RSI indicator as well.
For a bearish reversal signal, you have to watch and be sure that the price enters the overbought region during a bullish movement or a consolidating movement.
Another confirmation is when the faster TRIMA line cross and move above the slower TRIMA line. When that happens we conclude that the price is now in a downtrend.
When all these confirmation has been done, wait for at least two bearish candle to surface on the chart then place your sell entry at that point.
A risk reward ratio of 1:1 or 1:2 is always recommended for such a trade. Place your stop loss above the dynamic resistance level and your take profit below the dynamic support level.
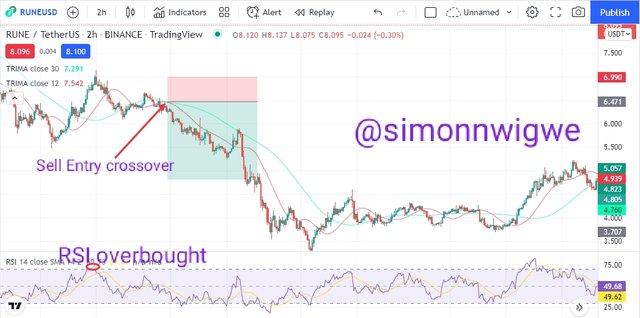
Source
From the above screenshot, the RSI indicator shows overbought which is a sign of trend reversal and also the faster TRIMA line cross and went above the slower TRIMA line as a confirmation of the trend moving from bullish to bearish trend. A sell entry was made after the formation of about two bearish candle.
Combination of MACD with TRIMA indicator to confirm Trend Reversals
Another momentum indicator that can be used along side the TRIMA indicator is the MACD indicator. This indicator is similar to the TRIMA indicator as it uses the method of crossing to identify trend reversal. Normally, the MACD indicator is made up of two EMA I.e the fast EMA and the slow EMA. When these EMA's crosses each other then a trend is said to reverse to the opposite direction.
Criteria for Trading Bullish Reversal using TRIMA and MACD
I add an EMA of lengths 12 and 30 for both slow and fast MACD as I have done in the case of the TRIMA indicator. Looking carefully to the screenshot below, you will notice the slower EMA crossing above the faster EMA, this is a sign of trend reversal. Lets consider the screenshot below.
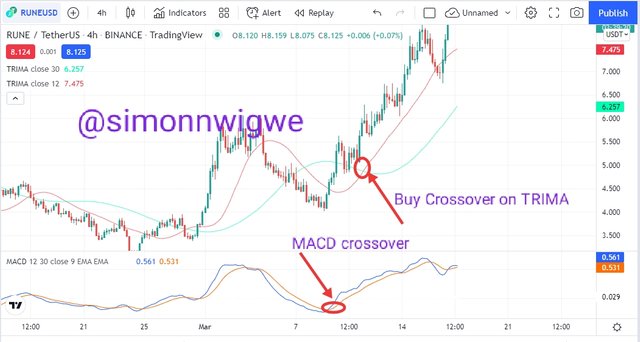
Source
From the chart above, you have seen the slower EMA in the MACD indicator crossing above the faster EMA which is a sign of trend reversal, a confirmation of this is seen when the slower TRIMA line crosses above the faster TRIMA line on the chart. Once these two confirmation are made, a buy entry position can be placed because the trend will definitely move in an upward direction.
Criteria for Trading Bearish Reversal using TRIMA and MACD
I add an EMA of lengths 10 and 20 for both slow and fast MACD as I have done in the case of the TRIMA indicator. Looking carefully to the screenshot below, you will notice the faster EMA crossing above the slower EMA, this is a sign of trend reversal. Lets consider the screenshot below.
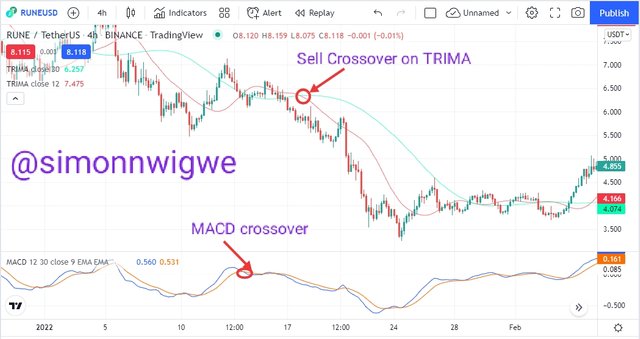
Source
From the chart above, you have seen the faster EMA in the MACD indicator crossing above the slower EMA which is a sign of trend reversal, a confirmation of this is seen when the faster TRIMA line crosses above the slower TRIMA line on the chart. Once these two confirmation are made, a sell entry position can be placed because the trend will definitely move in an upward direction.
7. Place a Demo and Real trade using the TRIMA reversal trading strategy (combine RSI). Ideally, bullish and bearish reversals. Utilize lower time frames with proper risk management. (Screenshots required).
I will be carrying out the analysis for both the demo trade and the real trade on tradingview.com platform. The execution of the demo trade will be done on my paper trading account in tradingview whereas the execution for the real trade will be done on my binance exchange platform.
Demo Trade
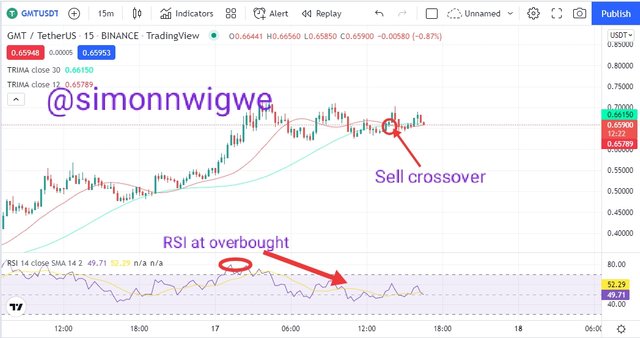
Source
From the chart above, a pair of GMTUSDT was trade on a 15 minutes timeframe. From the chart, the asset has reached it overbought region and a possible trend reversal is expected, and looking at the TRIMA indicator the faster TRIMA line is seen above the slower one which is a sign of bearish trend. I waited for a bearish candle to be formed before I entered my sell position. See screenshot below.
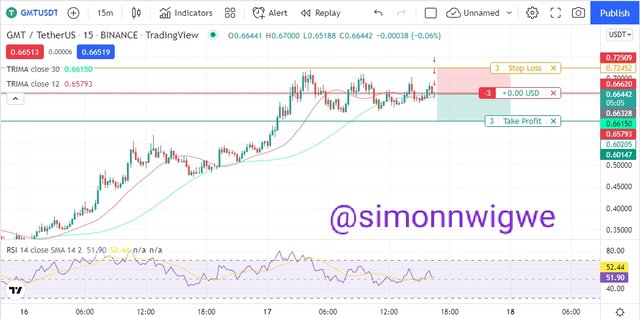
Source
After some minutes I checked my trade and I discovered that is moving downward as I have predicted. See proof of the profit made when I checked the trade.
Source
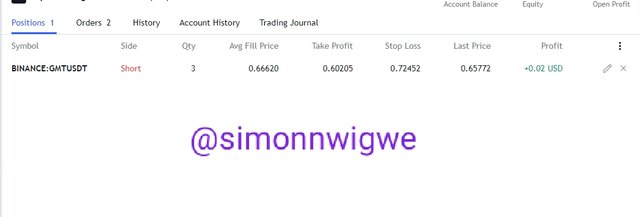
Real Trade
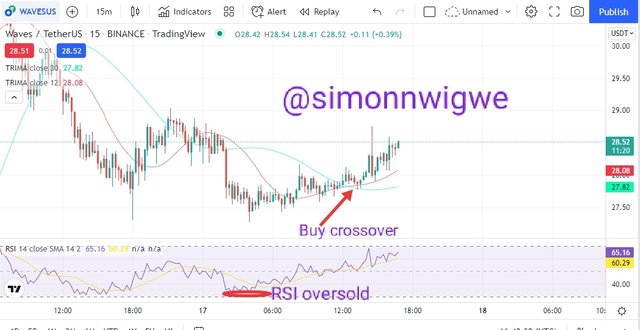
Source
From the chart above, a pair of WAVESUSDT was trade on a 15 minutes timeframe. From the chart, the asset has reached it oversold region and a possible trend reversal is expected, and looking at the TRIMA indicator the slower TRIMA line is seen above the faster one which is a sign of bullish trend. I waited for a bearish candle to be formed before I entered my sell position. See screenshot below.
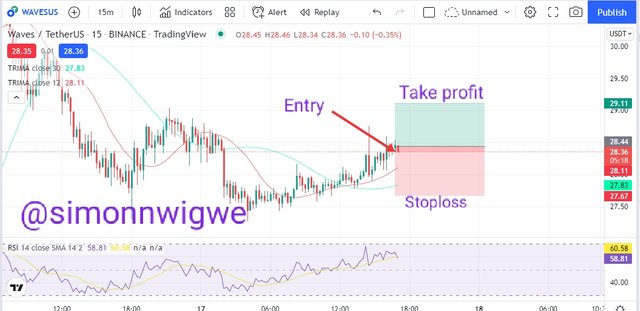
Source
After some minutes I checked my trade and I discovered that is moving upward as I have predicted. See proof of the profit level been hit and stoploss exipred when I checked the trade.
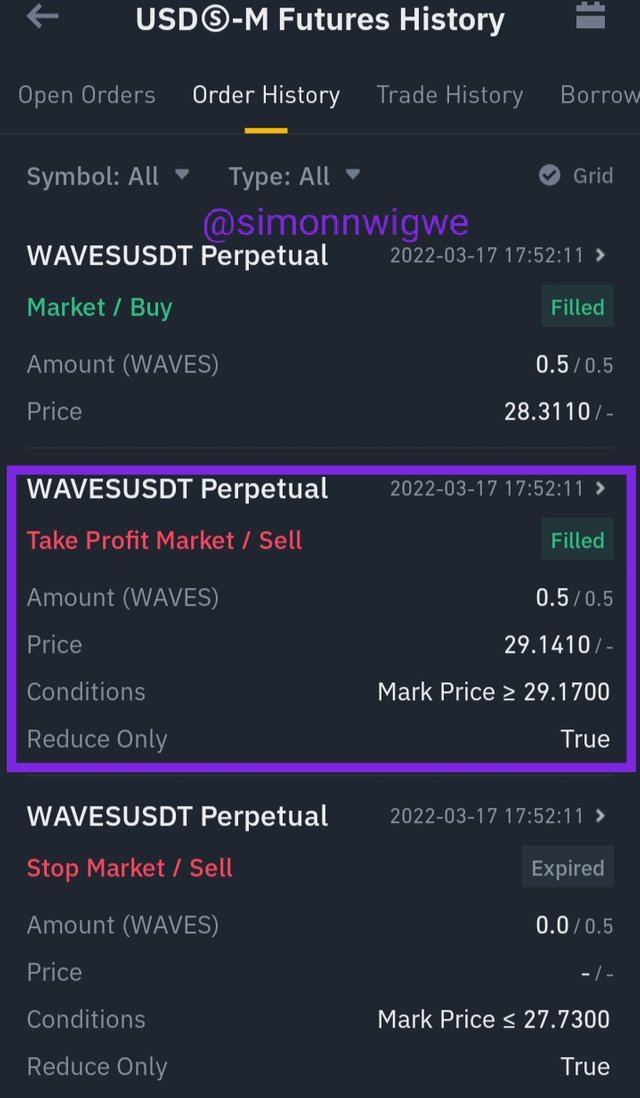
Source
8. What are the advantages and disadvantages of TRIMA Indicator?
Advantages of TRIMA indicator
The advantages associated with the TRIMA indicator are as follows
The indicator smoothings price fluctuation in the market there by removing noise or false signal from the market.
The signal generated by the TRIMA indicator is more clear when compared to other moving averages like the SMA.
Knowning how the moving average works, the TRIMA indicator can be used to identify the trend of the market by just looking at it position on the chart.
Positions are taken on a trade when ever there is a cross between the two TRIMA line. This is advantageous because the logic is easy to understand by all even newbies in the crypto world can relate to that.
Disadvantages of TRIMA indicator
The disadvantages associated with the TRIMA indicator are as follows
- The indicator is a lagging indicator which means a trend might have gone far before it will indicate it and this will make the traders to loss some important position in the market.
- TRIMA indicator like every other indicator can not be used as a stand alone tool to make a trading decision as there are tendency it will give false signal. So the indicator needs to be combined along side other indicator.
Conclusion
TRIMA indicator as we have seen is a trend based indicator which is an advance form of the SMA. The indicator is developed to solve the lapses associated with the SMA in terms of lagging and rough signal. The TRIMA indicator is a double smoothed indicator that gives a clear and more reliable signal about the market by removing noise which comes as a result of small fluactuation in the price of the asset. The indicator as we can see is use to spot points of support and resistance both in trending market and when the market is in range.
Though, despite how good this indicator may seem to be, it also has it's lapses and for that reason, it is advisable to always combine the indicator along side other technical indicator to filter out noise. Traders using this type of indicator should also put into consideration a proper risk reward ratio management of at least 1:1
Finally, I want to sincerely appreciate the professor in the person of
@fredquantum for such an insightful and educative lecture. Sir I do hope to continue learning more trading strategy from you as the academy progresses.
