Crypto Academy Week 12 - Homework Post for [@kouba01]
Introduction
My fellow steemians,
I am so delighted to be a part of these amazing program going on the steemit platform. Since these very program started I have really learnt a whole lot from the various professors. Sincerely this very program has help me to widen my knowledge on blockchain and crypto currency through the lectures delivered by the various professors and my research in carrying out the assignment task. Having attended the lecture delivered by our very own dear professor in the person of @kouba01, on the topic ''Cryptocurrency Trading with RSI", I am happy to present my homework task here, this is to prove or indicate my level of understanding concerning the class held by the professor. Please read through as you can learn a bit and also contribute to what I have written so far.
What is the Relative Strength Index - RSI and How is it Calculated?
RSI which stands for relative strength index is an indicator that is widely used in technical analysis to measure the force or the magnitude of the current price fluctuations of an asset, this is done to evaluate the price of the asset in question in terms of overbought or oversold situations. The RSI is in a form of a line graph which moves between two extreme ends and can be read from 0-100. It's important to mention here that in the year 1978 RSI was introduced by the developer of this amazing indicator in the person of J. Welles Wilder Jr.
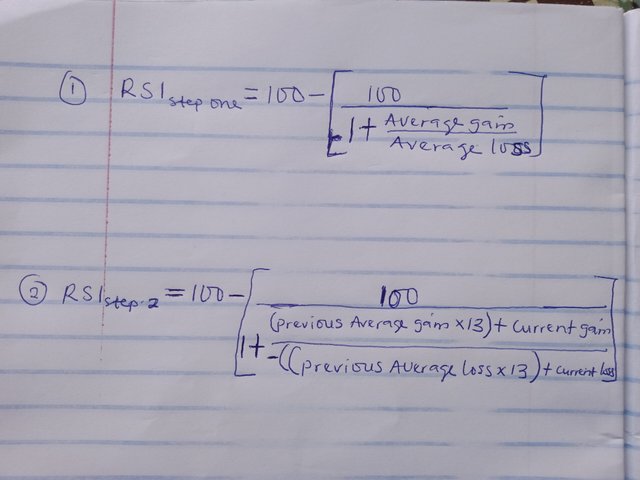
The relative strength index (RSI) is calculated with a two-part calculation as shown in the figure below. Although from the lecture we are given a different means for performing this calculations as a beginner but i have worked a bit to sort other means of carrying out the calculations. The figure shows both step one and two, a you need to do is to substitute your values and then get your answers. The standard is to use 14 days periods to calculate the initial RSI value.
Can we trust the RSI on cryptocurrency trading and why?
RSI can be trusted on crypto currency trading because from time immemorial it has proven to be a stop loss order indicator. As learnt in the lesson that RSI gives both early and false signals, then I can say that the tool can be trusted for crypto currency trading as the investor has no reason to be scared about loss. Every investor wants to harvest richly hence the RSI tool is the best to help such an investor attain his or her goal.
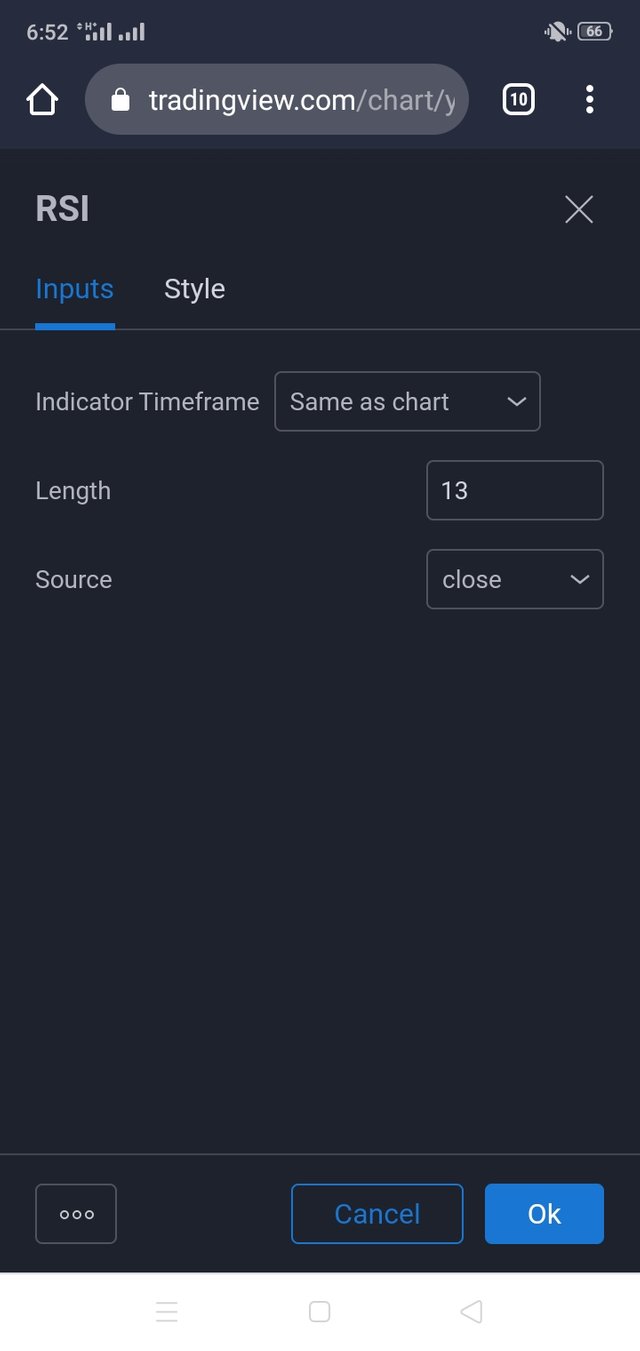
How do you configure the RSI indicator on the chart and what does the length parameter mean? Why is it equal to 14 by default? Can we change it? (Screen capture required)
The steps to configure RSI indicator is listed below
- click and add RSI to you trade as shown below
- secondly, click on setting as shown below
- thirdly, after clicking on setting, this shows up

Here is the input section which carries the length, source and indicator time frame.
- this is the style section
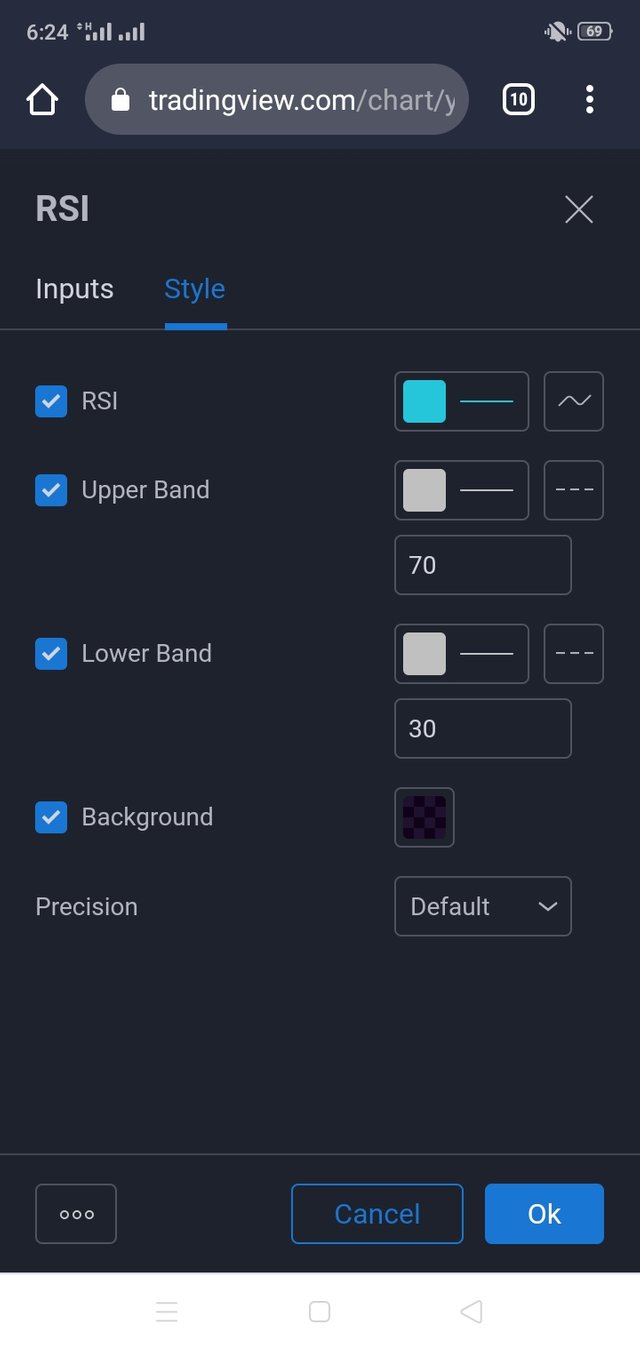
Length parameter is the number of days taken into consideration by the indicator to analyze it's average value. Defaultly, it is usually 14 because it captures just 14 days but can as well be altered or changed.
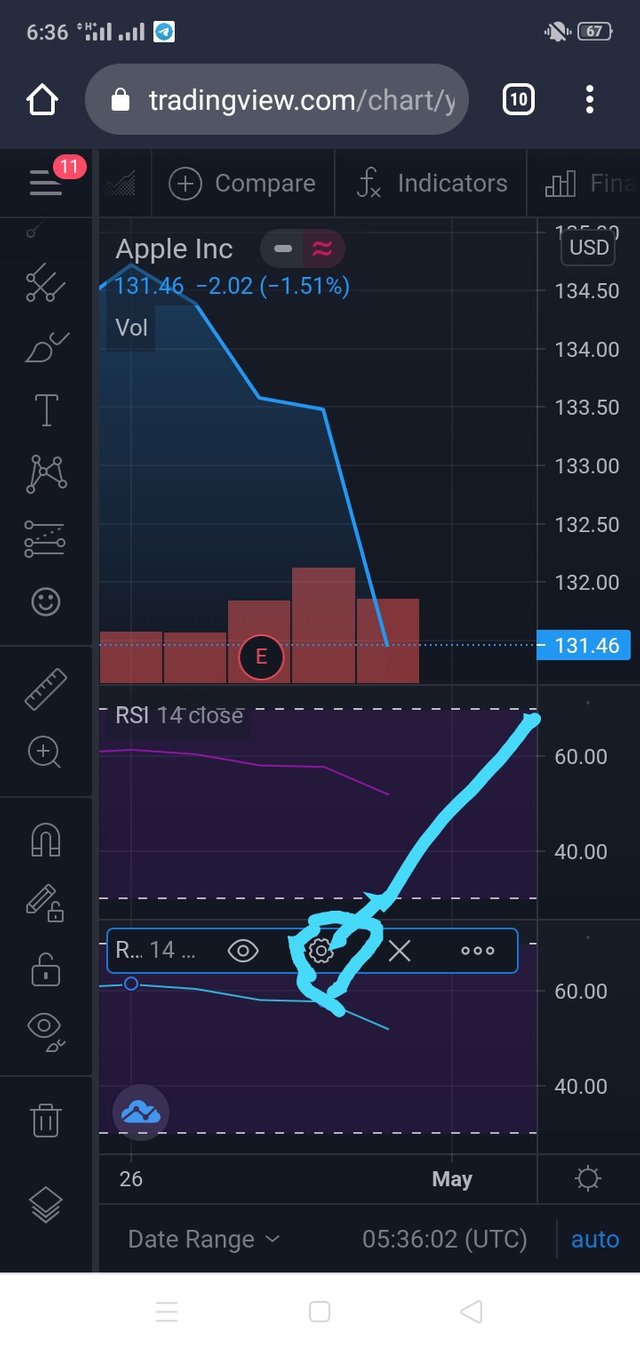
Showing a change in length
How do you interpret the overbought and oversold signals when trading cryptocurrencies? (Screen capture required)
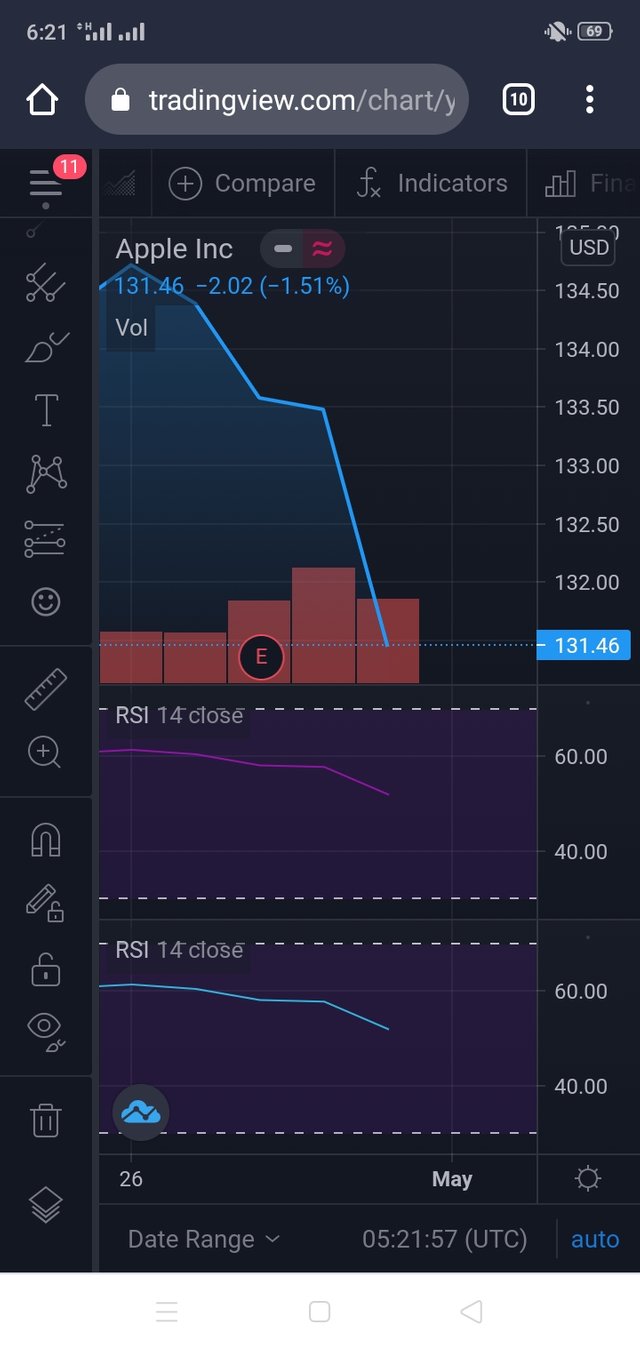
When using the RSI in trading, we have learnt that there are two major level on which cryptocurrency is expected to be in between I.e 30-70. If the price goes beyond 70 it is considered as overbought whereas if the price falls below 30 it is considered as oversold. The screenshot below shows both overbought and oversold.
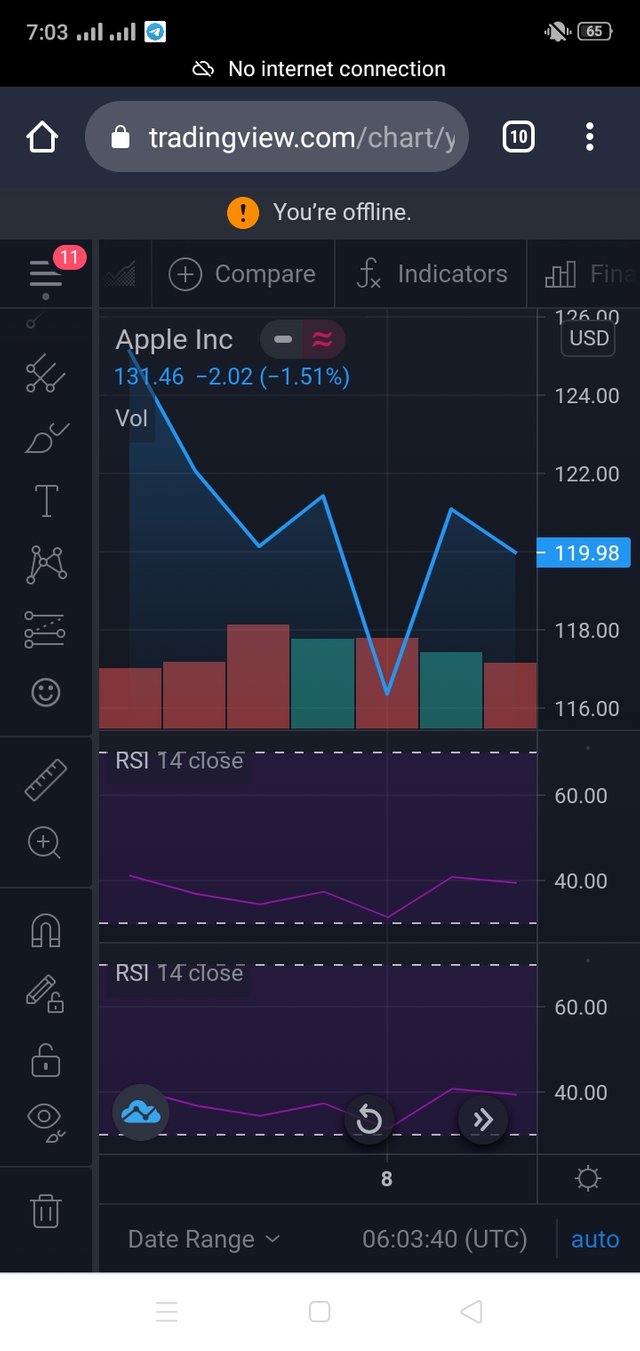
Oversold
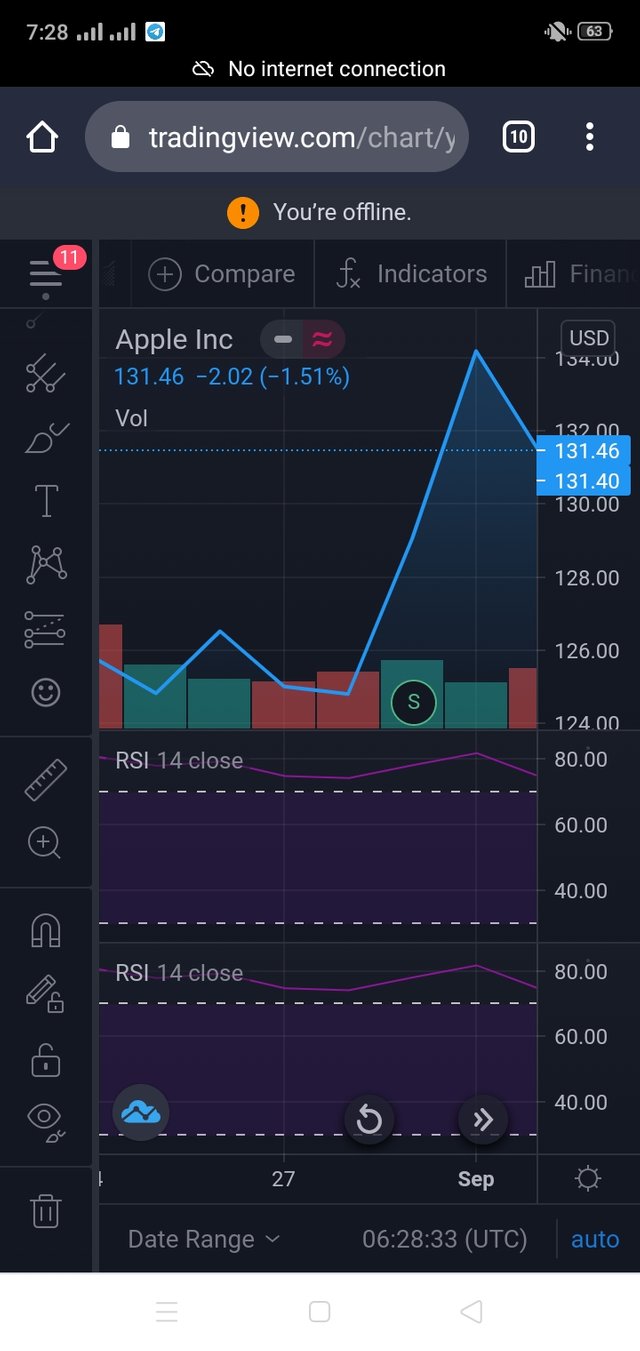
Overbought
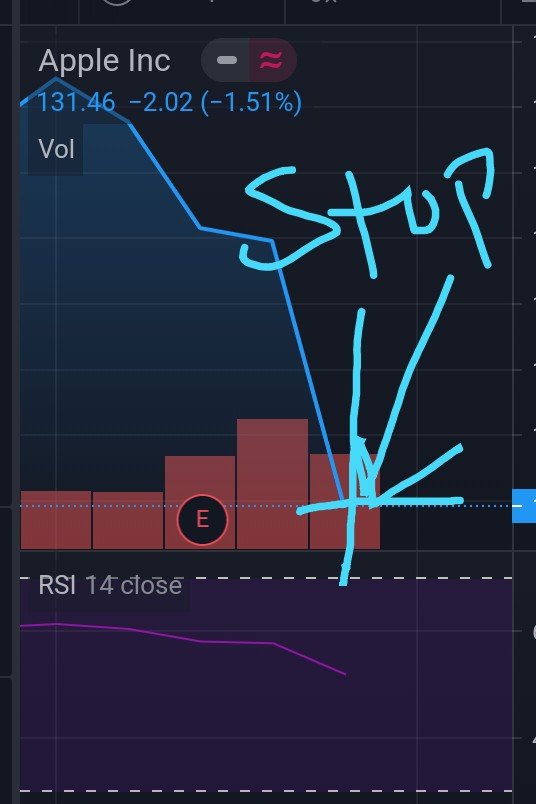
How do we filter RSI signals to distinguish and recognize true signals from false signals. (Screen capture required)
To filter RSI signals to distinguish and recognised true signals from false signals is by placing a stop loss order in your trading view and then watch how the market cap moves.
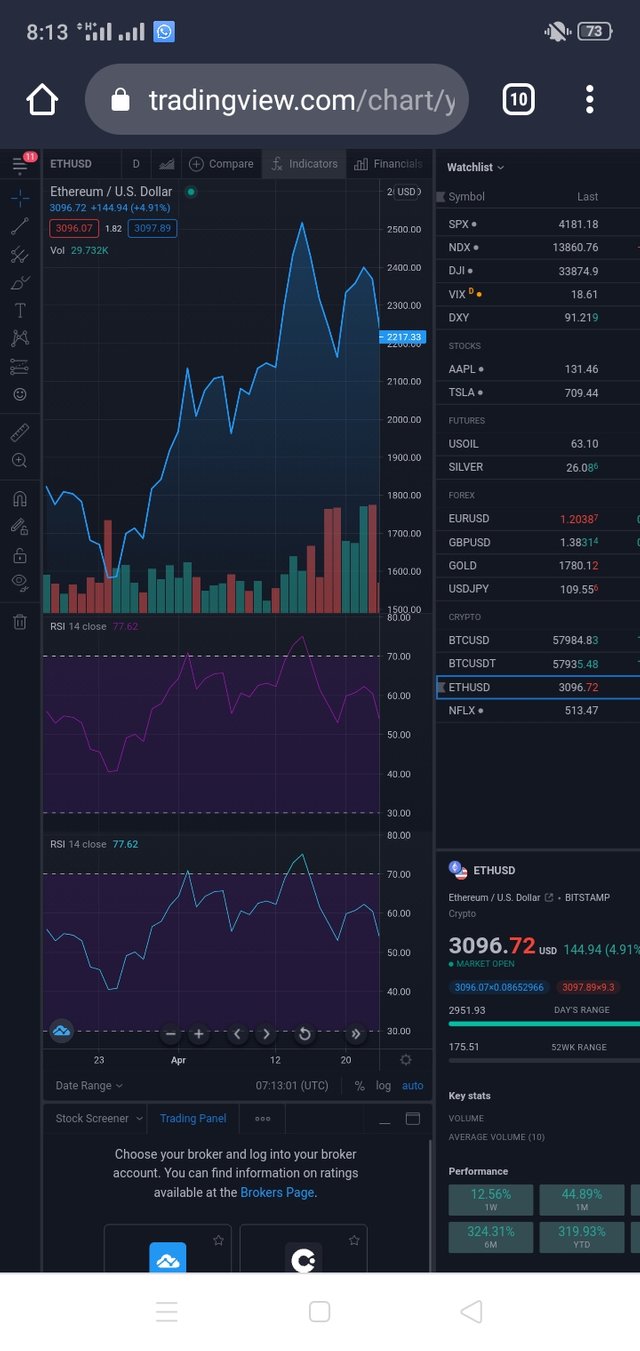
Review the chart of any pair (eg TRX / USD) and present the various signals from the RSI. (Screen capture required)
I will be reviewing the chart of EThereum and USD. The RSI graph below shows that both of which are in the level of overbought as the demand exceeds the supply. All of which are greater than 70 indicating overbought.
Conclusion
In conclusion, I must say I have really learnt a whole lot on this very lecture more also I believe this tool RSI will help me in no small way to excel in the crypto world. I look forward for such an amazing type of lecture once again.
Hello @simonnwigwe,
Thank you for participating in the 4th Week Crypto Course in its second season and for your efforts to complete the suggested tasks, you deserve a 6/10 rating, according to the following scale:
My review :
Acceptable work in which you have provided answers that indicate that you have learned RSI in a good percentage, and I have a few observations:
For the question:
You did not understand the question, you had to do more research because the answer is not found in the lesson, and I will answer it later so that all students have equal opportunities.
Regarding the last task, you had to identify several other signals on the chart to be a summary of what you learned from the lesson.
Thanks again for your effort, and we look forward to reading your next work.
Sincerely,@kouba01
Thanks prof.