Great minds,
Once again you are welcome to my blog. This past week has really been very educative here in the steemit crypto academy. New and very interesting lectures on crypto is all we see every new week here. I am so happy to be party of this great family. This week I attended a lecture delivered by professor
@kouba01 and he clearly explained the topic in a very simple and clear language. He talked about Trading Crypto with Ichimoku-kinko-hyo indicator part 2. At the beginning of this season he discussed part 1 of this topic.

Introduction
In part one of this lecture, the professor explained that the Ichimoku indicator is made up of 5 lines which are Senkou Span A, Senkou Span B, Tenkan-Sen, Kijun-Sen and lastly Chikou Span. The first two lines forms the Ichimoku cloud lines. Now it is important to state here that based on the different periods of these lines, they are calculated differently as well. They also helps to show areas of support as well as resistance on the market.

Question 1: Discuss your understanding of Kumo, as well as it's two lines (Screenshot required)
Kumo in Ichimoku-kinko-Hyo indicator is a part of the indicator that is made up of two lines namely Senkou Span A and Senkou Span B. The Senkou Span A and B is a shaded portion that is seen on the market when ever Ichimoku-kinko- Hyo indicator is applied on the chart. This shaded portion is what forms the cloud hence the name Ichimoku cloud. In terms of price movement to indicate the support and resistance on the chart, it is calculated 26 periods.
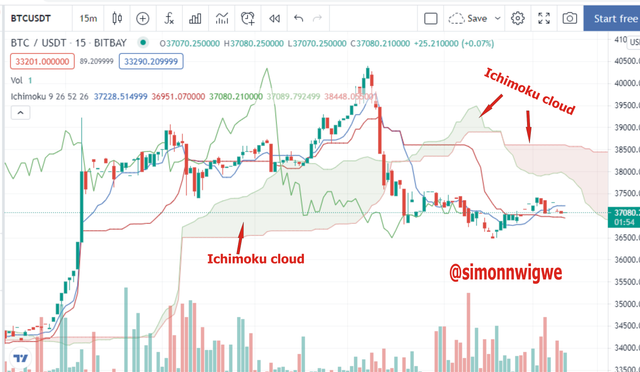
Ichimoku cloud lines
The Ichimoku cloud (Kumo) is use by traders to monitor price movement very easily. This is because by mere looking at the cloud movement you can be able to tell whether it is in bearish movement or a bullish movement. It also help them to know when to enter a trade and also when to exit the trade. The movement of markets can either be upward, downward or sideways and this is identify by the indicator as well.
Ichimoku cloud (kumo) in uptrend
When working with Ichimoku cloud (kumo) and the lines are moving in an upward direction, and at the same time, the lines are below the candlesticks we say it is an uptrend movement in the market. Note also, that in other to be pretty sure of this movement, you will notice the Senkou Span A line above the Senkou Span B line. Traders using this very strategy finds it helpful to identify the trend movement by mere looking at the two lines.
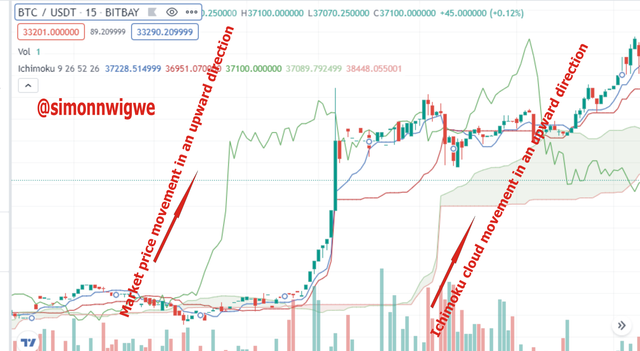
The Ichimoku cloud in an uptrend
Ichimoku cloud (kumo) in Downtrend
When working with Ichimoku cloud (kumo) and the lines are moving in an downward direction, and at the same time, the lines are above the candlesticks we say it is a downtrend movement in the market. Note also, that in other to be pretty sure of this movement, you will notice the Senkou Span B line above the Senkou Span A line. Traders using this very strategy finds it helpful to identify the trend movement by mere looking at the two lines.
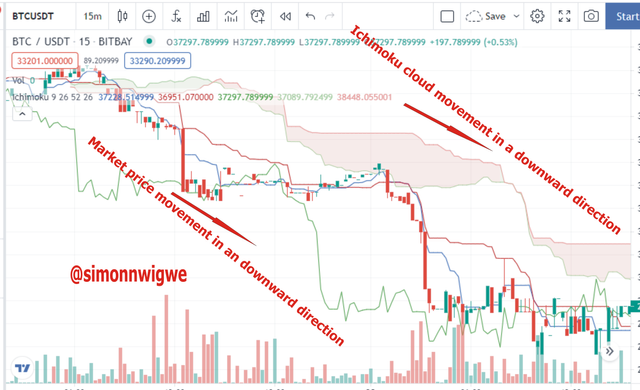
The Ichimoku cloud in a downtrend
Ichimoku cloud (kumo) in a Sideways
Here in this section there is no notable fluctuations between prices, you will notice price in a range without it going up or coming down. It implies that the market is neither in an uptrend movement or downtrend movement. Note also, that in other to be pretty sure of this movement, you will notice constant twisting in both lines of Senkou Span A and B respectively.
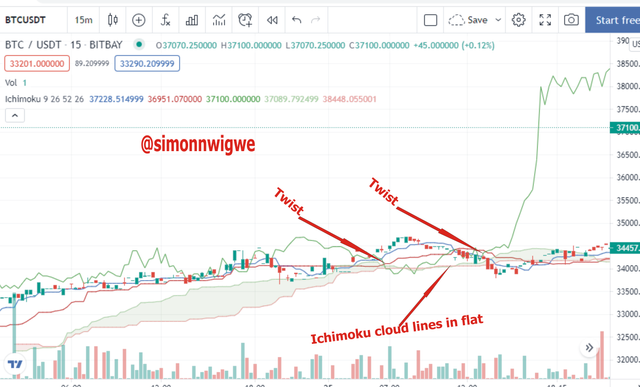
The Ichimoku cloud in a range
The Kumo (Ichimoku cloud) Lines
The kumo line is made up of two different lines as I have said ealier. This lines are the Senkou Span A line and the Senkou Span B line. A cloud is formed using this two lines. When this two lines crosses each other, there will be a change in the movement of price. Recall that I initially said that in the uptrend you will notice the Senkou Span A line above the Senkou Span B line and in the downtrend you will notice the Senkou Span B line above the Senkou Span A line and in the sideways you will notice constant twisting in both lines of Senkou Span A and B respectively.
The Senkou Span A
The Senkou Span A line is one of the lines that makes up the Ichimoku cloud or kumo. If the market price is moving upward, the Senkou Span A serves as a medium-term support and similarly, when the market price is going downward, the Senkou Span A serves as medium-term resistance. The Senkou Span A is plotted 26 periods in to the future. To calculate the Senkou Span A, add Tenken-Sen and the Kijun-Sen together and then divide it by 2.
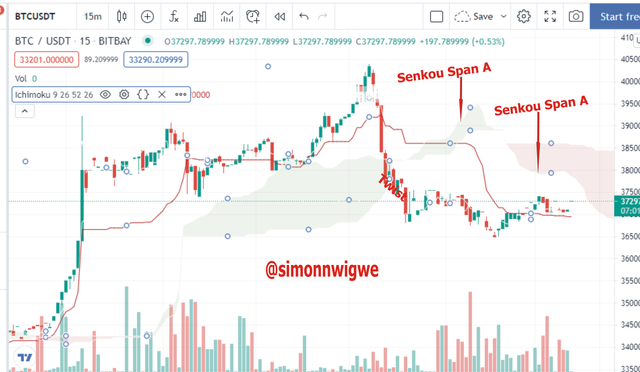
The Senkou Span A Line
The Senkou Span B
The Senkou Span B line is one of the lines that makes up the Ichimoku cloud or kumo. If the market price is moving upward, the Senkou Span B serves as a long-term support and similarly, when the market price is going downward, the Senkou Span B serves as long-term resistance. The Senkou Span B is plotted 26 periods as well. The Senkou Span B can be calculated by adding the highest price in a period of 52 candles and the lowest in same period of 52 candles divided by 2.
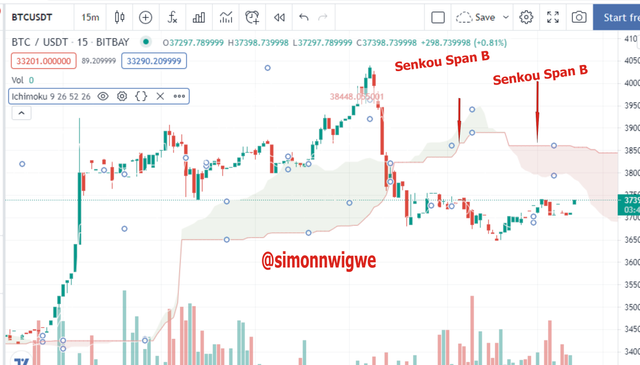
The Senkou Span B
Question 2: What is the relationship between this cloud and the price movement? And how do you determine resistance and support levels using Kumo? (Screenshot required)
Relationship between cloud and price movement are seen below.
The Ichimoku cloud is subject to price movement, that is if the price is either in medium-term or long-term. This is plotted using Senkou Span A and B.
Ichimoku cloud is plotted into the future starting from the current price. So it is projected ahead of price to determine how the market will look like in future.
The Ichimoku cloud shows the price movement direction of an asset, it also shows dynamic resistance and support level.
The Ichimoku cloud also shows the momentum of the price of an asset. In instances where we have small cloud and large cloud. The small cloud means small momentum in the price movement whereas the large cloud means high momentum in the price movement.
A little cloud has a higher tendency to experience a shift but in a large cloud the shift becomes very difficult.
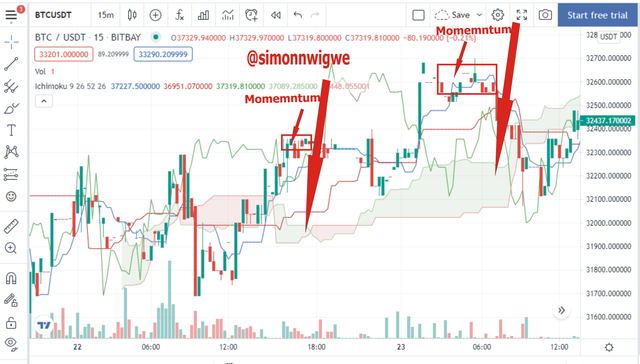
Ichimoku cloud indicating momentum
How do you determine resistance and support levels using Kumo?
In the case of resistance and support level when using Kumo, you will observe the price of an asset entering the cloud. If this happens, the Senkou Span lines both A and B will act as support and resistance this is because the price will try to react. The reaction of the price may be respecting, rejecting or breaking through the bounds of the lines.

From the screenshot above, I have indicated support and resistance level using the Ichimoku cloud. From the screenshot it shows that the support and resistance level is not seen as a single point but as a portion of an area.
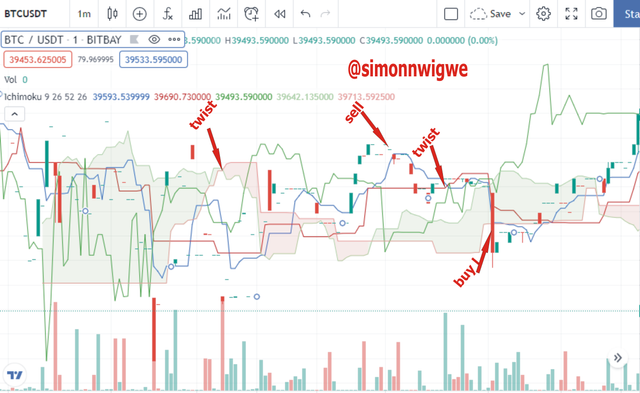
Question 3: How and why is the twist formed? And once we've "seen" the twist, how do we use it in our trading? (Screenshot required)
Briefly I will be explaining in a very clear terms how and why twist is formed in a chart when working with Ichimoku cloud. When the price of an asset is in a range, that is it is either upward or downward. This range of an asset results to the flat representation of the cloud line. Now the twist is formed as a result of the kumo lines crossing each other. When this incident happens there is always a change in the movement of price. In instances where this twist takes place after an uptrend or a downtrend it implies that the price is at it's resting position. After this resting position, the price will then move again.
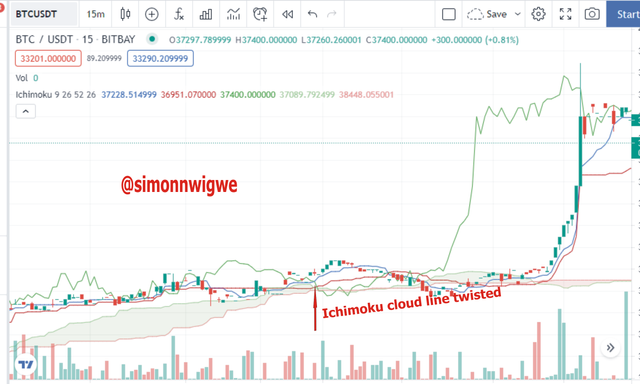
Ichimoku Twist
When this twist takes place it gives both buyers and seller an opportunity to enter into a trade in a certain level. You can notice this areas by seeing a bounded areas of either support or resistance and the fluctuation of prices within this areas. So traders get to buy at the level of support and also sell at the level of resistance.

Buy and Sell areas in a range
Question 4: What is the Ichimoku trend confirmation strategy with the cloud (Kumo)? And what are the signals that detect a trend reversal? (Screenshot required)

Ichimoku cloud confirmation trend movement
The screenshot above shows price movement using the Ichimoku cloud. There some strategy responsible for this price movement and below I will be listing few of this strategy that influence the price movement and how it is confirmed using the strategy. With the help of this strategy, they manner at which traders lose their asset has finally reduce.
The Ichimoku trend confirmation strategy with the cloud are as follows:-
If the direction of the cloud moves in the same directions as the market price it's a signal that that the price can be predicted in that direction and it has confirm the strategy. Twisting of lines alone dosn't confirm price movement.
Constant twisting of the Senkou Span lines indicate that the trend is at a range or sideways movement. There is no price movement either up or down in this point.
If the cloud moves in an upward direction, it's an indication that the price is bullish.
If the cloud moves in a downward direction, it's an indication that the price is bearish.
What are the signals that detect a trend reversal?
Here are few signals that detect trend reversal
One of the signals that detect trend reversal is the twist. I have earlier explained that for a market to change direction, there must be a crossing between the Ichimoku cloud lines. In the case of an uptrend movement of price, Senkou Span must cross Senko Span B. For downtrend, the Senkou Span B will have to cross the Senkou Span A. Though this is signal is combined with others to be sure before running into conclusion.
Another signal that is consider aside the twist is the price movement. If the price in the cloud is holding resistance, it is advisable for traders to wait and not go into trade because there is a tendency the may not know the actual movement of the asset from there.
The Chikou Span also help to detect trend reversal. If the line goes in same direction as the the price, then we can say it will continue in that manner but if the line moves in a separate direction it is indicating a trend reversal.
Another signal to consider is the direction of the cloud. That is the direction in which the cloud is going. If the cloud moves in either upward or downward direction, it confirms a trend reversal.

Ichimoku cloud in trend reversal
Question 5: Explain the trading strategy using the cloud and the chikou span together. (Screenshot required)
The trading strategy using the cloud and chikou span combine is really an amazing strategy because it gives a trader an average of insight of how the trade will go. Recall that the cloud project the future using a 26 period from the current price and the chikou span retrace backward for also a period of 26 from the current price. If the cloud and chikou span are use to trade it will indicate a very strong trend. When the move in same direction the trend is more reliable.
Chikou span and cloud lines in Uptrend
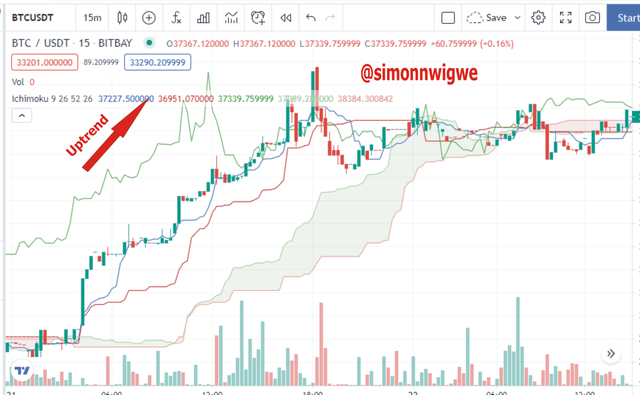
Chikou span and Cloud line in uptrend
The screenshot above shows a combination of Chikou Span and Cloud line in an upward direction indicating an uptrend. As you can see both moves in an upward direction. We earlier said that the Chikou span is retrace backward from the current price movement using a period of 26 whereas the cloud line compliment it by providing same for the future.
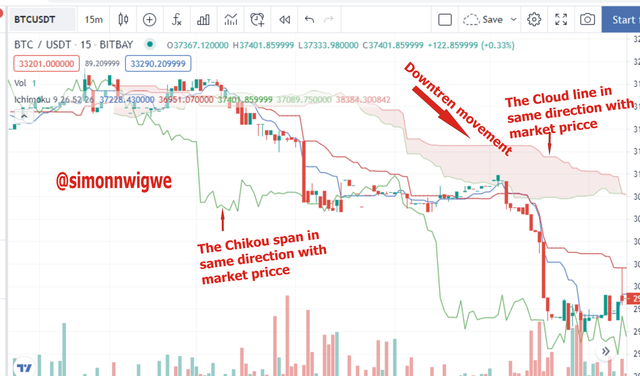
Chikou span and cloud lines in a downtrend

Chikou span band Cloud line in downtrend
The screenshot above shows a combination of Chikou Span and Cloud line in a downward direction indicating a downtrend. As you can see both moves in an downward direction. We earlier said that the Chikou span is retrace backward from the current price movement using a period of 26 whereas the cloud line compliment it by providing same for the future.
Chikou span and cloud lines in a range or sideways

Chikou span band Cloud line in a range
The screenshot above shows a combination of Chikou Span and Cloud line in a range or sideways. The sideways movement comes as a result of constant twisting. Because of this constant twist it result to the absence of trend in the market.
Question 6: Explain the use of the Ichimoku indicator for the scalping trading strategy. (Screenshot required)
In scalping trading, we talk about trades that uses very low time frame such as 1, 5, 30 minutes so as to make use of any available opportunity that shows up. The Ichimoku indicator can as well be use in this type of trading since the indicator is design for use in any time frame be it small or large time frame. So for this studies, let's use the 1 minutes time frame and check the scalping trade in uptrend, downtrend and sideways.
Ichimoku indicator in uptrend (1-minute chart)
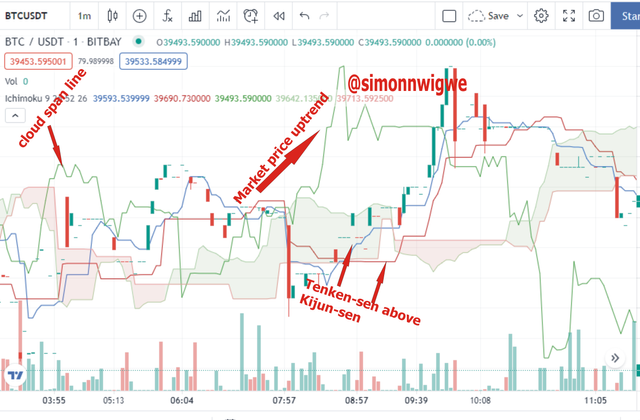
The screenshot above shows how Ichimoku indicator is use in scalp trading to indicate an upward movement of price in the market. Here in this stage the indicator moves in same direction so that scalp trade can be confirmed.
Trade confirmation
The upward movement of both the Chikou Span and cloud line indicates uptrend.
Tenken-Sen line standing above the Kijun-Sen line shows bullish trend.
Cloud lines moves in same directions with market trend and the Chikou span line.
Ichimoku indicator in downtrend (1-minute chart)
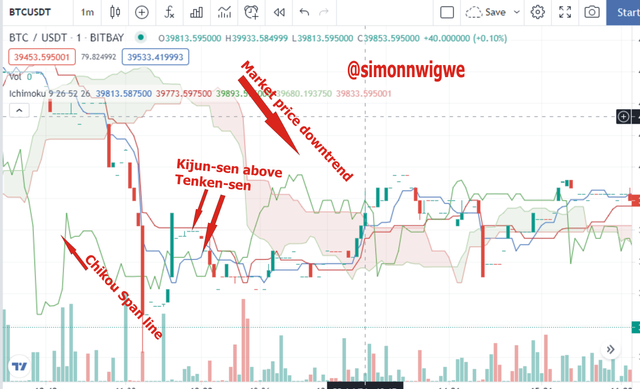
The screenshot above shows how Ichimoku indicator is use in scalp trading to indicate an downward movement of price in the market. Here in this stage the indicator moves in same direction so that scalp trade can be confirmed.
Trade confirmation
The downward movement of both the Chikou Span and cloud line indicates uptrend.
Cloud lines moves in same directions with market trend and the Chikou span line.
Kinun-Sen line above the Tenken-Sen line shows bearish trend.
Ichimoku indicator in a range (1-minute chart)
The screenshot above shows how Ichimoku indicator is use in scalp trading to indicate an range or sideways movement of price in the market. The indicator doesn't show any trend here because of the constant twisting. In this phase it is always recommended you buy at the support level and sell at the resistance level in other to make profit.
Conclusion
Any form of trade can use Ichimoku indicator since it allows usage of every time frame. For the usage of cloud lines in trading, it gives you a clear picture of the portion of support and resistance not just a point as I earlier explained. Note also, that when we combine Chikou span and cloud we get better result of analysis because both the future and past are taking into consideration.
I want to appreciate the professor
@kouba01, for such a wonderful lecture. I look forward to learning more from you as the Academy continuous.
Thanks for reading...
Hello @simonnwigwe,
Thank you for participating in the 5th Week Crypto Course in its third season and for your efforts to complete the suggested tasks, you deserve a 7.5/10 rating, according to the following scale:
My review :
Good content article in which you covered the topic in all its aspects where the answers were clear. I have some notes:
You interpreted well the KUMO cloud and its two lines, providing an organized and clear set of information.
In the second question, you did not delve into analyzing the relationship between price action momentum and the Ichimoku cloud, especially using Kumo Thickening. As well as for determining levels of support and resistance that differ from the traditional method.
Your interpretation of trading using the twist technique was not clear and did not address all possible cases.
You did better on the rest of the questions, as most of your answers involved more in-depth analysis.
Thanks again for your effort, and we look forward to reading your next work.
Sincerely,@kouba01
Thank you so much prof. For the review i will improve in the next task.
Congratulations! Your post has been selected as a daily Steemit truffle! It is listed on rank 20 of all contributions awarded today. You can find the TOP DAILY TRUFFLE PICKS HERE.
I upvoted your contribution because to my mind your post is at least 9 SBD worth and should receive 22 votes. It's now up to the lovely Steemit community to make this come true.
I am
TrufflePig, an Artificial Intelligence Bot that helps minnows and content curators using Machine Learning. If you are curious how I select content, you can find an explanation here!Have a nice day and sincerely yours,

TrufflePig