Crypto Academy / Season 3 / Week 1 - Homework Post for @kouba01

Hello guys,
I am so delighted to be among those participating in week number 1 of the crypto academy season 3 lectures. I have attended the lecture delivered by our very own professor in the person of @kouba01 on the topic Trading Crypto With Ichimoku-kinko-hyo Indicator - Part 1. After attending the lecture, I will be writing my assignment task based on my understanding of the lecture.
Question 1
What is the Ichimoku Kinko Hyo indicator? What are the different lines that make it up? (screenshots required)
Hosoda Goichi in 1930 developed this amazing indicator called Ichimoku Kinko Hyo, it is the best as at then because it was developed with the combination of many technical indicator as at then. Most importantly, when Ichimoku Kinko Hyo indicator was developed it worked alone without any other indicator assisting it. Unlike some other indicators, Ichimoku Kinko Hyo gives a more accurate result without been combined with others. Information provided by Ichimoku Kinko Hyo indicator include direction, momentum, support, and Resistance.
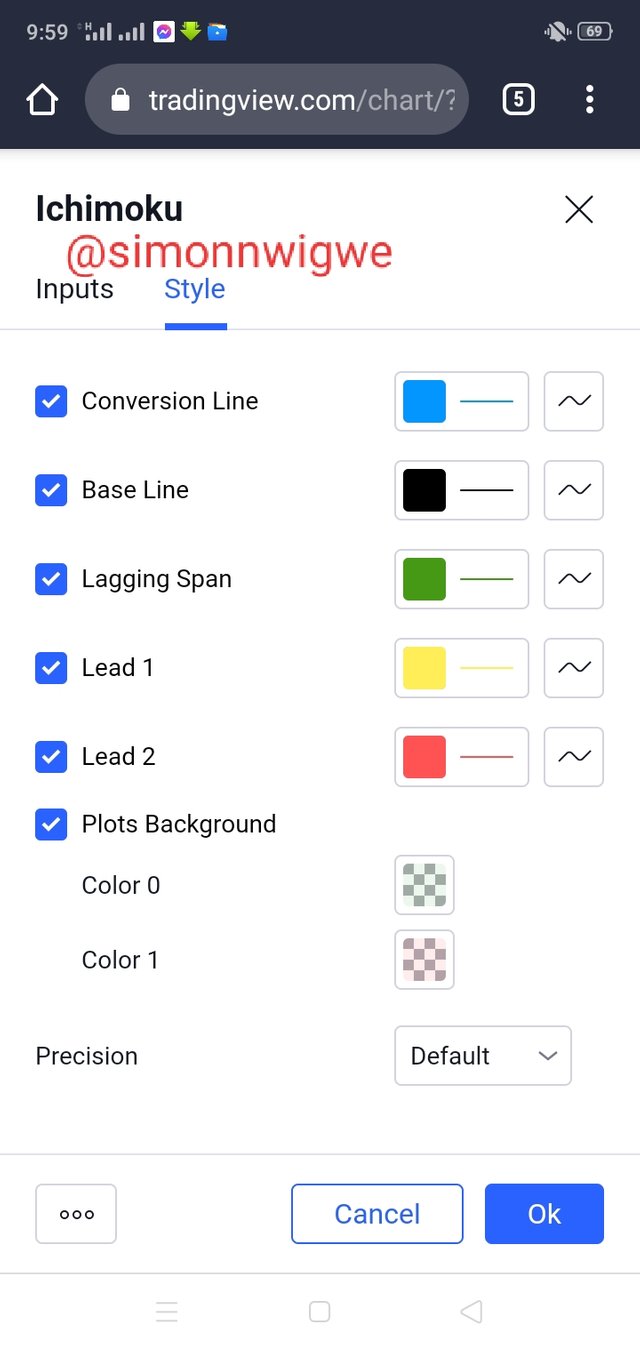
It is important to mention here that the Ichimoku indicator consists of 5 lines which is used to enhancing the results of the indicator. And this lines are listed and explained below:
| S/No. | Name | Explanation |
|---|---|---|
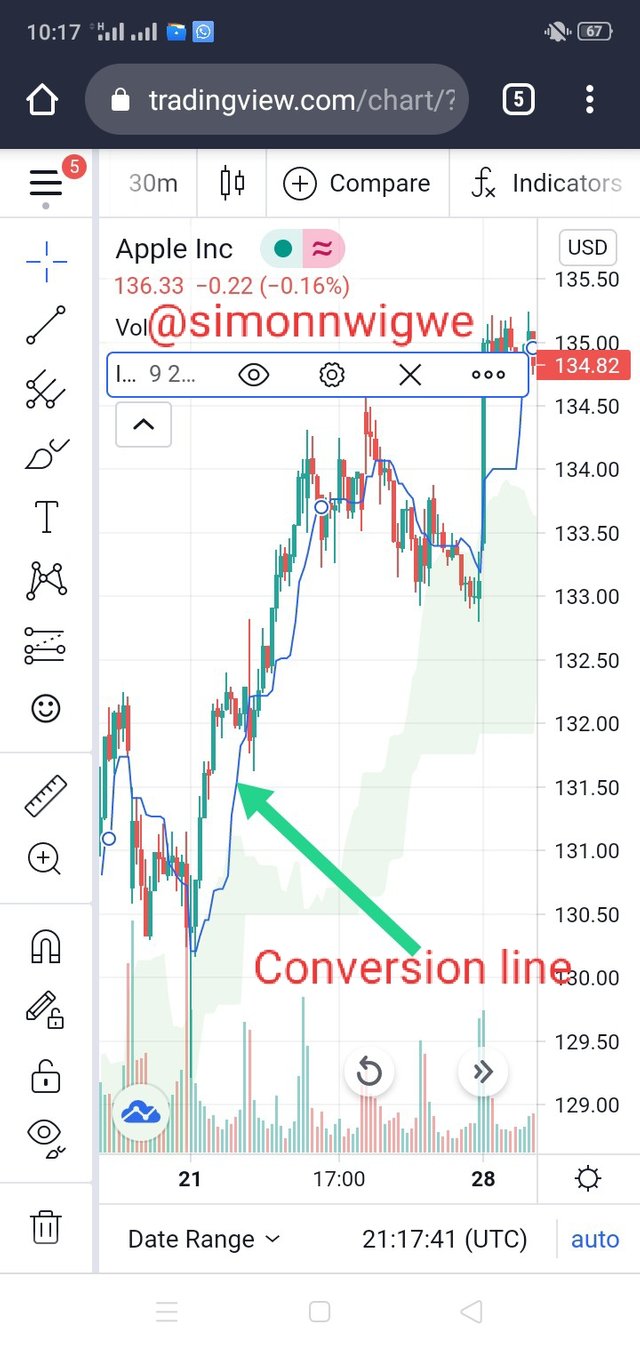
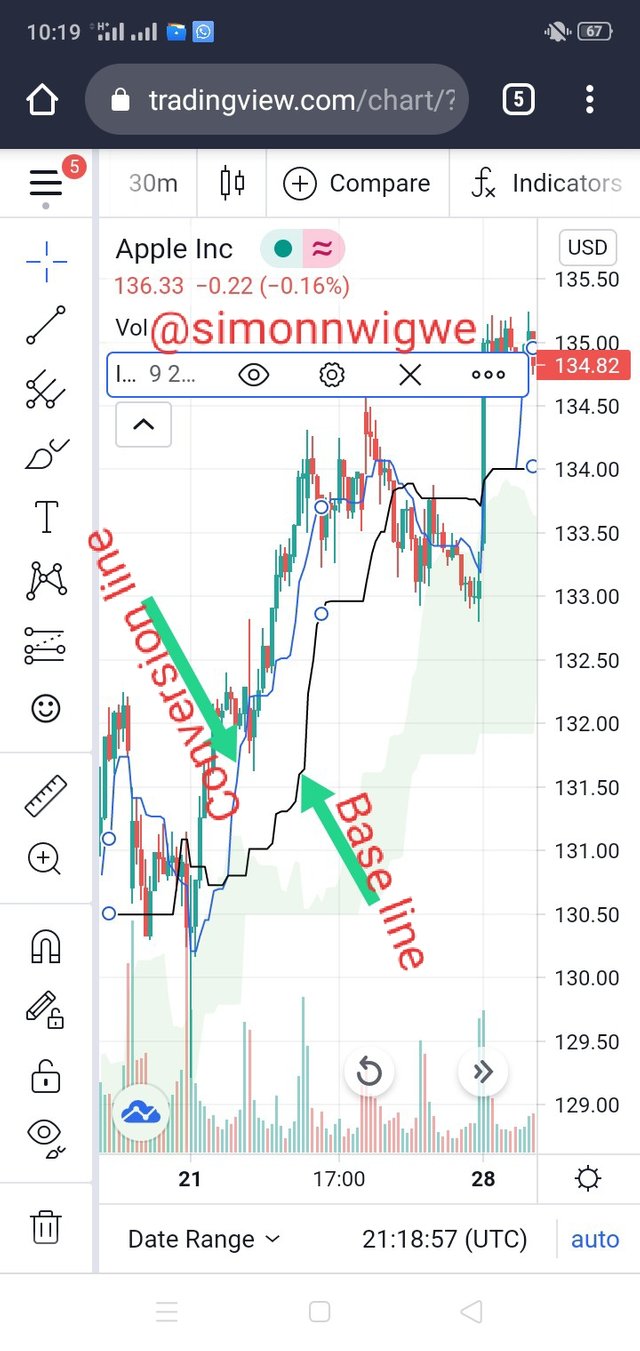
| 01. | Tenkan-Sen (Conversion Line) | This is a line that is concern with the median price over the period of 9. To calculate the Tenkan-Sen otherwise known as conversion line, you need to add the highest price of the previous 9 periods + the lowest price of the previous 9 periods and then divide it by 2. This line is used with other lines to determine the short-term trend signals for traders. This line helps to indicate support, resistance and reversal point. |
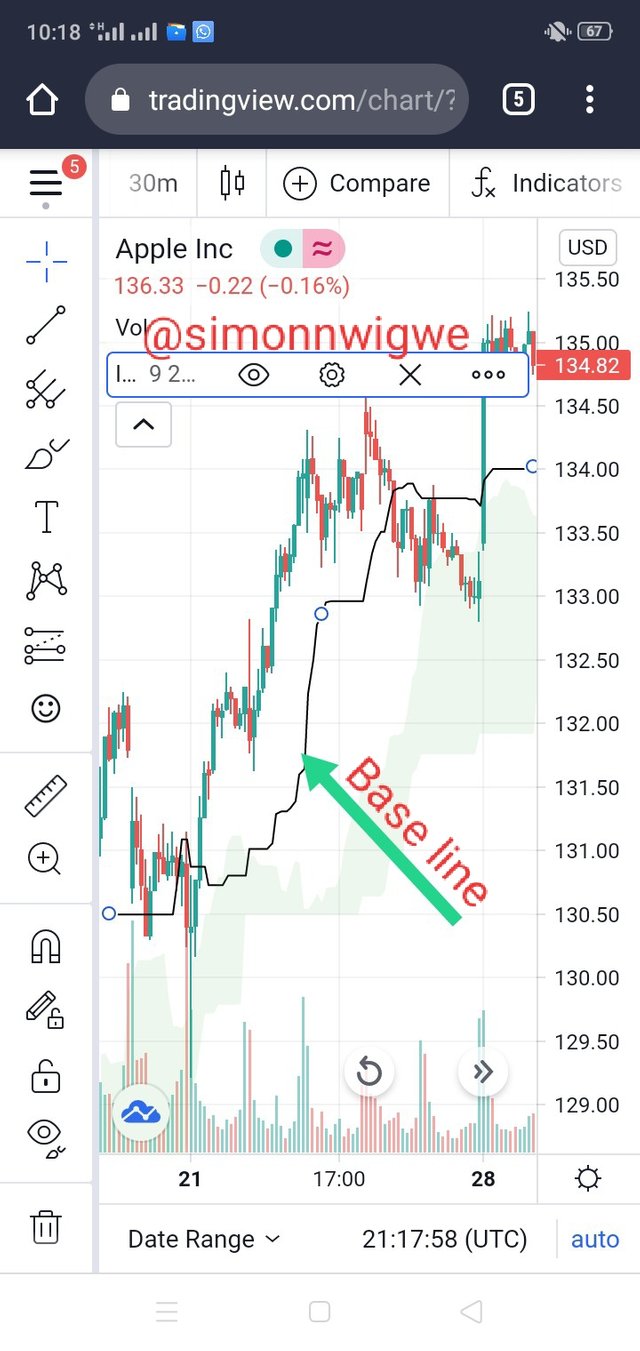
| 02. | Kijun-Sen (Base Line) | Just like the Tenken-Sen line other wise known as conversion line, the Kijun-Sen or base line is also calculated in the same procedure the difference is that in the case Kijun-Sen or base line, it is calculated over a period of 26 as against 9 which we use in conversion line. The calculation is done thus, the highest price of the previous 26 periods + the lowest price of the previous 26 periods and then divide it by 2. This line is used with other lines to determine the medium-term trend signals for traders. |
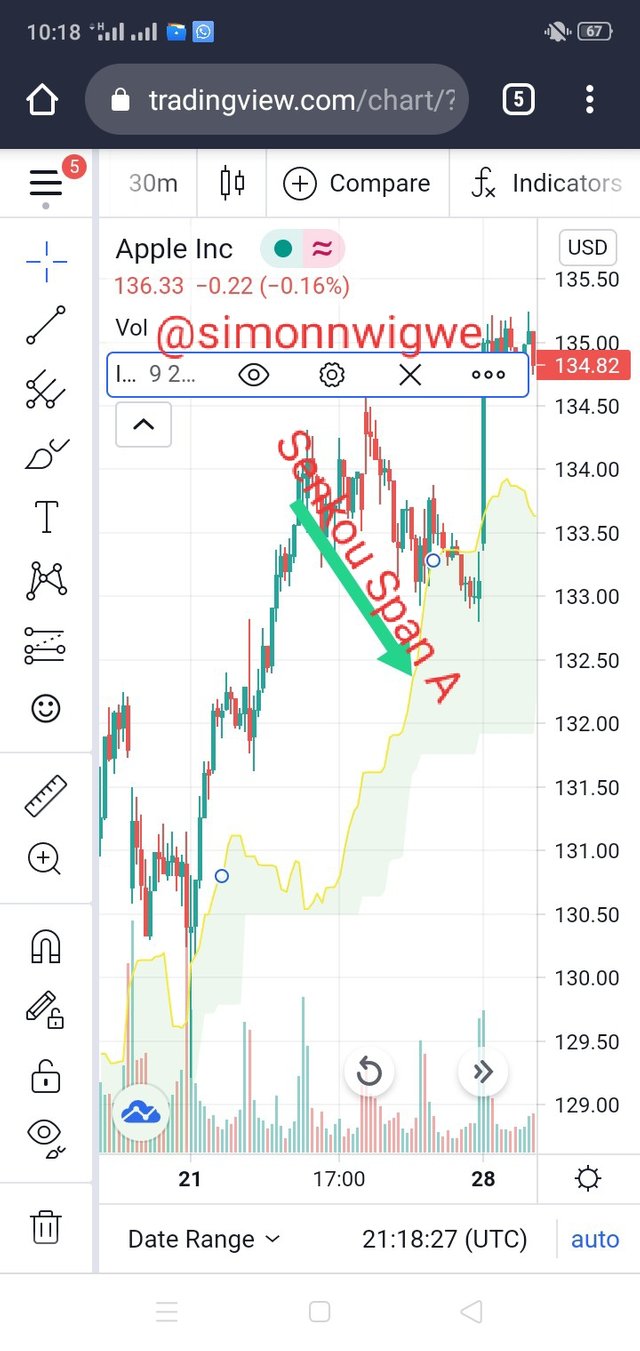
| 03. | Senkou Span A (Leading Span A) | This is also called Leading Span A and it is formed by two different line which are the Tenkan-Sen line and the Kijun-Sen line. Senkou Span A actually forms the border of the cloud in Ichimoku indicator. It is also plotted 26 period ahead on the chart. It is calculated thus, Tenkan-Sen + Kijun-Sen divided by 2. This line is use to predict future areas of interest of the trade. |
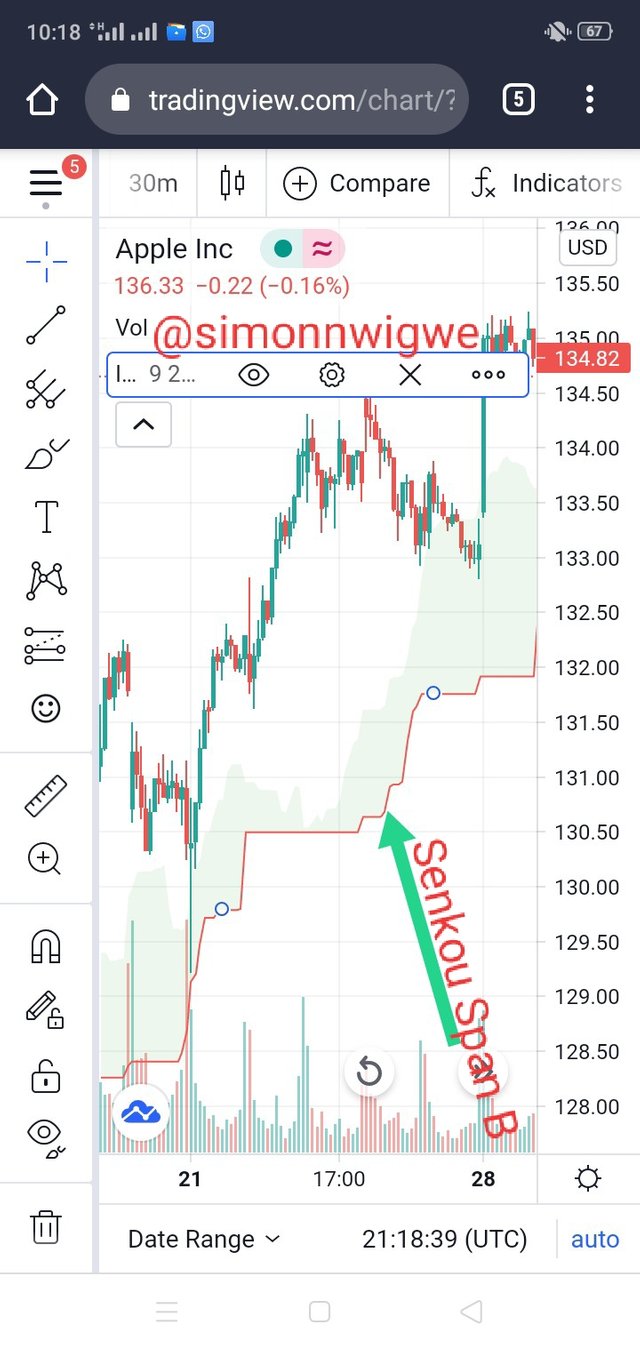
| 04. | Senkou Span B (Landing Span B) | Just like Senkou Span A, Senkou San B also forms the second border of the Ichimoku indicator. It is also plotted 26 period to predict the future resistance and support areas. Here, the calculation is done thus, Highest price over a period of 52 + Lowest price over a period of 52 divided by 2. |
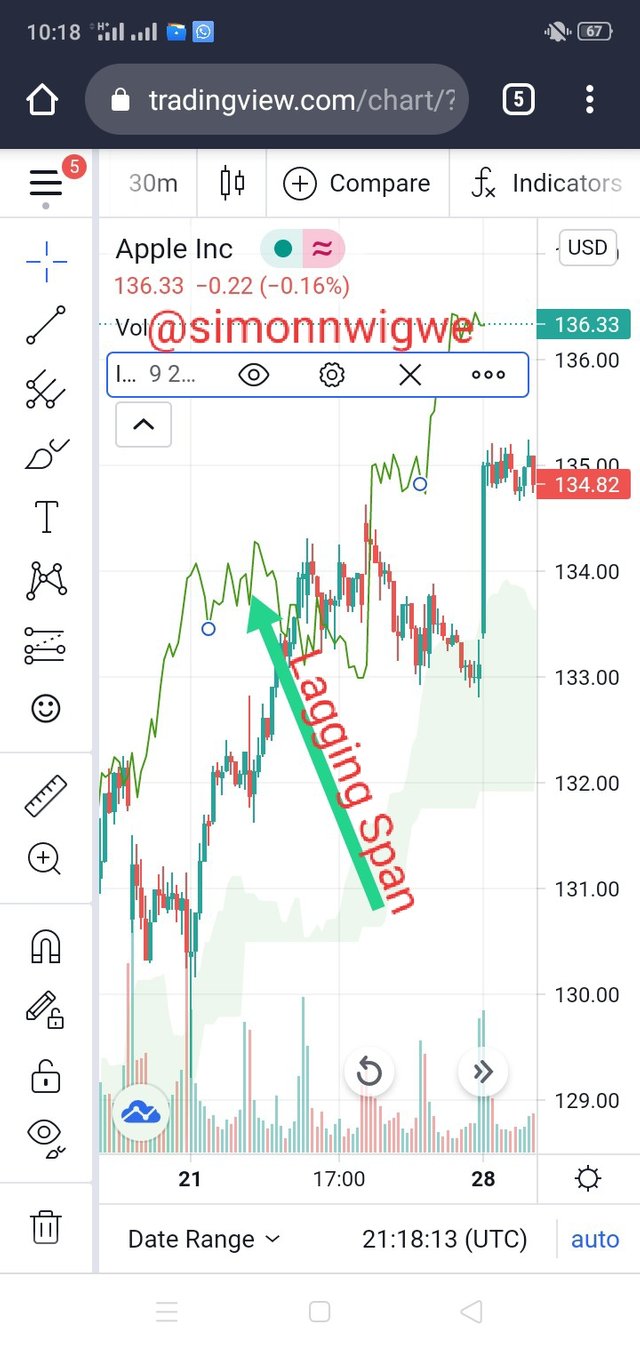
| 05. | Chikou Span (Lagging Span) | This is also known as lagging span and it is also plotted in 26 periods after the close of recent price. This is to show the relationship between the previous and current trend and also predict trend reversals. |
Question 2
How to add the Ichimoku indicator to the chart? What are its default settings? And should it be changed or not?(screenshots required)
To add Ichimoku indicator on your chart actually depends on the type of trading platform you are using. In my case, I will be making use of of trading view. Below are few steps to take you through the process.
- Open the chart
- Click on Fx
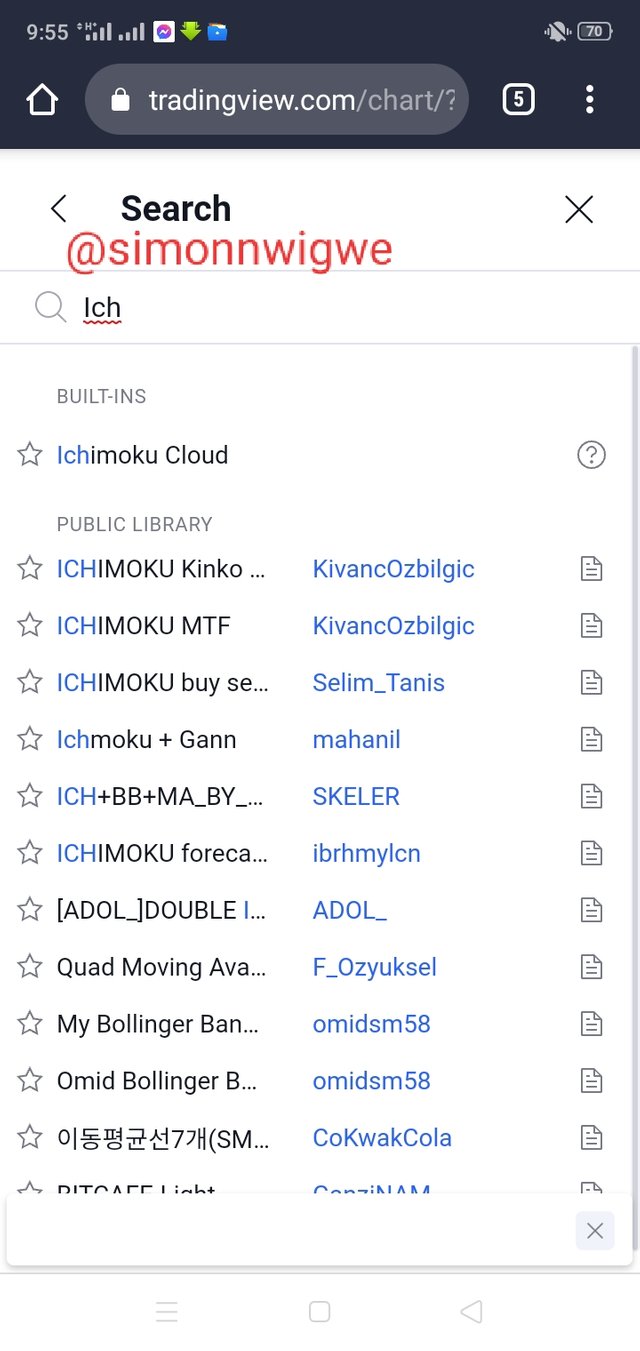
- Navigate to search menu the search for Ichimoku
- Select the Ichimoku Cloud
Default Ichimoku Settings:
The default settings are seen in the table below
| S/No. | Name of Line | Value |
|---|---|---|
| 01. | Tenkan-sen (Conversion line) | 9 |
| 02. | Kijun-sen (Base line) | 26 |
| 03. | Senkou Span B | 52 |
| 04. | Lagging Span | 26 |
| 05. | Senkou Span A | 26 |
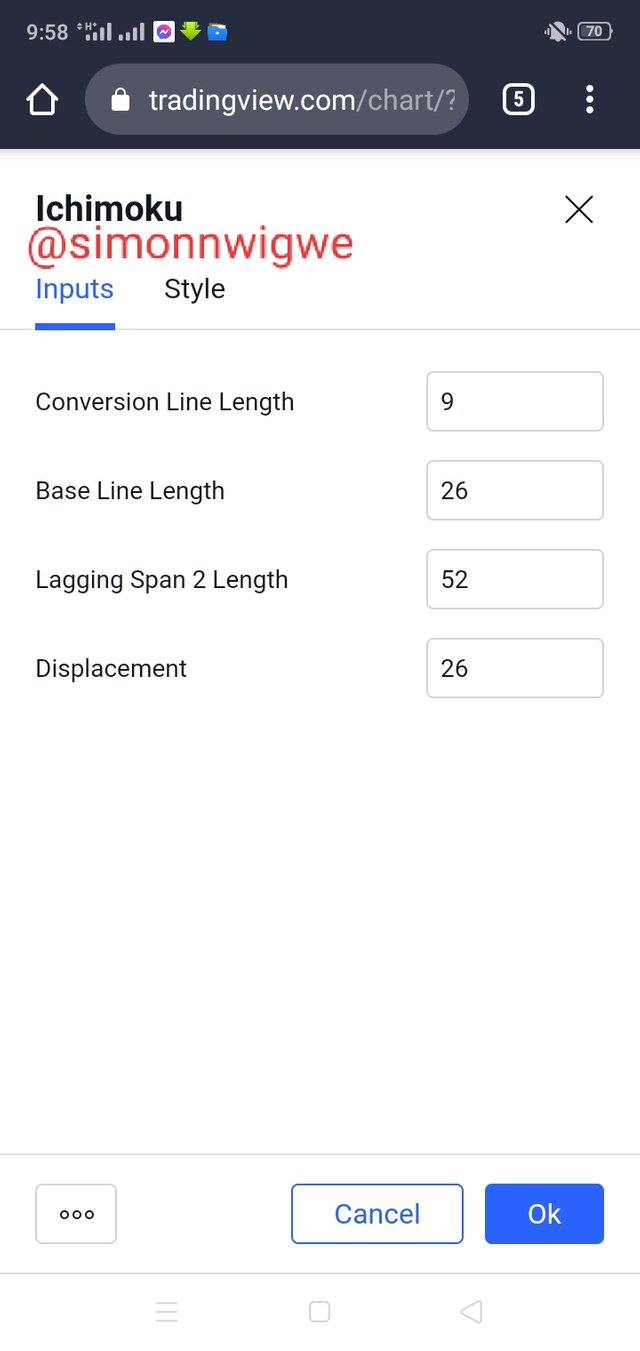
From my little understanding and from the lecture delivered by our own very professor in the person of @kouba01, the default settings can be altered due to some certain reasons. To me I believe that different areas have different trading pattern and as such this settings can be altered to suit your area of trading. For instance, 9 indicate 9 working days and similar things happens to 26 and 52 respectively.
Question 3
How to use the Tenkan Sen line? How to use the Kijun Sen line? And How to use them simultaneously?(screenshots required)
The Tenkan-Sen line as i have earlier explained, is used for short term prediction of price movement over a period of 9. It is used to show the median price over the period of 9. This line is very close to the price movement and it is one of the fastest moving line in the Ichimoku indicator. Most importantly, this line is not usual used alone as a matter of fact for a but signal to be initiated, the line has to be above the Kijun-Sen line and when it is below the Kijun-Sen line it is considered to be a sell signal.
The Kijun-Sen line is used for mid-term prediction of price movement over a period of 26. Importantly, when the medium-term movement is upward, it implies that the current price is above the Kijun-Sen line and also when the medium-term is downward it implies that the price is below the Kinun-Sen line. More also, it is important to mention here that the Kijun-Sen line is usually used along side the Tenkan-Sen line so as to provide a stronger price direction. These is because will take care of both the short and medium time movement of the trade.
Using Tenkan-sen and Kijun-Sen simultaneously: There is no doubt that to get a better result using Ichimoku indicator, one has to use the Tenkan-Sen line along side with the Kijun-Sen line. From the explanation I made above they both account for both short and medium term respectively. Recall also that when ever there is cross over between the lines they either indicate a buy or a sell signal. So therefore, when the both line are used simultaneously, the trade will be able to efficiently predict the price movement and will also know when to buy or sell. I also mentioned earlier that both lines are used to calculate the Senkou Span A which represent the edge of the cloud.
Question 4
What is the chikou span line? And how to use it? And Why is it often neglected? (screenshots required)
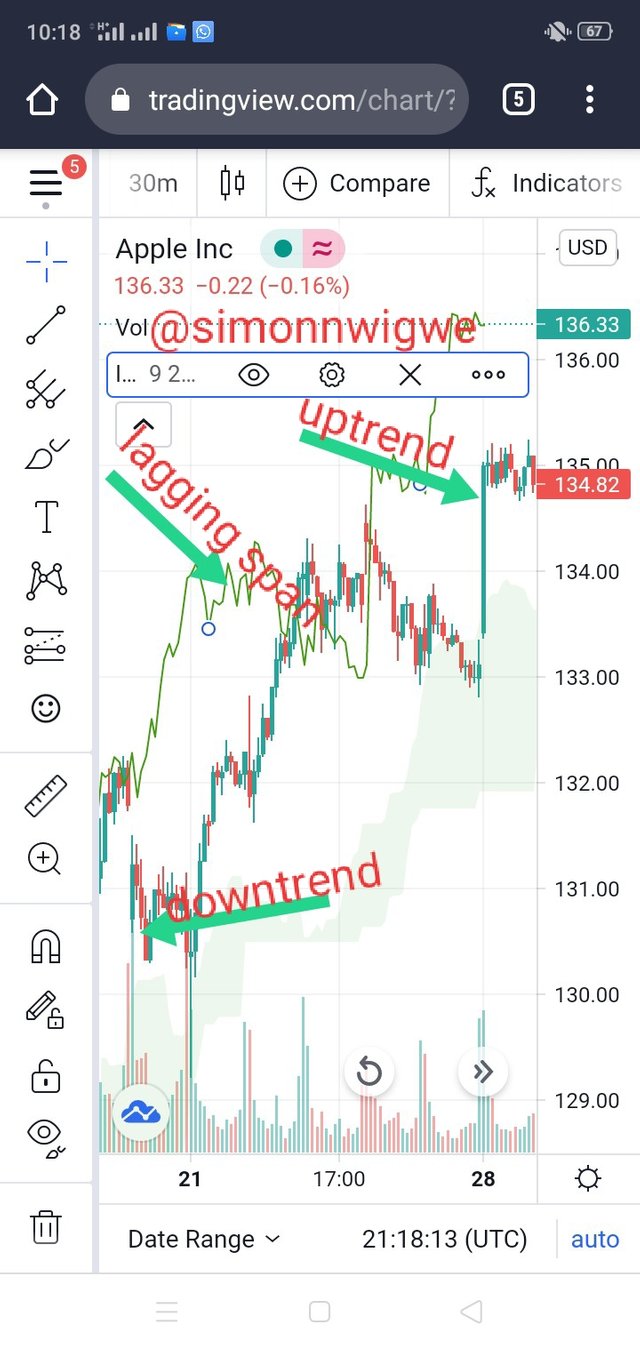
The Chikou Span line is one among the five lines in the Ichimoku indicator. This line is responsible of showing the relationship between the current market trend and the previous trend. This line is formed by plotting closing prices of the last 26 period after the current price closes.
How to use the Chikou Span: To use the Chikou Span is very easy, recall that the major use of this line is to show the relationship between both current and past price. So when this line moves above the current price, it is seen as an upward trend whereas when the line moves below the current price, it is seen as downtrend. The points of support and resistance are measured using this line.
Why is it often neglected?
As earlier stated, the major work done by the Chikou Span is to show a relationship between the current and the past prices. This implies that the Chikou Span may not have direct effect on the future prediction of prices. And if you are not a good trader the line can never mean anything significant to you. When ever one try to use this lines to predict price, it mostly generate a false signal because most times the price moves in a different direction from the once we predict.
Question 5
What's the best time frame to use Ichimoku? And what is the best indicator to use with it? (screenshots required)
In the case of Ichimoku indicator, there is actually no best time frame to use the said indicator, this implies that the indicator can be used at any time and that is why we have different lines in it that has different periods ranging from 9, 26 and 52 respectively. I also mentioned earlier that it can be used for short, medium and even long term trading. So from this you will agree with me that the indicator depends on what type of trader you are. For instance if you are a scalp trader you will focus on lower time frame but for traders who are long term trader, they will focus longer time.
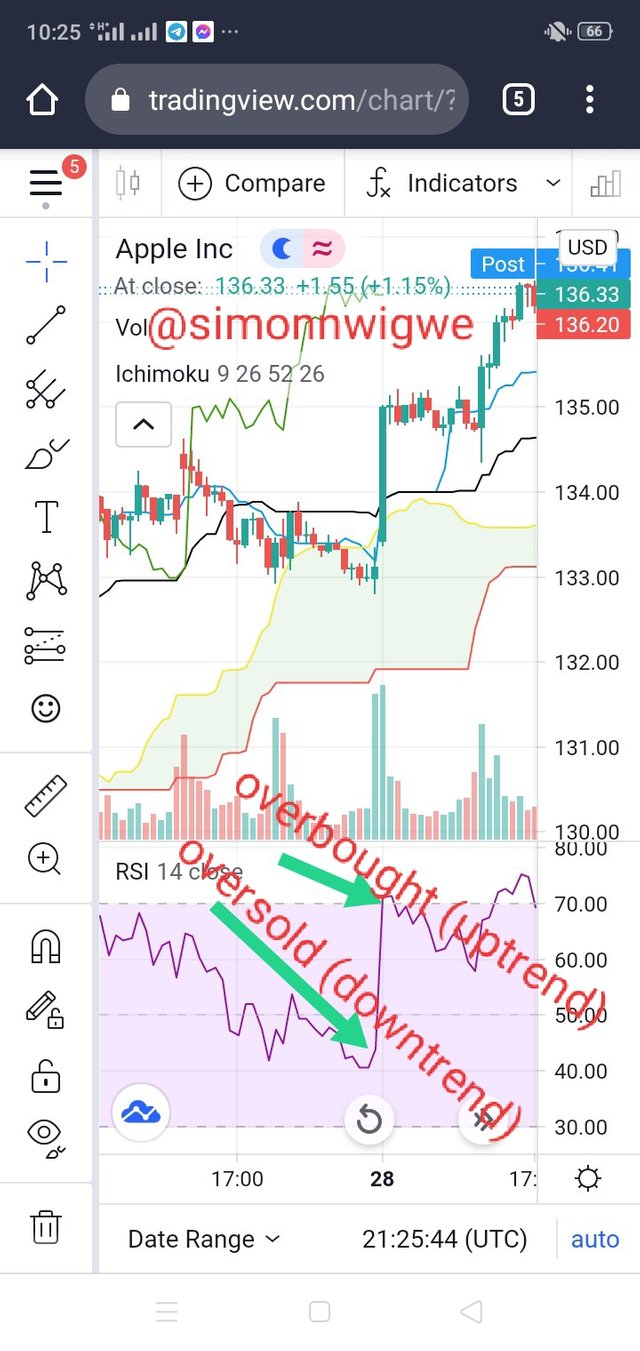
The best indicator to combine with Ichimoku indicator is the Relative Strenght Index (RSI) which is responsible for showing overbought and oversold in the market. As we already learnt the Ichimoku indicator is a complete indicator on it's own but in other to get a more efficient and also an optimal result, the combination of this indicator with RSI is very necessary. In other to identify the trend reversal, the combination of the both indicator gives a more accurate result.
Question 6
Conclusion
With the lecture and my little findings on the said topic, I have come up with the following conclusion.
- Ichimoku-kinko-hyo Indicator can be used on any time frame.
- Ichimoku-kinko-hyo Indicator consist of five lines which helps to solve the issues of short, medium and long term period.
- Ichimoku-kinko-hyo Indicator is a complete indicator which can work alone, but in the case of an efficient trading it is recommended to use it along side with RSI.
Finally, I want to sincerely appreciate the professor @kouba01 for such an amazing lecture. Sincerely this is one of the lectures I have enjoined for a very long time now. Thank you for explaining it in the language that everyone can understand. I look forward for part 2 of Ichimoku-kinko-hyo Indicator.
Hello @simonnwigwe,
Thank you for participating in the 1st Week Crypto Course in its third season and for your efforts to complete the suggested tasks, you deserve a 5.5/10 rating, according to the following scale:
My review :
An article with an average content that lacks depth in an analysis of some of the points raised.
Thanks again for your effort, and we look forward to reading your next work.
Sincerely,@kouba01
Thanks prof for your correction i will do my best to work well on it in the next lecture.