Advanced Trading: Multi-Timeframe Analysis and Market Cycles
Greetings my fellow traders,
It's the sixth week of the Steemit Learning Challenge for season 21 and I'm delighted to join this week's competition which is titled Advanced Trading: Multi-Timeframe Analysis and Market Cycles. I will be attempting the questions given below as part of my entry for the contest.


| Question 1: Understanding Market Cycles |
|---|
Explain the four key phases of market cycles (accumulation, expansion, distribution, and contraction) and their significance in cryptocurrency trading.
The four phases of market cycles are accumulation, expansion(uptrend), distribution and contraction(downtrend). The crypto market always moves in these four cycles so at all time the market must be in any of the above listed phase. For a better understanding let's talk about the various phases one after the other.
Accumulation Phase
This phase is characterised with minimal price movement of the asset. It is mostly a sideways or range movement phase and it always occurs after a downtrend movement. This phase is consider an early phase to buy assets by most of the smart investor who know and understand the market.

In this phase, when indicators like the RSI or MACD is used, it tells the traders that the market has reached its oversold region and a possible trend reversal is expected and that tells investors to buy low as the tendencies of price to rise to the upward side is very high.
Expansion Phase (Uptrend)
The Expansion Phase which can also be called the uptrend movement of the market is a phase when we see the price of the asset moving continuously in an upward direction because of the many demand for the said asset. The phase comes to play after a breakout from the accumulation phase which is the sideways or range market.

The movement here shows a higher high and higher low of the price of the asset which tells us that it is a steady movement upward. With the increase in the price, the volume of the asset also increase because of the demand for the said asset. This phase is a phase where traders enter Long position.
Using technical indicators such as the RSI in this phase helps you to identify entry and exit position. Also, during this phase one must trade cautiously because possibilities of seeing the overbought region is always very high.
Distribution Phase
After the Expansion Phase, the next phase is the distribution phase. This phase is always at the top of the market cycle usually the phase where we don't see tangible movement any long in the market. During this phase, sellers will start selling off their assets and taking their profits.

In this phase the market always moves in sideways or range manner showing the weakness of the trend. This means that upward movement has come to an end. The different pattern which shows up during this phase to notify traders about the trend reversal include double top, head and shoulder and many others.
So once we get to this phase, traders are always adviced to exit their long position or possibly take profit. While it serves as a preparation phase for other traders to enter a short position.
Contraction Phase (Downtrend)
The Contraction Phase which can also be called the Downtrend (markdown phase) movement of the market is a phase when we see the price of the asset moving continuously in a downward direction because of the many selling pressure in the market.

In this phase, we see a lot of lower lows and lower high which shows that the price of the asset is in a downward direction. In this phase we also see a high volume because of the high selling pressure. So traders here always consider taking short position.
Use of indicators like the RSI or Bollinger bands indicator can help traders to spot out region of oversold and possible reversal phase. Proper risk management must be carried to protect our account here.
| Question 2: Applying Multi-Timeframe Analysis |
|---|
Demonstrate how multi-timeframe analysis can be used to identify trends and reversals during different market cycle phases. Use examples from Steem/USDT charts.
Multi-Timeframe analysis is one of the strongest tool used to identify trends and trend reversal during the different market cycles or phases such as the accumulation, distribution and others. Now let's look at the phases one after the other and see how Multi-Timeframe analysis works in them.
Accumulation Phase: This phase is always characterised with low volume and always seen after a downtrend movement. It is always a sideways movement which signals reversal to the upward direction.
Weekly Chart:
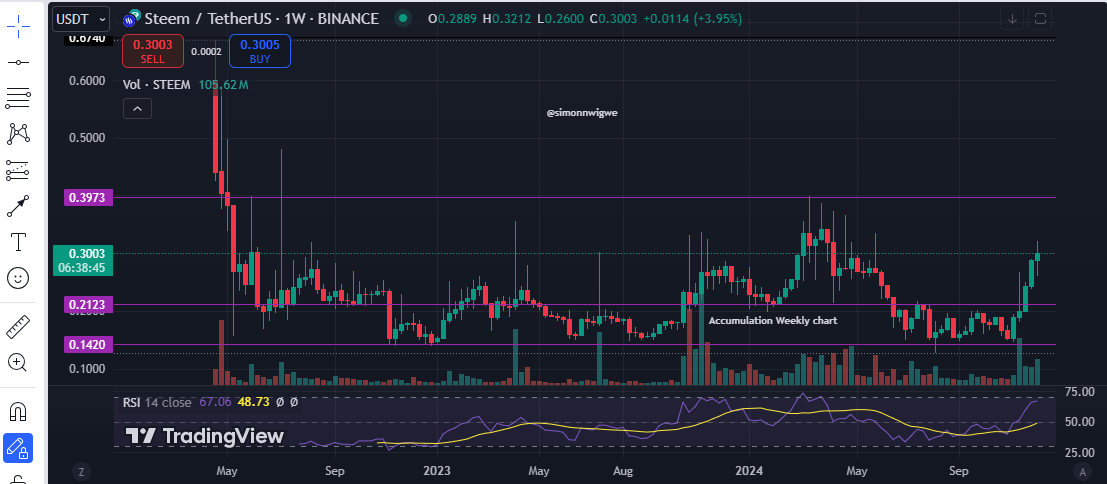
The above chart shows the weekly chart of STEEMUSDT and on this chart, the major support level has been identified. Using the MA indicator, you can see price in a range market which implies we are in an accumulation phase.
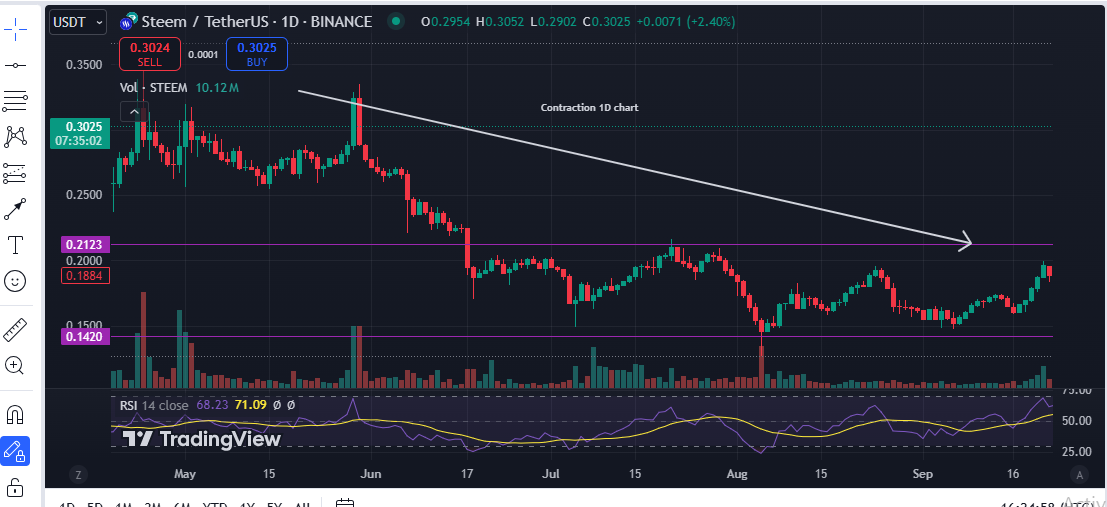
Daily Chart:

From the above chart, you will notice that the price is within a range but the volume is increasing which means that there is an increasing buying pressure. This shows that the market may likely move upward.
Hourly Chart:

From the above screenshot, you can see that there is a little breakout within the range which is in the predicted upward direction meaning that our analysis of saying the phase is an accumulation phase is true.
Expansion Phase (Uptrend): This phase is always characterised with high volume and always seen after the accumulation phase. So a breakout from the accumulation phase where price goes upward is what we call the expansion phase.
Weekly Chart:

The above chart shows the weekly chart of STEEMUSDT and on this chart, we see a breakout of price above the re resistance which was holding it in the accumulation phase. We also notice a steady higher high and higher lows movement.
Daily Chart:

From the above chart, you will notice that the price is showing a clear higher highs and higher lows which implies that the market is in an uptrend. When the there is a little pull back, it is the best time to enter the market as a trader.
Hourly Chart:

From the above screenshot, what you should be looking at is an opportunity to enter a long position in the market. So look for your entry and take the opportunity and make some profits.
Distribution Phase: This phase is always characterised with high volume and always seen after the expansion phase. After a significant uptrend movement, the price will reach a level where it can't move further upward thereby consolidating and forming some divergence pattern such as double top.
Weekly Chart:

The above chart shows the weekly chart of STEEMUSDT and on this chart, we see a trend exhaustion to the upward direction and a resistance level which price no longer break through showing weak upward momentum.
Daily Chart:

From the above chart, you will notice that the price is in sideways or range meaning it is consolidating at that level. Divergence may be noticed sometimes between the price and the RSI indicator in such a case.
Hourly Chart:

From the above screenshot, you to monitor false breakout or a retest back to the resistance level. Here the volume will be reducing at this stage.
Contraction Phase (Downtrend): This phase is always characterised with high volume and always seen after the distribution phase. Here the price breaks down the distribution phase and move in a downward direction making series of lower highs and lower lows.
Weekly Chart:

The above chart shows the weekly chart of STEEMUSDT and on this chart, we see a breakout of the support level and the market moving downward.
Daily Chart:
From the above chart, you will notice that the price is forming series of lower highs and lower lows hence an opportunity to short the market is always provided for traders at this point.
Hourly Chart:

From the above screenshot, you are to check for potential points of oversold which will signal trend reversal or trend continuation.
| Question 3: Combining Market Cycles with Multi-Timeframe Analysis |
|---|
Show how to align multi-timeframe analysis with market cycles to refine your trading strategies. Highlight how these tools complement each other in volatile markets.
In aligning Multi-Timeframe analysis with market cycles which includes accumulation, expansion, distribution, and contraction, to refine trading strategies in volatile market like the cryptocurrency, traders get the privilege to make a better decision because they have taken into consideration all the needed data. So let's see how we can combine this tool to enable traders make an informed decision.
Understand the Market Cycle and Its Key Characteristics: Firstly the trader must understand the market cycle and its key characteristics as we have discussed previously. For easy and better understanding let me summarise the phases once again with their key characteristics.
Accumulation: This phase is a phase where price consolidate after a downtrend movement. Traders buy low at this point.
Expansion: When there is a breakout from the accumulation phase and price moves in an upward direction.
Distribution: Price creates another consolidation phase as the upward momentum reduced and sellers starts taking profits here.
Contraction: Price breaks the distribution phase which is a sideways or range movement and moves downward ushering a downtrend.
How Multi-Timeframe analysis Complements Market Cycles: The Multi-Timeframe analysis is an analysis that involves analysing a particular asset in different timeframe such as the higher, medium and lower timeframe for the purpose of getting the actual trend of the asset and also spotting possible reversal point in the market. Now let's see how the timeframe align with is cycle of the market.
Accumulation Phase
Higher Timeframe (Weekly): Here you are to look out for strong support level and also use the RSI indicator to confirm divergence which shows that the next phase will lead the market to an upward movement.
Medium Timeframe (Daily): Ensure you see price consolidating and also check volume to be sure it is increasing showing that there are institutional traders who will soon push the market upward.
Lower Timeframe (4H/1H): Here you look for volume increase near the key levels and also ensure that the range has potential to break out in an upward direction based on the green candles.
Strategy: What should come to your mind here is longing the market and to do that you look for key support level using the higher timeframe and the breakout point on lower timeframe so that you don't miss out of the market.
Expansion Phase
Higher Timeframe (Weekly): Here you are to look out for breakout from the resistance level and an uptrend movement where the market shows series of higher highs and higher lows.
Medium Timeframe (Daily): Identify levels of pull back and also check to be sure that the market is not overbought so that you don't get stuck or enter when the trend has exhausted.
Lower Timeframe (4H/1H): Careful check for continuation pattern after a pull back so that you can enter the market if you missed the first move. These are done in short term support levels.
Strategy: You can always enter the market immediately after a pull back. Use the medium timeframe to determine the pull back and use the lower timeframe for your entry. To minimise loss and maximise profit also use the trailing stop to secure profit made.
Distribution Phase
Higher Timeframe (Weekly): Here you are to look out for resistance level which shows that price momentum towards upward direction has exhausted and price begin to consolidate.
Medium Timeframe (Daily): Check out for reversal pattern forming such as double top and indicator such as RSI showing bearish divergence.
Lower Timeframe (4H/1H): Check for fail breakout of the consolidation phase that was formed as a result of the weak momentum also check to see that volume decline showing traders losing interest.
Strategy: Exit any long position and prepare to enter a short position because the market is about to reverse. Check this reversal on all timeframe for confirmation.
Contraction Phase
Higher Timeframe (Weekly): Ensure that there is a breakout in the key support level from the Consolidation phase in the previous phase above. Market shows lower lows and lower highs showing downtrend movement.

Medium Timeframe (Daily): Be sure to see series of lower lows and lower highs which tells you that the market is in a downtrend.
Lower Timeframe (4H/1H): After a little retracement, be sure to check for market oversold and a continuation pattern to enter the market if you missed the first entry.
Strategy: Here you focus should be on shorting the market and also using stop loss to mange risk of the movement.
Tools to Enhance Multi-Timeframe analysis and Market Cycle Integration
Some of the tools one can use to enhance Multi-Timeframe analysis and Market Cycle Integration include the support and resistance level (identifying key levels), volume of the asset which talks about increase for breakout and decrease for reversal of the market. Use of indicators such as RSI and others to spot trend continuation and trend reversal.
Adapting to Volatility
Trading assets during a volatility one must ensure to confirm the movement of the asset through various timeframe such as the higher, medium and lower timeframe. Also a proper risk management must be used to minimise loss and maximise profit. This can be achieved by using the trailing stop while trading a volatile market.
| Question 4: Developing an Advanced Trading Strategy |
|---|
*Create a trading strategy for Steem/USDT that integrates market cycle phases and multi-timeframe analysis. Specify your entry, exit, and risk management criteria. *
To create an advanced trading strategy for the pair of STEEMUSDT using the using the market cycle and the Multi-Timeframe analysis to enable us determine the entry, exit and risk management, the following steps can be used.
Step 1: Strategy Overview You must first of all align the trend with market cycle in different timeframe. Check the trend in higher, medium and lower timeframe in the cycle of the market.
Step 2: Trading Rules by Market Cycle Phase Here we look at the different phases of the market one after the other.
Accumulation Phase
Characteristics: Always a consolidating phase after a downtrend movement with a very low volume.
Goal: Enter a long position above the support level
Entry Criteria: Check weekly, daily and hourly timeframe and spot breakout in lower timeframe.
Exit Criteria: Take profit in the next resistance level and stop loss below the accumulation range.
Expansion Phase
Characteristics: Here we see price moving in an upward direction making series of higher highs and higher lows. Also the volume here is seen increasing.
Goal: When there is a pullback, you enter a long entry
Entry Criteria: Check weekly, daily and hourly timeframe and spot breakout within the accumulation phase.
Exit Criteria: Take profit in the major resistance level and stop loss below the previous swing.
Distribution Phase
Characteristics: Here we see price decline in upward movement showing decrease in the momentum to push price upward. Volume here shows that there is selling pressure as traders take who entered long begin to take profit.
Goal: Exit any long position
Entry Criteria: Check for bearish divergence and possible trend pattern such as double top.
Exit Criteria: Take profit in the major support level and stop loss below the previous swing.
Contraction Phase
Characteristics: Here we see price breaking the range and coming downward forming series of lower lows and lower highs, volume increase here with much selling pressure.
Goal: Enter short trades only.
Entry Criteria: Check for bearish continuation pattern and enter after spotting one.
Exit Criteria: Take profit in the major support level and stop loss above resistance.
Risk Management and Tools for Effective Implementation
For your risk, always try to use just 1-2% of your capital and also ensure to place a stop loss in all your trade. Always use a risk reward ratio of 1:2 which is reward of 2 and a risk of 1. Use trailing stop to adjust and secure profits.
For Tools for Effective Implementation, use indicators such as the RSI, moving average and others and also always check the volume of the asset. Check candle pattern to know what is coming to the market.
| Question 5: Mitigating Risks in a Volatile Market |
|---|
Discuss how to manage risks and avoid false signals when trading across multiple timeframes during different market cycle phases.
In other to manage risks and avoid false signals when trading across multiple timeframe during the different market cycle or phases requires much discipline in the part of the trader. Here is a few steps to take when doing that.
Managing Risks Across Market Cycle Phases: Managing risk across different market cycle phases differ and we will be looking at how to manage risk in each of the phases one after the other.
Accumulation Phase: In this phase, there are possibilities of false breakout which may trap you in the market so it is recommended you use tight stop loss and also use RSI or other indicators for confirmation.
Expansion Phase: Here use indicators like RSI to spot overbought in the market and don't enter when the market is already in its overbought region. You can make use of trailing stop to lock profit generated.
Distribution Phase: Fake breakout can be seen in this phase leading to traders being trapped in the market. Confirm reversal using the different tools such as candle pattern and indicator before making decisions. It's best to avoid the market during this phase.
Contraction Phase: Here you are to enter trade after the retracement to the resistance level. Always short the market here and use other indicators for confirmation.
Avoiding False Signals in Multi-Timeframe Analysis: To avoid false signal you must ensure to check market across timeframe i.e higher, medium and short. Also avoid reliance on a single indicator. Ensure to use two or more indicators. More also, do not trade in a consolidating or choppy market. Ensure you are upto date with the news.
Risk Management Best Practices: Here you must take into account the position size, always ensure you use 1-2% of your portfolio for any trade. In setting your stop loss, ensure it is in major support and resistance level. The risk reward ratio must always be 1:2 to maximise profit and minimise loss.
Strategies to Filter False Breakouts: Always use volume to confirm if the market is trending or reversing. Trending market has increased volume whereas a market which want to reverse has decrease volume because of the less momentum. Also check for bullish and bearish divergence for a breakout to know it's strength.
Steem/USDT in the Expansion Phase

From the above chart, you will notice that the price chart of this asset was checked for weekly, daily and hourly. Seeing that there is a possibility of uptrend after the accumulation phase, I entered a buy order.
From the chart the order was placed above the support level and the stop loss was kept below the price action. Seeing that the market was in an uptrend I place the take profit in the next resistance level. The risk taken in this trade is very little as you can see from the screenshot.
Finally, I want to invite @waterjoe, @josepha, and @ripon0630 to also join the contest and share with us their thoughts on Advanced Trading: Multi-Timeframe Analysis and Market Cycles.
NB: All images except otherwise stated are mine and are gotten from the TradingView website
This blog is a power pack I would say complete knowledge from the day you start planning for a trade to settling it down. It is a course in itself!