Steemit Crypto Academy Season 2-Week4 - Cryptocurrency Trading with RSI For @kouba01 Submitted by @silencewan
INTRODUCTION
Hello everyone, it's another week of the crypto academy homework assignments. Today we will be dealing with Cryptocurrency Trading with RSI. But before I want to commend the hard work of professor @kouba01 for his wonderful lecture note. He's always given us a simplified lecture recourse which I must say is really helpful in doing my research. I must say that it was really simple and understanding. Thanks to you for the wonderful resource.
To set the ball rolling, I will like us to know what what this topic is heard towards before we break it down to answering the professor's questions.

Question One
What is the Relative Strength Index - RSI and How is it Calculated?
From my research, I have come to realize that the RSI seems to be in existence for a very long time, it is said to be developed in the year 1978 which has names us a popular momentum oscillator. The RSI is called such because it's a tool that is used in technical analysis. Technical analysis because it measures magnitudes in recent changes made in prices to radicate oversold or overbought in the prices of a stock or probably an asset. It's said to be an oscillator because it's a line graph moving within two extremes which can have a reading from 0 - 100. The developer of this RSI is said to J. Welles WilderJr. which he introduced in one of his books known as the Seminal 1978 book, "New Concepts in Technical Trading Systems."
Explaining What the RSI is, I will like to explain to you How it works or How it's calculated.
First and foremost, the formula which is used is computed, but a two-way calculation which starts using the following formula;
In showing the formula step by step, the was a challenge which I had to improvise writing on a paper and taking a screenshot
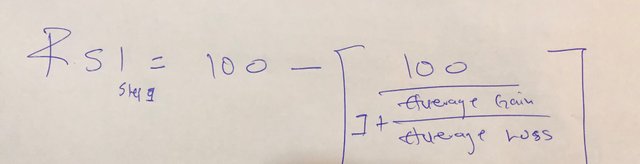
Average gain or Average Loss which is used in this calculation is said to be the average percentage gain or loss, when going through a look-back frame, the formula is said to use a positive value for the average loss considering.
And for the standard uses 14 periods in order to calculate the initial RSI value.
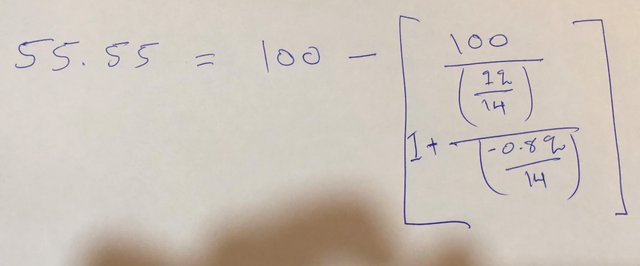
Let's consider this example;
imagine the market closed higher seven out of the past 14 days with an average gain of 1%. The remaining seven days all closed lower with an average loss of -0.8%.
the following expanded calculation would be for the first part of the RSI
Since there about 14 periods of available data, calculating the RSI formula for the second part can be done. The second part is done to smoothen the results
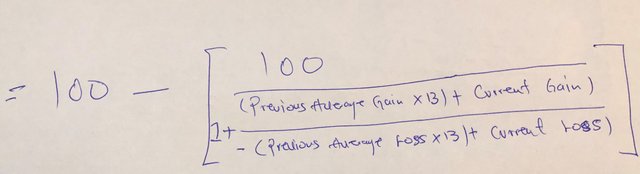
Calculation of the RSI
The formulas above can lead you to calculate RSI where the RSI lines can also be plotted under an asset's price chart.
Above is How the RSI is calculated.
Question Two
Can we trust the RSI on cryptocurrency trading and why?
I personally will say that RSI can be trusted since they are able to make a comparison between a bullish and bearish price of an asset and displays the results in a form of an oscillation which is then placed beneath a price chart, the signals of these are most reliable especially when they conform to the long-term plan.
Question Three
How do you configure the RSI indicator on the chart and what does the length parameter mean? Why is it equal to 14 by default? Can we change it? (Screen capture required)
Steps to configure the RSI indicator is as follows,
There are so many of these platforms used to analyze the RSI, but I have chosen to use the tradingview.com
step 1
After going to the website you register first and then click on the chart tap to make your pairs
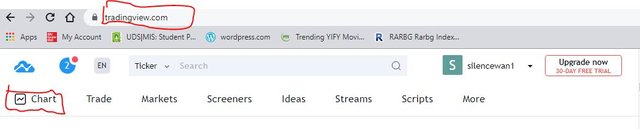
Step 2
Select the "fx" button

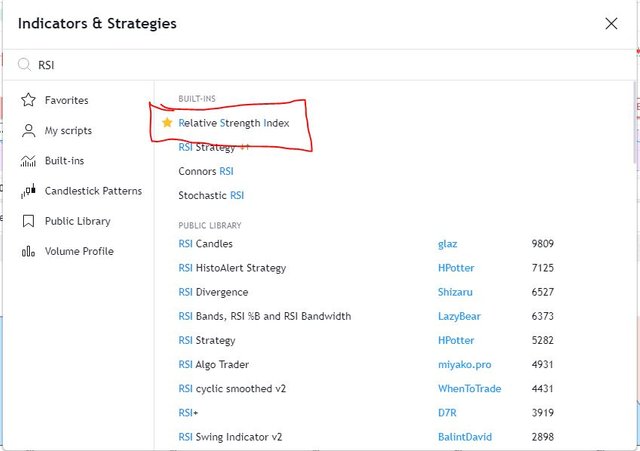
Step 3
Type RSI in the search box and select Relative strategy Index
Step 4
In configuring it, it appears below the price chart and if you want to access the custom window you will have to click on its corresponding settings is which I will highlight in the settings
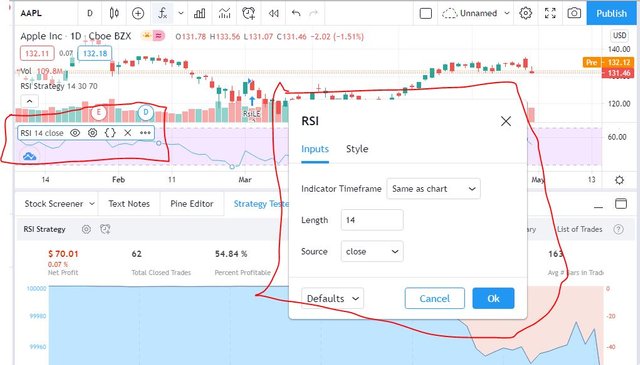
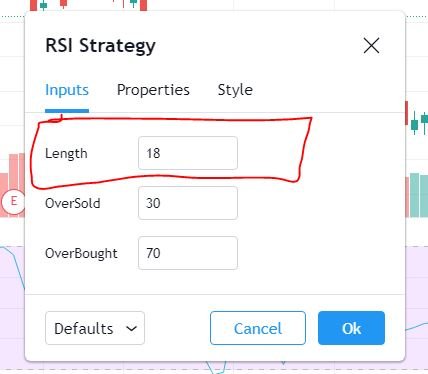
The Lenghth the parameter
The length parameter can explain us amount of days which is taken by the indicator in analyzing the average value. When you launch into the site, by default, the length of these RSI is always 14 thereby making the amplitude have an effect on the unit of the graph. This simply means that when dealing with the monthly chart, the RSI value takes accounts of the last 14 months and if in days similar process or even a minute.
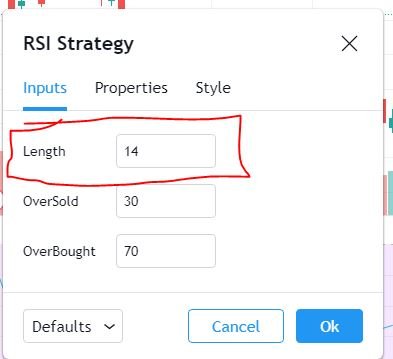
Changing the length parameter
You would follow the same procedure as we did in the first part, buy selecting the fx tab and changing the length parameter.
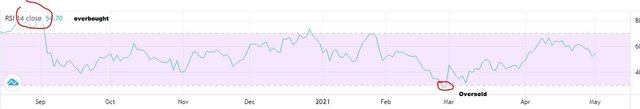
How do you interpret the overbought and oversold signals when trading cryptocurrencies? (Screen capture required)
As explained by our professor in his lecture notes and further research has proven that, when using the RSI, the level at which cryptocurrencies is supposed to be is from 30-70, for instance, if the level goes down 30, we consider it to be oversold but if the level goes beyond the 70 mark level, we consider it to bean overbought.
Below is a screenshot to prove our claim
How do we filter RSI signals to distinguish and recognize true signals from false signals. (Screen capture required)
RSI signals can be distinguished to be when the RSI false signal trend does not reverse, this will simply alert you that there is a false signal but a case we see that there is a reverse, automatically we would know that it is a true signal.
But at least there are ways you can avoid false signals, although not stated in the questions, I deem it necessary;
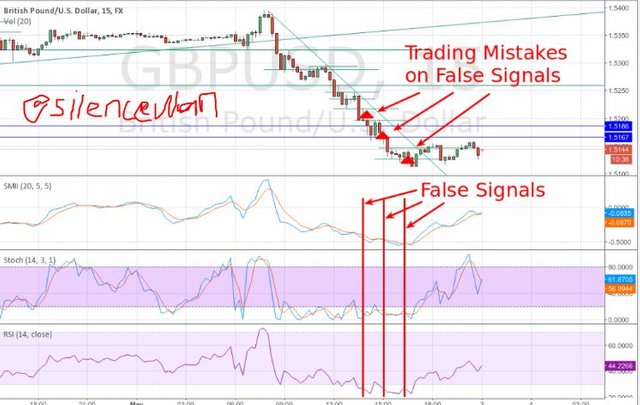
Avoiding false signals
Take out all concerns when it comes to RSI because it isn't your friend
Avoid all RSI false signals when they do not reverse
Also, using smoothed versions of the RSI indicator to avoid all false signals
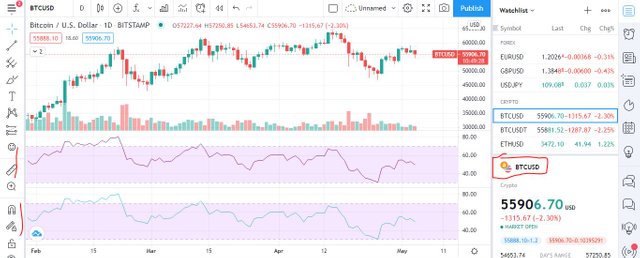
Review the chart of any pair (eg TRX / USD) and present the various signals from the RSI. (Screen capture required)
I will review a chart of BTC and the USD and the RSI graph below shows or tells us that these two have passed the level of an overbought since it has exceeded the supply comparing to the demand. They have gone past the stated level for an overbought which is the 70 mark level.
Conclusion
I will like to conclude by saying that RSI really play a key important role in our trading which, it is able to give out results where by you can analyze whether your trade could be valid or invalid, so far us this class is concern, i will say that professor @kouba01 did a great job for bringing such a wonderful topic into the cryptoacademy as one of the courses. I must say that this has really enlightened my knowledge.
Thank you for reading
Hi @silencewan
Thanks for your participation in the Steemit Crypto Academy
Feedback
This is fairly done. Kindly put more effort into your work.
Homework task
6
That is for reviewing my work professor @yohan2on. Would try my best in the subsequent once.