On-chain Metrics(Part-2)- Steemit Crypto Academy- S4W3- Homework Post for @sapwood

Hello everyone, it's another exciting week of the steemit crypto academy season 4 week 3. This week with professor @sapwood is all about Onchain Metrics. I would make my submissions on the question bring asked by the professor.
Let's set the ball rolling with the first question asked by the professor.

Question One: What is the difference between Realized Cap & Market Cap, How do you calculate Realized Cap in UTXO accounting structures? Explain with examples?
In this chapter, I would be talking about what Realized cap (Realized capitalization) is and also Market Cap :
Market Cap
This could also mean market capitalization, which talks about the total representation of a companies shares or stock. The market cap of a company could be found when you multiply the total amount of shares together with the current price of the asset available in the market or the total supply multiplied by the current price. So what we should know here is that price movement, that is the current supply and current price could have an impact on the market cap.
Let's see how the market cap is calculated. We already know that the market cap is found when you multiply the supply by the current price of the asset we looking at.
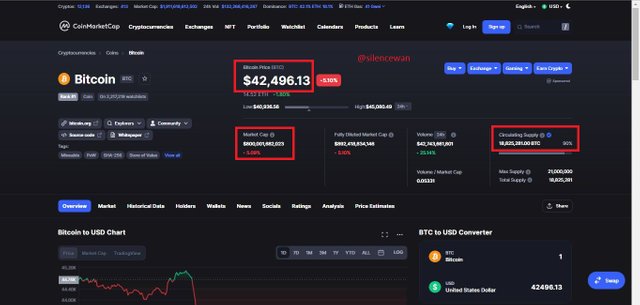
Let's take any crypto asset in the market say, BTC. This asset currently has a circulating supply of about 18,825,281.00 BTC and its current price is at $42,706.38. So we can now find our Market cap. Note: These values were taken as at the time I was making my submission towards this assignment.
Market Cap of BTC = 18,825,281.00 × 42,706.38
Market Cap of BTC = $ 803,959,603,993
Realized Cap
The Realized Cap is said to be a variation of market cap in which every section of the UTXO(Unspent Transaction Output) is valued as it is based on the last price movement and also being opposed by its current value price. They further represent the realized value of every asset that is found in the network as they are also being opposed by their market value. So basically, the Realized cap actually is the total or sum of the recently purchased prices of assets.
Calculation of Realized Cap in UTXO accounting structures
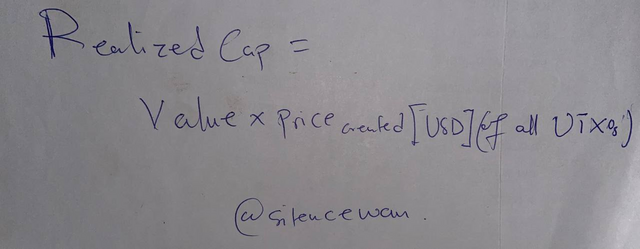
Assuming your wallet looks lithe below data. We can find our realized cap with the help of the equation.
5 bitcoins at $4000 /each
10 bitcoins at $500 / each
1 bitcoin at $10,000 / each
we can find our realized cap which is done below here.
(5$4000) + (10$500) + (1$10,000) = $35,000
35,000 / 16 = $2187.50***
Difference between Market and Realized Cap
The major difference between these two is that, as the market cap indicates the market value of an asset, the realized value indicates the actual values of the network
Question Two: Consider the on-chain metrics-- Realized Cap, Market Cap, MVRV Ratio, etc, from any reliable source(Santiment, Glassnode, etc), and create a fundamental analysis model for any UTXO based crypto, e.g. BTC, LTC [create a model for both short-term(up to 3 months) & long-term(more than a year) & compare] and determine the price trend/predict the market (or correlate the data with the price trend)w.r.t. the on-chain metrics? Examples/Analysis/Screenshot?
For this task or question, I would be using the Santiment for my On-chain Metrics analysis
Realized Cap
As I have explained what Realized Cap is, we should also know is that, for cases where we experience bullish trends in the market, the Realized Cap also turns to increase while in a sideways trend, you can observe a sideways movement of the price of the asset. But in the case when we observe a downtrend or say a bearish trend in the market, the Realized cap also drops but in this case it drops very little when taking into consideration the market price of the asset.
Short term (3 months ) analysis
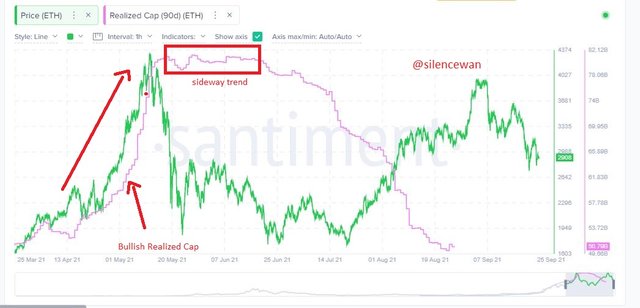
The provided image below gives an account of the price movement of Ethereum for 3 months(90 days). From the chart, there were little fluctuations of the asset until 18th April 2021 when the price of the asset started to grow to start with a price of $2,151.25 and a Realized Cap of 55.89B through to 13th May 2021 with an increased price of $4,175.15 and with a Realized Cap of77.98B. As soon as it hit that peak there was a massive fall but we know that does not really affect the Realized Cap that much, Realized cap would reduce slowly compared to the market price. As soon as that happened, there was a sideway movement of the price of the asset being observed which moved from 21st May 2021 with a price of $2,541.28 and a Realized Cap of 80.98B through to 21 June 2021 with a price of $2,542.51 and then a Realized Cap of 80.54B.
long Term - 1 Year
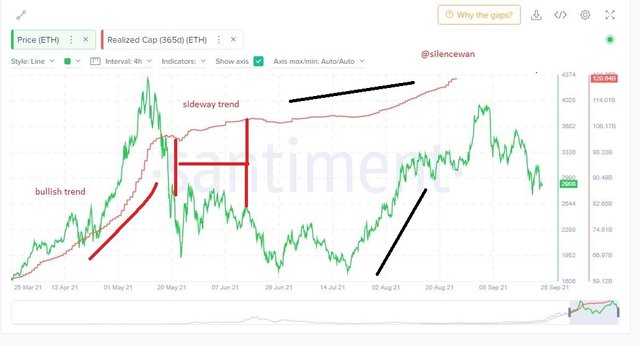
In the image or chart below, I have indicated the possible sideway trends and also uptrend or bullish trends in the chart. For the long-term 1 year(365 days), we can see that it looks different from that of the 3 months (90 days). This is still a chart of Etheereum.
We could see that, from 28 March was when the price started spiking with a price of $1,625.21 and then along with Realized Cap of 60.05B. This rose steadily until it got to 16 May when the price of the asset was at $3,824.15 with a Realized cap of 102.74B. After this, Realized cap maintained a very smooth movement but the Price still rose to its highest peak and then a sharp fall where the was a sideway price movement of the asset.
Ths moved from 24 May through to 13th June with prices starting from $2,365.93 and Realized Cap of 102.82B through to $2,431.08 and Realized Cap of 107.92B
What we should know here is that the Price of the asset does not really have so much effect on the Realized Cap. We can see in the chart that, there was a very sharp fall, give us a downtrend or a bearish trend but the Realized cap is still maintained.
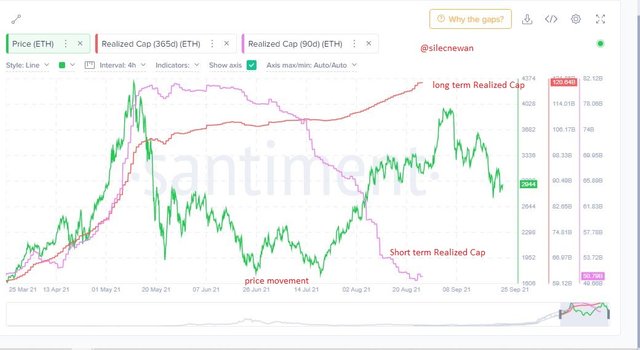
Comparing the short term (30 days) and then long term (365 days) against Ethereum price.
Market Cap
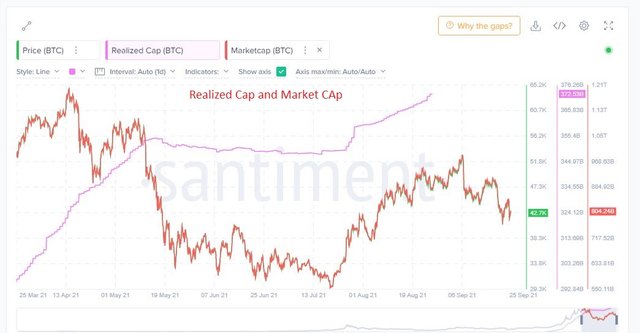
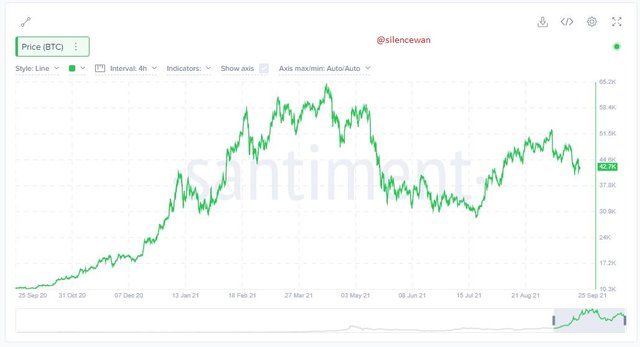
We already know how the Market Cap is calculated. The total of the circulating supply is multiplied by the current price of the asset. I would be using BTC now for this task. Let's check-in site to see how price varies from the market cap.
This is a chart of BTC and you can see the price movement. I would be adding the market ca to the next chart then we try to see the variation of Price against the Market Capitalization.
Market Cap together with the Price of the asset added to the same chart seen below.
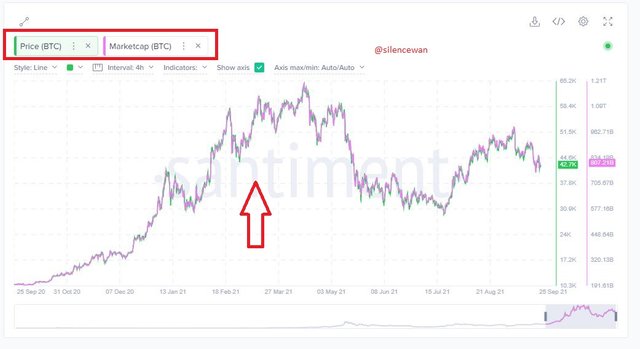
Unlike in the case of the Realized Cap where it does not tally with the price movement. Here you can see that Price is proportional to the Market Cap. So basically, what can be observed here is that Market cap although the asset is taken into consideration a long-term based or short would still be proportionate unlike in the case of the Realized Cap.
MVRV Ratio
What MVRV Ratio means market-value to the realized-value ratio which denotes an assets market cap to its realized cap. This technique helps to spot the ups and downs of the market does, it helps in detecting prices when they are either above or below a fair value. So basically, the MVRV ratio can help in the determination of a bearish or a bullish trend. There are two things to observe here. This is observed on a scale of 0 and 200 and when on the scale, the value is seen to be above 199, then the trend is considered to be an uptrend, which means it is positive when it's seen above 100. But when it is observed to be below 100, then it is considered to be a downtrend, meaning it is negative.
How do I identify trends/patterns in a Market using MVRV?
If the MVRV ratio reads above 1(or more than 100%) and forms higher bottoms, then it signals a strong bullish market.
If the MVRV ratio reads below 1(or less than 100%) and forms lower tops, then it signals a bearish or extended bearish market.
Professor @Sapwood
Let's make some analysis when considering a short term timeframe
Short term 3 months (90 days)
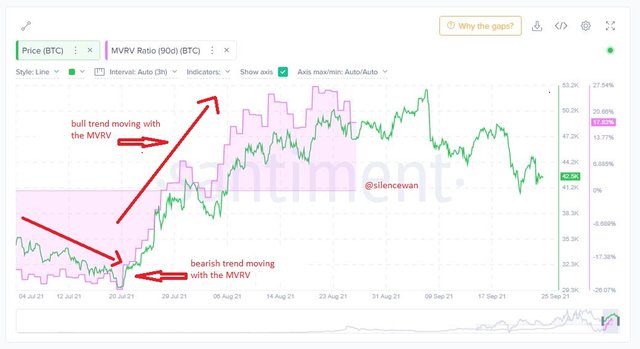
Looking at the above chart, we have seen a correlation between the MVRV Ration against the price movement. But what was observed is that the short-term timeframe does not really give a very clear price movement and looking at the rules stated. Cause we have seen that prices ranging from June through July gave a negative MVRV ratio this makes the market a bear trend. But moving away from that, from 21st July, there was a spike in the price of the asset with its correlation MVRV although there were some setbacks in the market. But overall the chart still did not go past the 100% mark as given by the MVRV ratio in a chart. Also, the chart is noisy for the short-term timeframe.
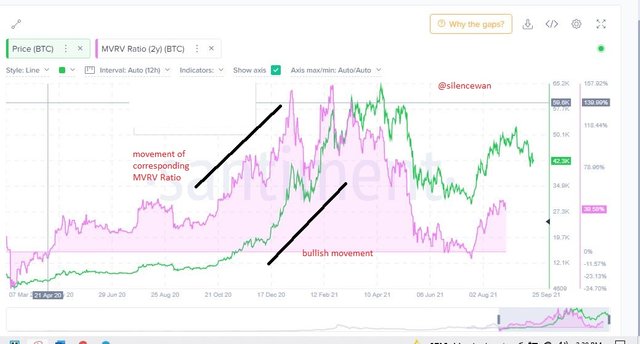
Long term Scale (2 Years)
Here in the long-term timeframe, we can see that it follows the rules that were stated. From 18th March the price was at $5,238.44 with a corresponding MVRV ratio of -29.46%. But prices starting rising steadily until the latter part of December where prices rose to $26,813 with a corresponding MVRV ratio of 103.91%. There was another massive spike through to $51,679.80 as price and then an MVRV ratio of 139.91%, and this was measured as a bullish trend. So we can see that the long-term timeframe for this is very significant compared to that of the short term.
Observation and Conclusion
We have seen clearly that the above charts represent both the short-term and longer movement. I have made my analysis of the MVRV Ratio and we could see that, in the short term, the MVRV was not more convincing to deal with. But in the case of the long term, it was superb and yielded the results as I expected does in reading the chart and the values the MVRV ratio produced. This makes it a more convincing one to use.
Question Three: Is the MVRV ratio useful in predicting a trend and take a position? How reliable are the upper threshold and lower threshold of the MVRV ratio and what does it signify? Under what condition the Realized cap will produce a steep downtrend? Explain with Examples/Screenshot?
Considering the MVRV ratio in Prediction
We have seen from my above analysis that, MVRV ratio along the price trend has useful benefits on-chain metrics. The scale at which we are able to know as a bear trend and a bull trend has so much benefit to the trader. A scale of 0 to 200 which indicates negative trends when the price is below 100 and positive trends when it's above 100 gives it that unique feature to use in the prediction of price.
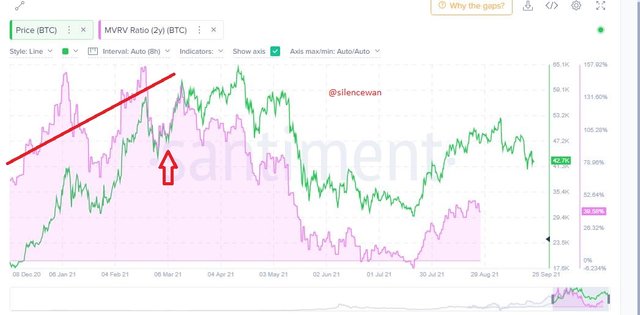
In the chart above is long term (2 years) chart for BTC. You can see that price correlates with MVRV. You can see that here, the price was at $51,704.16 with an MVRV ratio of 92.82% which is still below 100, so a negative trend being observed which a spike came in immediately after. So basically, this two are very useful in predicting the price of an asset.
How reliable are the upper threshold and lower threshold of the MVRV ratio and what does it signify
First and foremost, we have seen so many cases where prices of assets get to a point and then moves higher than that. So basically, when considering the Upper threshold, you probably might not have the right guide to make a sell because prices can go higher than their current upper threshold. So there are so many uncertainties here that are not considered reliable. But in the case of the Lower thresholds in using the MVRV ratio, it is seen as reliable most at times as we know that if the MVRV ratio does not go beyond the 100% mark on the scale it is seen as a negative trend. Observing all this will give the lower threshold the feature of the zone of accumulation.
Under what condition the Realized cap will produce a steep downtrend? Explain with Examples/Screenshot?
From analysis, it is very hard to see the Realized Cap moving in a steep downtrend. Crypto assets have always do have variations and this variation only affects the Realized cap with a very slight difference. As I stated in my definition
The Realized Cap is said to be a variation of market cap in which every section of the UTXO(Unspent Transaction Output) is valued as it is based on the last price movement and also being opposed by its current value price
So this means that UTXO is always kept, there is a balance of it as investors reserve it in the long term timeframe. So once everything is not used, it only affects the Realized cap with just a slight depreciation. But when investors turn out to sell out all their assets then there would be a massive reduction in the Realized Cap.
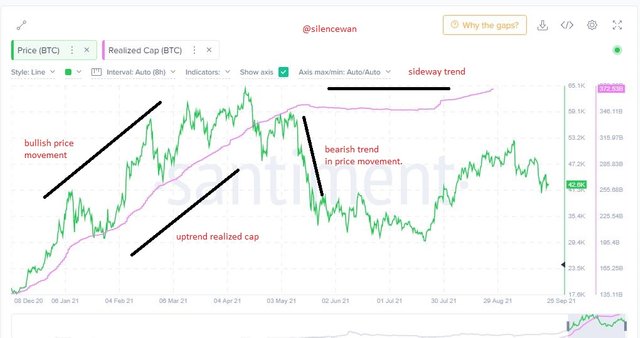
In the chart below, we will notice that there are variations in the Realized cap value as the price varies. This variation could either be an uptrend, downtrend, or even sideways when in a steep downtrend.
CONCLUSION
I would conclude by highlighting and making a summary of my submission. We know what the market cap or market capitalization means, which talks about the total representation of a companies shares or stock, and the calculation of this was also explaining my submission. Another aspect of the task was what Realized cap was which I explained to full satisfaction. Where I explained it to be the variation of market cap in which every section of the UTXO(Unspent Transaction Output) is valued as it is based on the last price movement and also being opposed by its current value price.
Unlike other technical tools that aid you in real-time price prediction. This tool was a little different and the first time having its feel. Above all, I would like to thank the professor for a wonderful course outline for the week.