Crypto Academy / Season 3 / Week 2 - Homework Post for professor @cryptokraze by @silencewan
Hello everyone, this week with professor @cryptokraze is all about Market Structure Break (MSB) Strategy to Trade Reversals. I have gone through his lecture note and it was well explained and with easy understanding. But Before I proceed to make my submissions, I will like to say a big thank you and congratulations to the professor and all the other newly appointed professors.
This week, the professor in his task has given out some questions to be tackled with and without further explaining much, I will proceed to solve the problems asked by the professor with the summary I had through making my own research.
Question One: What is Market Structure?
Market structure can generally be explained as to how industries from different sectors are classified regarding the degree and of course the nature of the competing goods and their services but in this context, thus in the crypto understanding,
it is said to be the price movement of an asset, this is either based on an uptrend direction or a downtrend direction with the help of using graphs. Traders will always want to make profits when making their trades, so this graphical representation of these said assets will give the required information the traders will need in other to go into the trader thereby making profits as everyone will want.
From my findings, there are some popular types of market structure which I will mention without explaining. These are;
- oligopoly market
- monopoly market
- monopolistic competition
- perfect competition
We know that there is some kind of actions that will always exist within the traders of the crypto assets, these actions sometimes will lead to this graphical representation known as waves. This wave-like movement of the assets will produce what we call the support and the resistance levels of any crypto asset and they are very useful and helps traders know what the current trends of the asset are like.
As said above, these movements of the assets yield upward and downward trends, that notwithstanding, there are some additional trends like the sideways direction known as the consolidation, all of this has a unique function they will perform in the market. Let's further look at these trends;
Uptrend Market Structure?
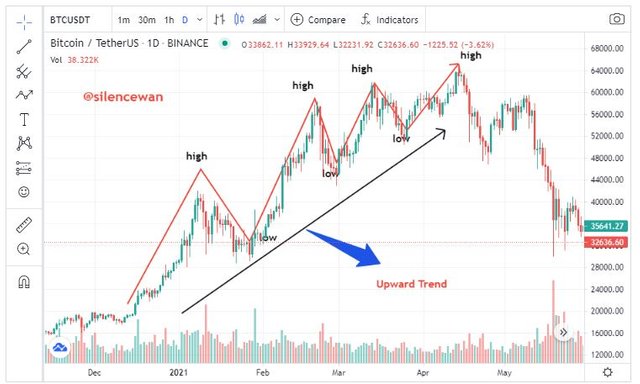
When we talking about the uptrend market structure, this can be explained as a graphical representation of the price movement of an asset in an upward manner. This means it goes up. This will produce waves with which are very consistent when moving in such directions. I will say that the uptrend can probably be experienced when the current price of any crypto asset moves higher above the previous price. I will show a screenshot of a chart indicating an upward trend with the help of the coinmarketcap trading view using the BTC/USDT
Downtrend Market Structure?
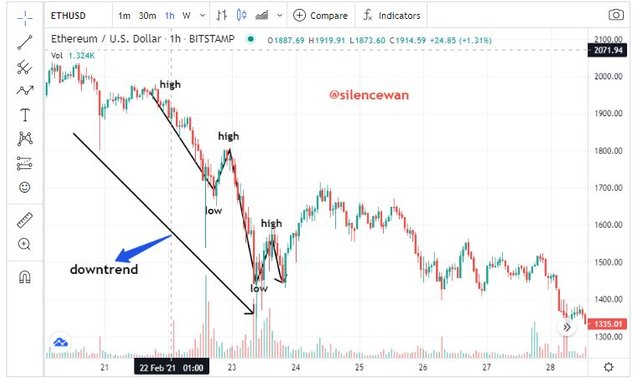
The Downtrend market Structure can be explained as the graphical representation of the price movement of an asset in the downward direction. This means that, in the case of a downtrend, the waves fall or move downwards. The movement moves with the consistency of lows and highs. This is clear when you see that, the current price of the asset moves lower than how it was, say the current price of the asset. Below is a typical example of a Downtrend Market Structure.
Sideways Market Structure?
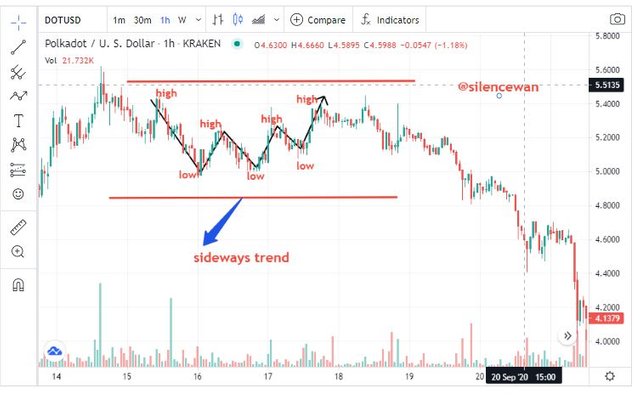
In the sideways market structure, I will say that it refers to the graphical representation of the price movement of an asset within some specified range. These kinds of trends do not mostly stay long. What we see is, the price of that asset will stay in between the support and the resistance levels of the chart. An illustration is shown below.
Question two: What do you understand about Lower High and Higher Low? Give Chart Examples from Crypto Assets.
Here, I will like to explain the fundamental concepts with regards to Highs and Lows
The above holds information about how trends formed in the market structure produce waves-like movement. This movement results in us had the support and the resistance levels in any crypto chart. This will also show the future price movement of the assets will give traders the requisite skills and ideas to avoid a loss in a trader rather than making profits. Having this idea already, these points can be grouped in each market structure we considering. We have the higher highs and the lower lows when considering an uptrend market structure and also Lower Highs and the Lower lows considering the downtrend market structure. Below are further explanations and illustrations.
The Higher Highs
The Higher highs can be explained as a type of uptrend market structure inn which is created from the swinging movement of these said crypto assets. When this happens, the assets price will create a higher high considering the previous high price of the asset. This can be confirmed or noticed when the assets points, which is the new high must be shown clearly to be higher than the previous high price. A clear illustration below.

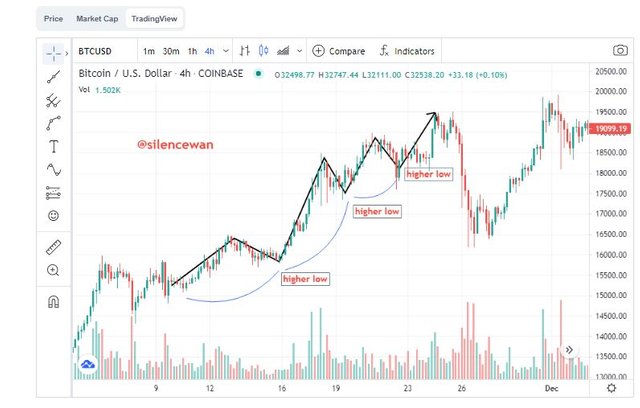
The Higher Lows
We can explain the Higher Lows as a type of uptrend in the market structure that is created at the low point of an uptrend. You can see that the points (higher low) are such that the current higher low point is higher than the previous higher low point. They show a bullish trend. An illustration below.
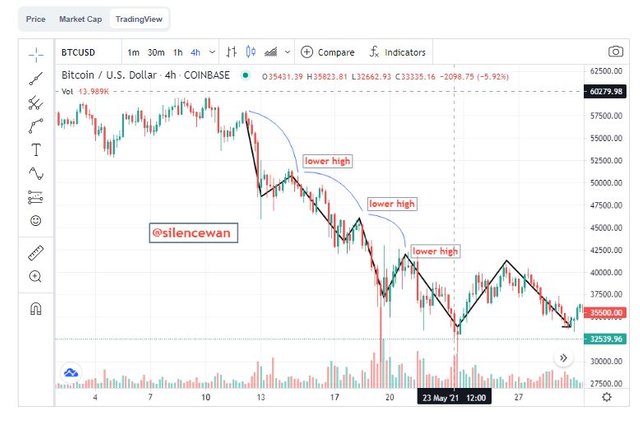
The Lower Highs
The Lower Highs is said to be a type of downtrend in the market structure that is created as a result of the downward swing movement of the assets price thereby forming a high which is lower than the previous high. It is made such that, the current high created is lower than the previous high in the trend of the market. They indicate a bearish trend when considered at the top of an uptrend. An illustration below.
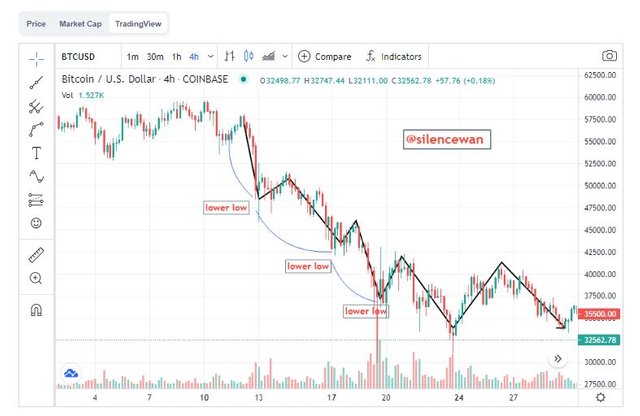
The Lower Lows
The Lower lows can be explained as the type of downtrend in the market structure that is created as a result of the downward swing movement of the assets price, when this happens, it forms a high that seems to be lower than that of the previous high. They are made such that, the current high created is lower than the previous high in the trend of the market. At the top of an uptrend, it indicates a bearish trend.
Qustion Three: How will you identify Trend Reversal early using Market Structure Break? (Screenshots Needed)
###The Trend Reversal using MSB (Market Structure Break)
When talking about trend reversals in the market structure, we will consider the habit or attitudes of the buyers and sellers, thus buyers to sellers and also sellers to buyers. This act will lead or create an early trend reversal in the market structure This early trend reversal is such that its formation is as a result of a lower high and lower low being at the top of an uptrend and also the formation of a higher low and higher high at the bottom of a downtrend.
The chart below will give a detailed description of an early trend reversal in an uptrend and downtrend with charts is shown below.
The Early Trend Reversal in an Uptrend
The formation of an early trend reversal in an Uptrend is the result of a lower high and a lower low forming at the top of an uptrend. In the case previous higher low point breakout, this will indicate a change in trend from an Uptrend to a downtrend. Below is a screenshot to show what is being explained

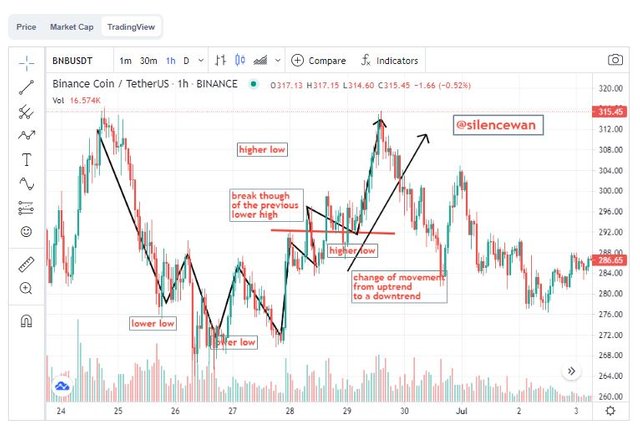
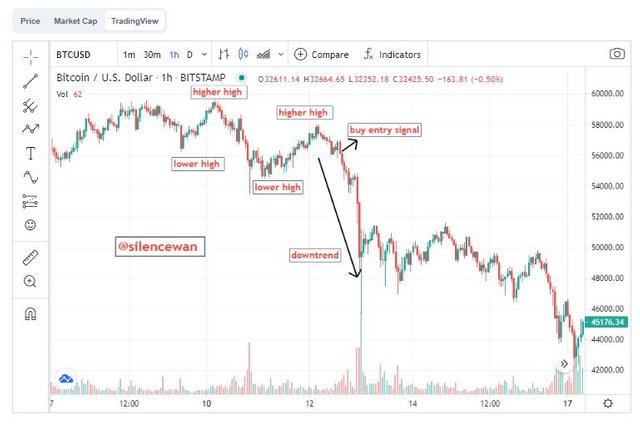
The Early Trend Reversal in a Downtrend
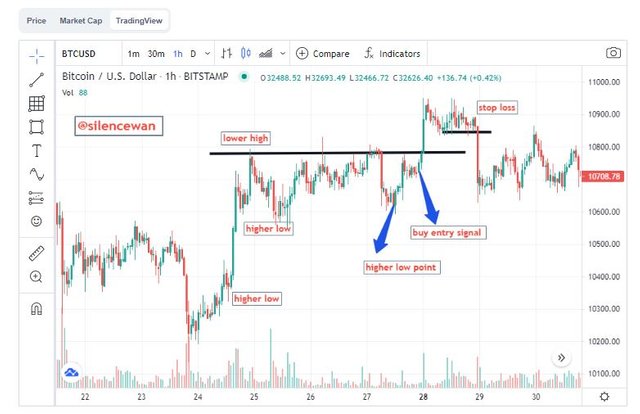
Here, the formation of an early trend reversal in an Uptrend occurs as a result of a higher low and a higher high forming at the bottom of a downtrend. When the previous lower high point breakout, it will indicate a change in trend from a downtrend to an uptrend. Show typically in the screenshot below.
Question Four: Explain Trade Entry and Exit Criteria on any Crypto Asset using any time frame of your choice (Screenshots Needed)
The Trade Entry Criteria Using MSB
We all will testify that in every trading strategy there is some kind of rules which govern it so therefore one has to follow, and in this case, is the market structure break strategy. Also, there are some rules you need to follow when using it in your trading activity. Below are the criteria involved.
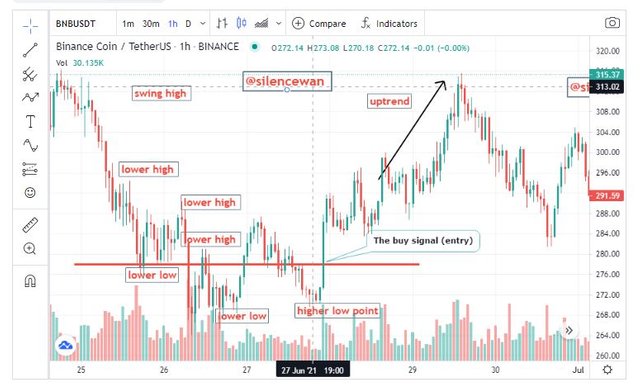
Considering The Buy entry criteria
The points stated below are the criteria for a buy entry when using market structure break strategy;
Firstly, the trade should open once you realize the bullish candle closes above the previous lower high point.
Secondly, there should be a clear formation of a higher low point.
Thirdly, there should also be an obvious downtrend forming lower highs and lower lows.
Lastly, a bullish candle is needed that breaks and opens above the previous high point, this is needed to break the resistance level.
Below is a chart to back my claim.
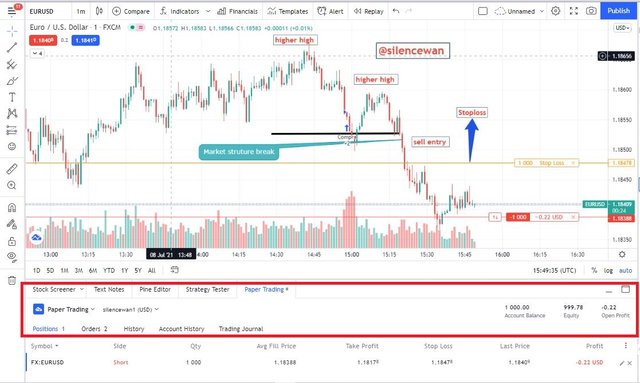
Considering The Sell entry criteria
The below points will state the criteria for a sell entry when using the market structure break strategy;
Also, there must be an ambiguous formation of a lower high point
Th first point I will mention is that there should be a very clear formation of a lower high point.
Moreso, an ambiguous bearish candle is needed which will aid in the break and close above the previous higher low point. This is needed to break the support level.
As soon as the bearish candle closes above the previous higher low point, there should be a sell trade which should be placed.
Below is a typical illustration of what is being said.
Considering The Trade exit criteria using MSB
Following the MSB, you can Exit a trade with the help of employing the following methods.
- Take Profit hit
- Manual closing
- Stoploss hit
Having mentioned this, I will be picking each of them to elaborate more on them, through that, you will be able to get a clear understanding of what or how is being done.
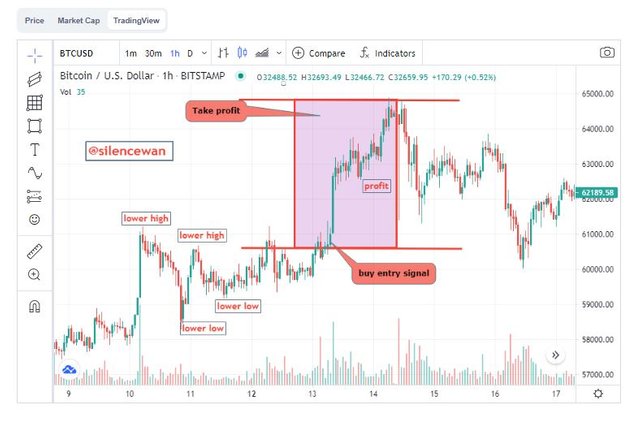
Take Profit hit method
The Take profit hit can be explained as the situation where the price is predefined, the price is being set to a target by the trader in order to make a profit. When this happens it's termed as the Take Profit hit.
Also, there is a criterion that is followed and this criterion is listed below.
The first factor to be considered is the stop-loss which is involved in the trade.
Also, another key thing to be considered should be the market structure
Lastly, a minimum of 1:1 risk to reward ratio for profit.
Charts below
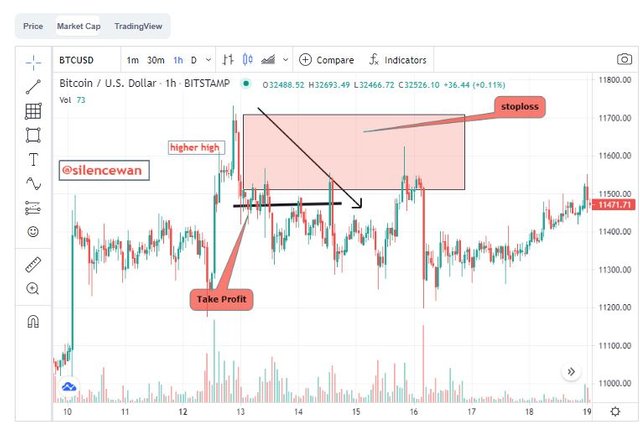
he Stoploss hit method
This can be explained as a case where a trader sets a target mark for the price of an asset that will help him in protecting his investment, or his capital, this is very key because sometimes when the market is moving in the opposite direction, you will have to use the stop loss method to keep your funds safe. Before that is done, there is a criteria that should be followed and I will be giving it to you below.
Considering the Criteria include the following
A stop loss must be involved in the trade
The stop loss should be placed below the lower low point where there is a buy signal
Also, when considering a sell trade, the stop loss must be placed above the lower high point
Shown in the illustrations below

Question Five; Place 2 demo trades on crypto assets using Market Structure Break Strategy. You can use lower timeframe for these demo trades (Screenshots Needed)
Demo Trade Using the Market Structure Break Strategy
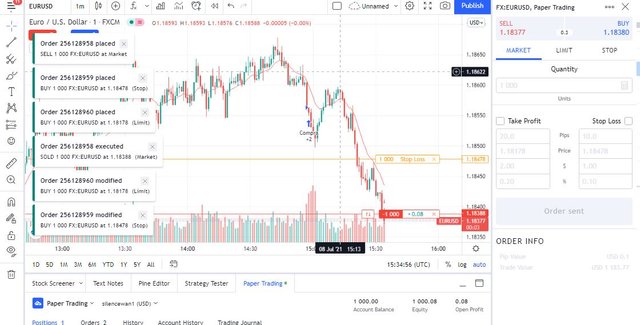
I am going to use the EURO/U.S DOLLAR pair, I am going to use the paper trade view to do my demo trade on the trading site.

It can be seen clearly that, I have visited the paper trade view, I also reset my accounts from $100 to $ 1000 which is what I will use to do my demo. I also activated the Bid and Ask line which will help me locate the current prices of the assets. There is also a box at the left top corner, one red and one blue which indicates the selling market and the buy Market.
What I will do next is to create an order. After creating the order I set the Quantity and also move to Take profit to set pips, My stop loss. Below is a screenshot.

After which I will go straight to place a sell order which I have shown in the screenshot below.
Conclusion
I will like to conclude by saying that, the Market Structure strategy was a great choice of topic for this homework task. it's quite difficult to demand kay and key observation to make your trades.
With my research and the guidance from the lecture note from the professor, I have been able to attempt the questions asked.
I will also like to say that, this is really great as it helps traders in showing them how to make their profits and stoploss. It helps in the reversal of assets and lastly helps in the analysis of the price trend of an asset which is a very important thing about this.
I will like to thank the professor for the great work done. And I hope to see him, I mean attending his lecture in the coming weeks.