[Psychology of Trends Cycle] - Crypto Academy / S6W4- Homework Post for professor @reminiscence01
Hello everyone. This is @sherazsultan. I welcome you all in the first week of 6th season where professor @reminiscence01 has taught us about "Physcology of Trend Cycle". This is my homework task.
.png)
Question 1. Explain your Understanding of the Dow Jones Theory. Do you think Dow Jones Theory is Important in technical analysis?
Dow Jones theory is a theory which is popular in finance market. This concept of Dow Jones theory was given by Chales Dow in 1897. This trend based theory helps the traders to analyze the market. They use this theory to determine the market trend and then can take the important trading decisions accordingly. According to this theory, a market can either be in bullish trend or bearish trend. There are basically just two trend and market trends keep changing from one two other.
When market move upward while making higher high where each high is higher than other high, the market is consider in bullish trend. The price is rising and market is directing from down to top. When the market is moving downward while creating lower low where each low is lower than previous low, the market is said to be in downtrend.
This theory is also known as the fundamental type of technical analysis because in Dow Jones theory, instead of considering the previous data to calculate the current and future price, inventors believed that whatever moves are taken in market is taken by getting effected from the fundamental news and demand & supply. Thus these two things helps to find out whetehr market is trending upward or it is downtrend. This theory also help to determine the market price. This theory basically determine the state of the market trend. There are three states of the market trend
- Primary Trend
- Secondary Trend
- Minor Trend
Primary trend in Dow Jones Theory is defined as the trend which go long for months and years. Secondary Trend is trend go from weeks to months And at the end, minors trend are those trend which end in few days.
This is very important theory in crypto market which help to technically analyze the market in fundamental form. This theory help to analyze the market trend. We can find out the state of market trend. In absence of this theory, we may did not be able to do that. We may not be able to find out the market trend so easily as we do with help of Dow Jones theory. Moreover, traders get to know about the demand and supply rule in the crypto market which helps to analyze the market through technical analysis. Over, traders can use the Dow jones theory to analyze the market movement and volume indicator on the chart. There are many more advantages and its important emerge with each of its cons.
Question 2. In your own words, explain the psychology behind the Accumulation and Distribution phases of the market. (Screenshots required).
There are basically two trend in the market, uptrend and downtrend. These two trends occur because of the accumulation and distribution phase. The accumulation and distribution phase are the phases when the price of coin move in ranging zone before trending in a particular direction.
The Accumulation phase can be seen at the bottom of chart which occur after a bearish trend and after the sells of the large investors for their own profits. The price of coin is low at the accumulation phase. This phase can be shown at lowest part of the trend. This phase occur because of the high selling pressure. When the market is up, the traders open the selling orders and earn profit. Because of high selling pressure, the market start trending downward. They continue to sell until the price fall more and then they close their selling positions.
This phase is actually because of the whales and big hands who want to use the small traders to raise the price up so that they can earn the profit of their own will. They first start buying the coins to create the bullish reversal signals. The small traders find it a good spot to enter into the market. They start buying because of which the demand get high and supply get decrease. Because of this, a high volatility of bullish trend is shown on the volume indicator. Then the distribution phase occur after accumulation phase
.png)
The distribution phase can be seen at the top of chart which occur after a long bullish trend and represent the area of selling interests. The price of coin is high at the distribution phase. This phase can be shown at highest part of the market trend. This phase occur because of the high buying pressure. When the market is up, the traders open the buying orders and earn profit. Because of high buying pressure, the market start trending upward. They continue to sell until the price rise more and then they close their buying positions. Then they find it good spot to open their selling positions.
AT the market distribution phase, The price pause and start moving in ranging zone. There is no particular direction of price because of the selling interests. The low bodies candles are seen on the volume indicator indicating the low momentum and low volatility. But when the sellers start selling the coins, the volatility get increase because of high selling pressure. The price start declining at the consequence. Then the accumulation phase occur after distribution phase
.png)
In the following screen short, there is accumulation phase, initially price was trending downward and after reaching to accumulation phase, the struggle between buyers and sellers started. This is accumulation phase, then price broke the accumulation phase and started trending upward because of high buying pressure. But market didn't rise up in at ones but after a little high after broking the accumulation phase, market declined a little bit because of sell position of some traders. This is known as the reaccumulation when price again fall after broking the accumulation phase, But after a little fall and creating high low, market again started rising up because of more buying orders which pull the price in upward direction.
.png)
In the following screen short, there is distribution phase, initially price was trending upward and after reaching to distribution phase, the struggle between buyers and sellers started. This is distribution phase, then price broke the distribution phase and started trending downward because of high selling pressure. But market didn't fall in at ones but after a little low after broking the distribution phase, market raised a little bit because of buy position of some traders. This is known as the redistribution when price again rise after broking the distribution phase, But after a little rise and creating low high, market again started falling down because of more selling orders which pull the price in downward direction.
.png)
3. Explain the 3 phases of the market and how they can be identified on the chart.
- Bullish/Uptrend
.png)
.png)
- Bearish/Downtrend
.png)
- Sideway Phase
Sideway is another phase of crypto market where market do not have a particular direction. This phase show the struggle of sellers and buyers. There is no proper trend and market do not move in a specific way but the low volatility and low volume is seen here. This phase is occurred because of whales during accumulation phase and distribution phase. These phases occurred at the end of the market trend. Market price keep touching the resistance and support level and continue to bounce back until it break resistance or support level.. If market is trending upward and the sideway phase occur at the uptrend, the most expected that now support level will be broken and market will fall down. If sideway or ranging phase occur at end of downtrend, then market will now break resistance and will move upward.
.png)
- How to Identify Phases in Market
There are a lot of tools to identify the market trend. Multiple indicators charts are market structure are use to identify where the market is trending. Technical indicator are very useful but market structure also helps a lot to identify the market direction when we combine it with some other tools and indicators.
- RSI
The RSI is the momentum based indicator which is very popular and well known indicator in crypto world. The traders use this indicator to analyze the market. The RSI is very powerful and useful indicator which is use in the market to get to know about the market conditions like whether the market is in overbought zone, oversold zone, trend reversal, etc.
This indicator also help to determine when the enter into the market and which is best selling spot. This indicator has 100 levels within which, it oscillate. When the RSI move below the 30 level, it indicate that the market is in oversold zone and selling pressure is high. The market price is decreasing and is in bearish trend. At this point, the bullish trend is expected. This is consider best spot to enter into the market.
When the RSI move above the 70 level, it indicate that the market is in overbought zone and buying pressure is high. The market price is increasing and is in bullish trend. At this point, the bearish trend is expected. This is consider best selling spot
.png)
4. Explain the importance of the Volume indicator. How does volume confirm a trend? Do this for the 3 phases of the market (Screenshots required)
Volume Indicator
The volume is a technical indicator which is use in the crypto market to determine the price volatility. This is very important indicator which the traders use in the market to measure the volatility in the prices. The volume indicator is shown at the lower side of the chart. This indicator consist of the candles which are red and green in color.
The volume indicator is very important to determine the momentum before placing the orders in the accumulation and distribution phase. When there is accumulation and distribution phase, the candles remain calm with low volume and short bodies. The low bodies candle indicate that there is not the high volatility in the market. In accumulation and distribution, usually the volatility remains low. When the price get reverse, there is high volume shown on the volume indicator. This indicate that there is high volatility. The volume get increase which push the price to move in the opposite direction.
- Volume indicator for bearish trend
While trending downward, there will be high volatility. Whenever coin move in downward direction, high volatility and high volume will be shown there but whenever a retracement will be occur, there will be low volatility and low volume. For example, in the below screen short, the market is trending downward. But there is not a straight or direct downward movement but coin make the retracement and impulse waves. While trending downward the lower low and low highs are formed. While forming lower low, the volume and volatility will be high in volume indicator. But when a retracement occur and coin form low high, the volume and volatility get low on the volume indicator.
.png)
- Volume indicator for bullish trend
While trending upward, there will be high volatility. Whenever coin move in upward direction, high volatility and high volume will be shown there but whenever a retracement will be occur, there will be low volatility and low volume. For example, in the below screen short, the market is trending upward. But there is not a straight or direct upward movement but coin make the retracement and impulse waves. While trending upward the higher high and high low are formed. While forming higher high, the volume and volatility will be high in volume indicator. But when a retracement occur and coin form lower low, the volume and volatility get low on the volume indicator.
.png)
Question 5. Explain the trade criteria for the three phases of the market. (show screenshots)
Bullish Trend
Market should be in upward. The coin price should be rising to open the buy order. There must be clear uptrend in the market. There should be high volume and volatility shown on the volume indicator. Market must moving up while creating higher high and high low series where each high is higher than previous high
Then wait for the price to take a retracement. The retracement is the point when price again start moving downward to form the high low. When retracement occur, wait for price to start rising upward again. When the coin start rising and some bullish candles will be formed, the buy order should be executed.
Set stop lose and take profit with 1:2 ratio, 1:3 ratio or 1:4 ratio.
.png)
Bearish Trend
Market should be in downward. The coin price should be falling to open the sell order. There must be clear downtrend in the market. There should be high volume and volatility shown on the volume indicator. Market must moving down while creating lower low where each low will be lower than previous low
Then wait for the price to take a retracement. The retracement is the point when price again start moving upward to form the low high. When retracement occur, place the sell order. Whenever the retracement occur, the traders should exit from market by placing the sell orders
Set stop lose and take profit with 1:2 ratio, 1:3 ratio or 1:4 ratio.
.png)
Sideway Phase
The sideway market is very dangerous to take any trading decision. The trader cannot decide easily whether to enter into the market or should exit from the market because market can be break by any side and any downtrend or uptrend can be start after break up of sideway phase.
In Sideway market, if the traders want to buy coin, he should wait until the market touch the support level. When coin again start rising after touching the support level, the trader should place the buy order. When the trader want to sell the coin in sideway phase, he should wait the coin to touch the resistance level. When the coin will touch the resistance and start trending downward again to touch the support level, the trader should exit from the market to earn the profit by selling coin.
.png)
Question 6. With the Trade criteria discussed in the previous question, open a demo trade for both Buy/ Sell positions.
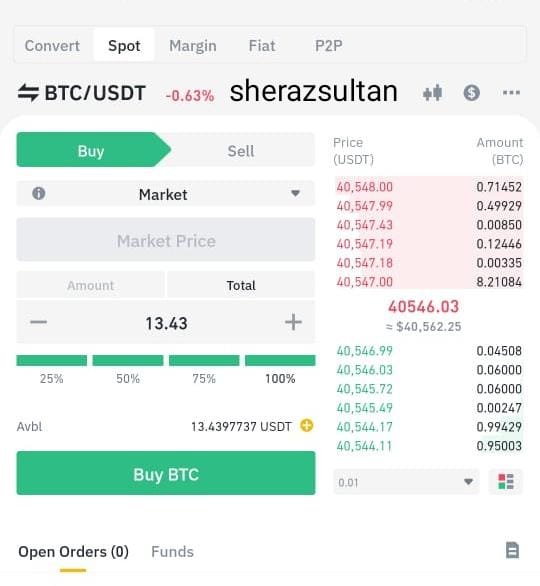
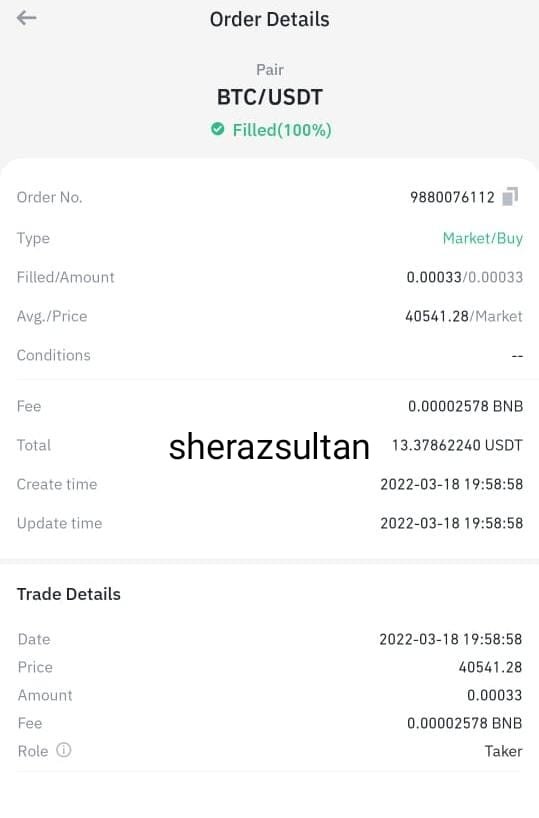
- Buy Coin
In the below screen short, we can see that the coin is trending in upward direction. There is clear uptrend where market is moving upward while creating higher highs and high low. Each high is higher than previous high. Highs are forming because of impulsive waves and high lows are formed because of the retracement waves.
Now to enter into the market, we should wait the price to bounce back and retracement to occur on the chart. We should wait for the price to start trending downward to form the high low. when retracement occur and coin start rising again after forming high low, we should enter into the market by setting the stop lose and take profit.
.png)
- Sell Coin
In the below screen short, we can see that the coin is trending in upward direction. There is clear uptrend where market is moving upward while creating higher highs and high low. Each high is higher than previous high. Highs are forming because of impulsive waves and high lows are formed because of the retracement waves.
Now to enter into the market, we should wait the price to bounce back and retracement to occur on the chart. We should wait for the price to start trending downward to form the high low. when retracement occur and coin start rising again after forming high low, we should enter into the market by setting the stop lose and take profit.
.png)
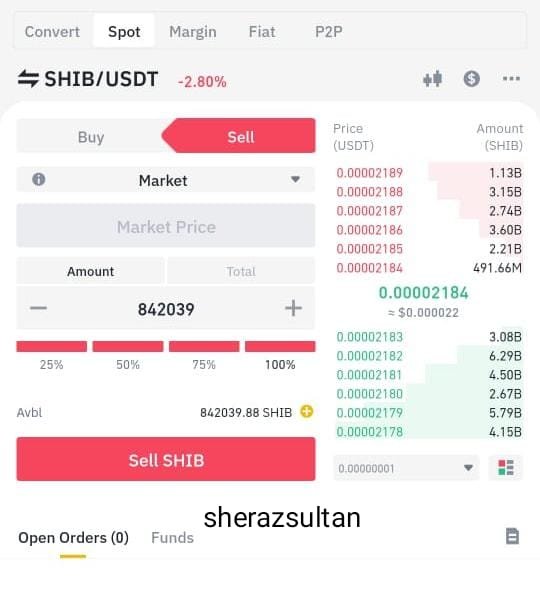
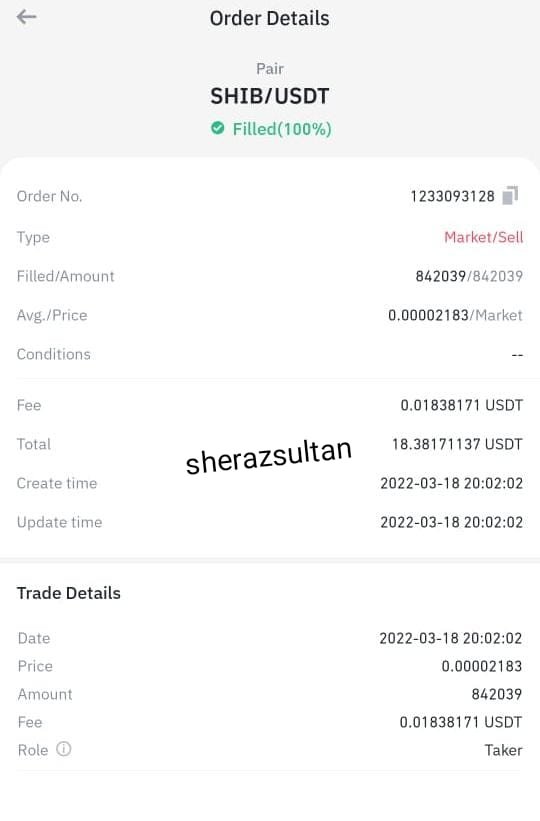
Sideway Market
To place the sell order and sell the coin in sideway phase, I will wait the coin to touch the resistance level. When the coin will touch the resistance and start trending downward again to touch the support level, the i will exit from the market to earn the profit by selling coin. In will place the stop lose, take profit and then will execute the sell order.
.png)
Conclusion
Dow Jones theory important theory in crypto market which help to technically analyze the market in fundamental form. This theory help to analyze the market trend. We can find out the state of market trend. This theory was introduced in 1897 to identify market trend. Moreover, traders get to know about the demand and supply rule in the crypto market which helps to analyze the market through technical analysis. Over, traders can use the Dow jones theory to analyze the market movement and volume indicator on the chart. There are many more advantages and its important emerge with each of its cons.
I have discussed how to identify the market phases using the Dow Jones theory. I have also discussed the volume indicator to determine whether market is trending downward, upward or sideway phase. At the end, i have practically performed all these method to place the order in uptrend downtrend and sideway moves.