[ Crypto Trading by Identifying Support and Resistance ]-[Steemit Crypto Academy - S6W3 ] - Homework Post for @shemul21
Hello everyone. Welcome to another week in steemit crypto academy. This week, we have been taught about Crypto Trading by Identifying Support and Resistance by professor @shemul21. This is my homework post.
.png)
Question 1.
What is the Support & Resistance zone?
The price of the crypto coin is very versatile. The price rise up or move down. Multiple factors are there which effect the coin's price like behavior of traders, demands & supply law, etc. So the technical analysis is very important before entering into the market or taking any trading decision. The traders should perform the technical analysis in order to predict the future of market and to decide what to do next. The historical data of the price is use in the technical analysis. The support and resistance is one important and useful technical analysis tool which the traders use to analyze the market moves and take trading decisions.
- Support Level
The support is an area where the price stop decreasing up further, the selling pressure expected to pause and price is expected to bounce back. At this level, the selling pressure get exhausted and the buyers enter into the market and stop price decreasing more, a lot of pending buying orders get executed because of which, price start moving in upward direction and trend get reverse. This is the level where the selling pressure pause, the buying pressure increase which prevent the price to move further in downward direction.
_LI.jpg)
- Resistance Level
The resistance level is an area where the price stop increasing up further, the buying pressure expected to pause and price is expected to bounce back. At this level, the sellers enter into the market and stop price increasing more, a lot of pending selling orders get executed because of which, price start moving in opposite direction and trend get reverse. This is the level where the buying pressure pause, the selling pressure increase which prevent the price to move further in upward direction. Because of consolidation of a large number of selling orders at the resistance level, the price bounce back resulting in trend reversal.
<_LI.jpg)
The below is a chart where i have drawn the support and resistance zone in form of line. The support and resistance are two price level or zone when the price take a pause and start moving in opposite direction. The trader can take important trading decisions at these spots. The best time to enter into the market when the coin is going at low and best time to sell the coin is when price is increased.
.png)
When the demand and supply change because of the behavior of the traders in market, the resistance and the support levels are formed. I have marked the support and resistance level in form of a line which cross the candle bodies or wick of candles at different points.
After hitting the supporting level, price started rising. Then it reach to the resistance level, hit it and the resistance level stop the price to move ahead further. The price bounce back and start moving downward. Again while moving downward, it hit the support level which stop price moving down more. After hitting the support level, the price again started moving up. But then a point come when the price break the support or resistance level. If price break support level while moving downward, the bearish trend occur. When the price break the resistance level while moving upward, the bullish trend occur.
- How to draw the support and resistance line
- To draw the support and resistance level, we should have a clear chart.
- Zone examine the price of the coin on the chart carefully.
- Draw the resistance and support line on the area where the price of the coin has been bounced back for multiple time, at least for three time.
- When the candle or wick of candle hit the support and resistance level, it get bounce backed and this is important point for traders to take trading deision.
Question 2.
Explain different types of Support & resistance with proper demonstration.
The resistance and support are the best level where the traders can take best trading decisions to enhance their profit and decrease the lose ratio. There are basically three types of the support and resistance level in the crypto market which can be used for this regard.
- Horizontal support and resistance
- Dynamic support and resistance.
- Sloppy support and Resistance
Horizontal Support and Resistance
The horizontal support and resistance level is the most common type of the support and resistance used in the crypto world. The traders mostly use this type of the support and resistance zone to take the trading decisions. It is formed in form of a horizontal line on the chart. The support and resistance levels are drawn as a horizontal line. When price bounce back several time while moving up, the resistance level is drawn there. When price bounce back upward while moving downward, the support level drawn there.
The most interesting fact about the Horizontal resistance and support level is the conversion of support level into resistance level and conversion of resistance level into support level. When the coin hit the support level, the buyers were not enable enough to bounce the market upward direction and the price break the support level while moving downward, the downtrend occur. In this scenario, the support level then start serving as resistance level. When the resistance level get broken while moving upward, it start serving as support level.
Sloppy Support and Resistance
The sloppy support and resistance level is another type of the resistance and support level which is drawn as a trendline in a sloppy way. The line is drawn which move as a slope with the movement of the price on the chart.
- Sloppy Support
The sloppy support line is drawn when the coin is rising upward. When the price is increasing while forming the higher highs and higher lows where each high is higher than previous high, the sloppy support line is drawn by joining the high lows. At least two to three lows should be connected or hit the sloppy support line.
.png)
- Sloppy resistance
The sloppy resistance line is drawn when the coin is declining downward. When the price is decreasing while forming the lower lows where each low is lower than previous low, the resistance sloppy line is drawn by joining the low highs. At least two to three low highs should be connected or hit the sloppy resistance line.
.png)
.png)
Dynamic Support and Resistance
This is another very useful support and resistance type which help to understand the market structure and to get the best entry or exit spots. This type of support and reversal give us the major points where the price reversal or pull back is expected. The price can be reverse or pull back at the dynamic support and resistance level.
Here the traders now do not need to draw the support and resistance level as they were drawing in the previous types. They can use any suitable technical tools to determine the support and resistance level. We can use the Super trend, MA, EMA, etc.
I have used the MA 50 to identify the dynamic support and resistance level. For an uptrend, the price is expected to move above the moving average. In this case, the MA act as the dynamic support. The price bounce back to upward whenever it hit the dynamic support. Thus the price continue to move upward .
.png)
For a downtrend, i again used the moving average 50. For a downtrend, price is suppose to move below the Moving average. The price move below the moving average and the line of moving average serve as the dynamic resistance. Whenever the price hit the dynamic resistance, it pull back to downward. Thus downtrend continue.
.png)
Question 3.
Identify The False & Successful Breakouts. (demonstrate with screenshots)
The break out are the points when the price break the support and resistance level and start moving in opposite direction. Breakouts are actually the trend reversal spots. The traders can make the best trading decisions when the breakout occurs. There are two types of the breakouts.
- False Breakouts
- Successful Breakouts
- False Breakout
When the price break the support or resistance level and expected to move in opposite direction. But when it again start moving in the previous direction, the false breakout occur. The false breakouts are occurred because of the moves of the whales and big hand investors when they want to make their own benefit by trapping the small traders.
- Successful Breakout
The successful breakout occur when the price start moving in the expected opposite direction after the breakout occur. When the price break the support level and start moving in downward direction, it is said that the successful breakout occur. When the price break the resistance level and start moving in upward direction, it can be says that the successful breakout have been occurred.
In the below chart, i have identified a successful breakout. The price was moving between the support and resistance level. The price kept bouncing back and pulling up and kept on moving between these two levels. But then it broke the resistance level and started moving upward direction. The uptrend occur. This is successful breakout. The traders can have great profit by utilizing this breakout and trend reversal spot. In successful breakout, the price move in direction of the breakout.
The following is the false breakout occurrence where the price broke the support level and started moving downward direction. The downtrend was expected and coin was assumed to move in direction of breakout. But the coin started moving opposite direction to the breakout and continue its previous movement direction. This was the false breakout
.png)
Below is another false breakout which i have been found on the chart of a coin. The price was in the uptrend. The coin price was moving between the resistance and support level. Then the price broke the resistance but came back again to downward and started moving in ranging zone. Then it broke the support and move downward.
.png)
The below is another successful breakout which is also known as the continuation breakout because here the breakouts occur in the direction of the previous trend. Implying, price continue its movement in the previous direction even after breakout. This is known as continuation breakout.
<
Question 4.
Use Volume and RSI Indicator Combined with Breakouts & Identify the Entry Point. (demonstrate with screenshots).
- RSI
The RSI is the momentum based indicator which is very popular and well known indicator in crypto world. The traders use this indicator to analyze the market. The RSI is very powerful and useful indicator which is use in the market to get to know about the market conditions like whether the market is in overbought zone, oversold zone, trend reversal, etc.
This indicator also help to determine when the enter into the market and which is best selling spot. This indicator has 100 levels within which, it oscillate. When the RSI move below the 30 level, it indicate that the market is in oversold zone and selling pressure is high. The market price is decreasing and is in bearish trend. At this point, the bullish trend is expected. This is consider best spot to enter into the market.
When the RSI move above the 70 level, it indicate that the market is in overbought zone and buying pressure is high. The market price is increasing and is in bullish trend. At this point, the bearish trend is expected. This is consider best selling spot.
- Volume Indicator
The volume indicator also a very popular and useful technical indicator which the traders use in the crypto market to analyze the coin. It is shown at the below section of the chart in form of red and green candles. The high green candles indicate the high buying pressure and high red candles show the high selling pressure. When market is in ranging zone, the volume get decrease.
I have used the RSI and volume indicator below. The price was in the ranging zone at first. The price was moving between the support and resistance zone. Whenever it hit the resistance, it got bounce back and started moving downward, whenever it got hit by the support level, it pulled upward and thus it continued it motion between these two levels. But then the coin break the resistance level and move upward direction. This indicate the trend reversal and start of new trend. The coin started rising after the breakout.
The success of the breakout was confirmed by the volume indicator. Before the breakout, the volume of the coin was low. There was no high on the volume. But then the breakout occur and we can see that the breakout was confirmed by the volume indicator too as the volume indicator show the great volume.
When moving upward, the RSI cross the 50 level and the volume indicator also showing the great volume in the upward sense, we should make an entry. I set the stop lose, take profit and execute my buy order because the RSI is above 50, so it would be best to enter into the market to have the high profit when price will reach up.
.png)
The below is another coin which was trending in ranging zone. The price was moving between the support and resistance zone. Whenever it hit the resistance, it got bounce back and started moving downward, whenever it got hit by the support level, it pulled upward and thus it continued it motion between these two levels. But then the coin break the support level and started moving in downward direction. This indicates the trend reversal and start of new trend. The coin started falling after the breakout.
The success of the breakout was confirmed by the volume indicator. Before the breakout, the volume of the coin was low. There was no high on the volume indicator. But then the breakout occur and we can see that the breakout was confirmed by the volume indicator too as the volume indicator show the great volume.
When moving downward, the RSI cross the 50 level(confirming the downtrend) and the volume indicator also showing the great volume in the downward sense, we should make an entry. I set the stop lose, take profit and execute my sell because coin is declining and if i don't sell my coin now, i would have a heavy lose.
.png)
Question 5.
Take a Real Trade(crypto pair) on Your Account After a Successful Breakout. (transaction screenshot required).
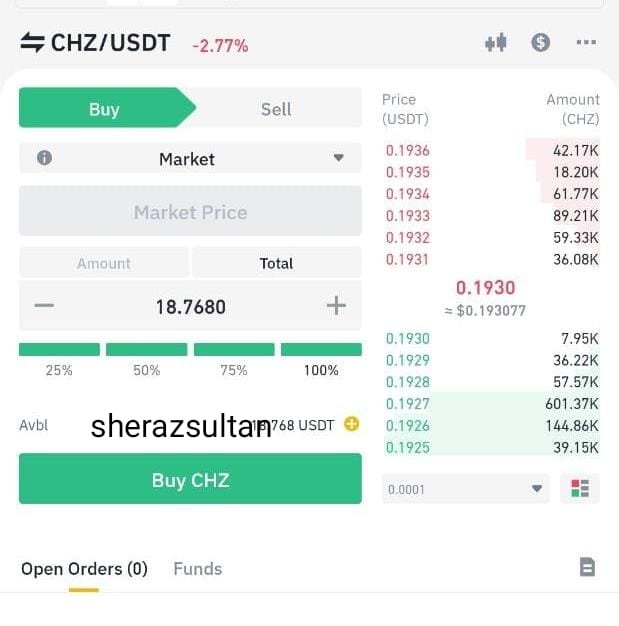
The below is the chart of SHIBUSDT . I have added the RSI and Volume indicator on the chart. The price was retesting the resistance level for several time. It moved up, hit the resistance and bounce back to downward. While moving downward, when it hit the support level, it pull up. And thus, it continued it movement between the support and resistance level. The volume indicator was also calm. There was no high volume because no big movement was taken into the market.
.png)
Then i found that price cross the resistance level while moving upward. The breakout occurred. The volume indicator also confirmed the breakout by showing the high green candles which indicate the buying opportunity. The high bars show the volatility in the price of coin. When the RSI crossed the 50 bands while moving upward, i set the stop lose, take profit and entered into the market.
.png)
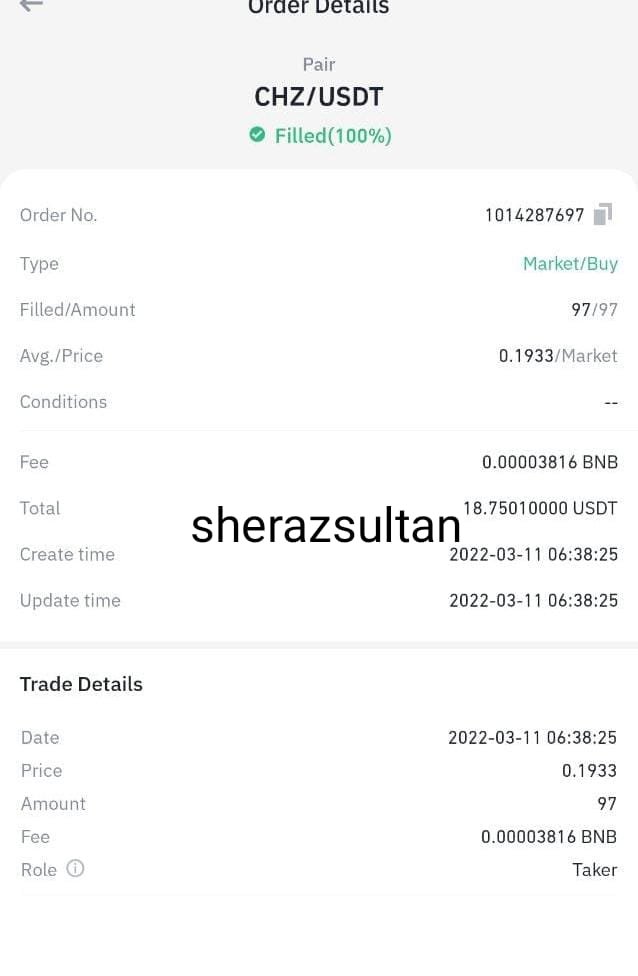
Below is my order detail.
Question 6.
Explain the Limitations of Support & Resistance (false breakout).
The market direction are being mostly change by the movement of the whales and big hands. When they take a move, it effects the market a lot and direction of market get change. They want to make profit by their trades. To achieve the profit of their own choice, the trap the small traders. This usually happen on the support and resistance level because these are best to get the buying and selling opportunities. But it is very difficult to get the direction of market after the breakout occur because market can move in any direction when the breakout occur. It is not compulsory for market to have to move in direction of breakout.
When breakout occur, the traders find it a good spot to enter into the market or exit from the market. They execute their trades because of which, the big hands reach to their set goal profit. Then they again take a move to get their own benefit and market start moving in opposite direction of breakout because of which the small traders face heavy lose.
So instead of rushing to place a trade when the breakout occur, we should wait for another confirmation of breakout occurrence. We should make it sure that the breakout is true. For confirmation of the breakout, we should wait for the price to retest the broken level. It then again start moving back in its breakout direction following the breakout. This retesting point is sign of confirmation of breakout and best spot us to make the important trading decisions.
Secondly i have used the combination of RSI and volume indicator to confirm the success of breakout. The traders can also use engulfing candle to confirm the breakout.
.png)
.png)
Conclusion
The support and resistance is one important and useful technical analysis tool which the traders use to analyze the market moves and take trading decisions. These are best levels to buy the coin or sell the coins to get the high profit. The trend get reverse when the support and resistance level break. The traders place their orders at the breakout spot. We can also combine the other technical indicator tools like RSI and volume indicator to for confirmation of breakout.
When we will combine these indicators with the resistance and breakout strategy, we will get the more accurate and authentic results. We will be able to take he trading decisions more confidently then. But it is not necessary for the coin to follow the direction of the breakout. The coin may move opposite to the breakout direction because of which the traders may face lose. So before taking any trading decision, they trader should make it sure that the breakout is real, successful and not the false.
<